| Param | Original file | Final file |
|---|---|---|
| Filename | modeM0/AS1A05_004T03_9000002508_16904cztM0_level2.evt | modeM0/AS1A05_004T03_9000002508_16904cztM0_level2_quad_clean.evt |
| Size (bytes) | 668,234,880 | 49,838,400 |
| Size | 637.3 MB | 47.5 MB |
| Events in quadrant A | 9,327,123 | 237,812 |
| Events in quadrant B | 3,419,373 | 286,690 |
| Events in quadrant C | 3,244,136 | 269,283 |
| Events in quadrant D | 3,804,463 | 258,950 |
| Mode M0 | |||
|---|---|---|---|
| Quadrant | BADHDUFLAG | Total packets | Discarded packets |
| A | 0 | 32212 | 2 |
| B | 0 | 14232 | 2 |
| C | 0 | 13643 | 2 |
| D | 0 | 15562 | 3 |
| Mode SS | |||
|---|---|---|---|
| Quadrant | BADHDUFLAG | Total packets | Discarded packets |
| A | 0 | 132 | 0 |
| B | 0 | 132 | 0 |
| C | 0 | 132 | 0 |
| D | 0 | 132 | 0 |
| Mode M9 | |||
|---|---|---|---|
| Quadrant | BADHDUFLAG | Total packets | Discarded packets |
| A | 0 | 18 | 0 |
| B | 0 | 19 | 0 |
| C | 0 | 19 | 0 |
| D | 0 | 19 | 0 |
| Quadrant | Total seconds | Saturated seconds | Saturation percentage |
|---|---|---|---|
| A | 6534 | 2489 | 38.093052% |
| B | 6534 | 34 | 0.520355% |
| C | 6534 | 45 | 0.688705% |
| D | 6533 | 129 | 1.974591% |
Noise dominated data is calculated using 1-second bins in cleaned event files. If a bin has >2000 counts, and if more than 50% of those come from <1% of pixels, then it is considered to be noise-dominated and hence unusable.
| Quadrant | # 1 sec bins | Bins with >0 counts | Bins with >2000 counts | High rate bins dominated by noise | Noise dominated (total time) | Noise dominated (detector-on time) | Marked lightcurve |
|---|---|---|---|---|---|---|---|
| A | 7785 | 6536 | 1873 | 1873 | 24.06% | 28.66% | 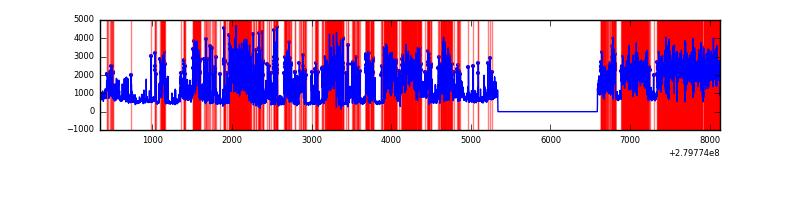 |
| B | 7785 | 6536 | 2 | 2 | 0.03% | 0.03% | 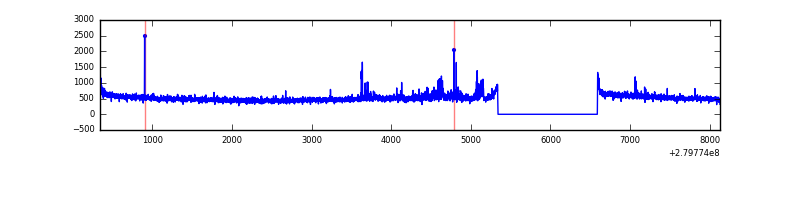 |
| C | 7785 | 6536 | 0 | 0 | 0.00% | 0.00% |  |
| D | 7784 | 6535 | 95 | 95 | 1.22% | 1.45% | 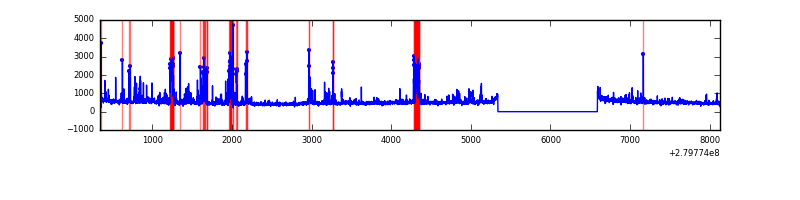 |
Top three noisy pixels from each quadrant. If the there are fewer than three noisy pixels in the level2.evt file, extra rows are filled as -1
| Pixel properties | Quadrant properties | ||||||
|---|---|---|---|---|---|---|---|
| Quadrant | DetID | PixID | Counts | Sigma | Mean | Median | Sigma |
| A | 15 | 174 | 6336108 | 45458.9 | 694 | 682 | 139.4 |
| A | 4 | 2 | 299205 | 2142.01 | 694 | 682 | 139.4 |
| A | 12 | 189 | 17276 | 119.07 | 694 | 682 | 139.4 |
| B | 15 | 35 | 89163 | 568.0 | 833 | 815 | 155.5 |
| B | 0 | 189 | 23590 | 146.42 | 833 | 815 | 155.5 |
| B | 4 | 216 | 18846 | 115.92 | 833 | 815 | 155.5 |
| C | 14 | 238 | 125630 | 684.0 | 790 | 797 | 182.5 |
| C | 3 | 233 | 36469 | 195.46 | 790 | 797 | 182.5 |
| C | 13 | 61 | 5770 | 27.25 | 790 | 797 | 182.5 |
| D | 1 | 52 | 596528 | 3130.71 | 788 | 766 | 190.3 |
| D | 12 | 235 | 124474 | 650.08 | 788 | 766 | 190.3 |
| D | 2 | 33 | 75677 | 393.66 | 788 | 766 | 190.3 |
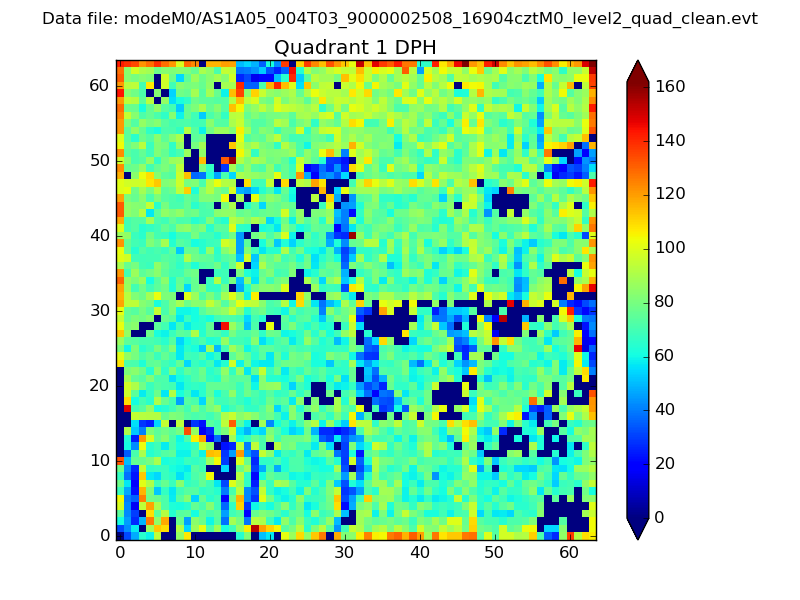
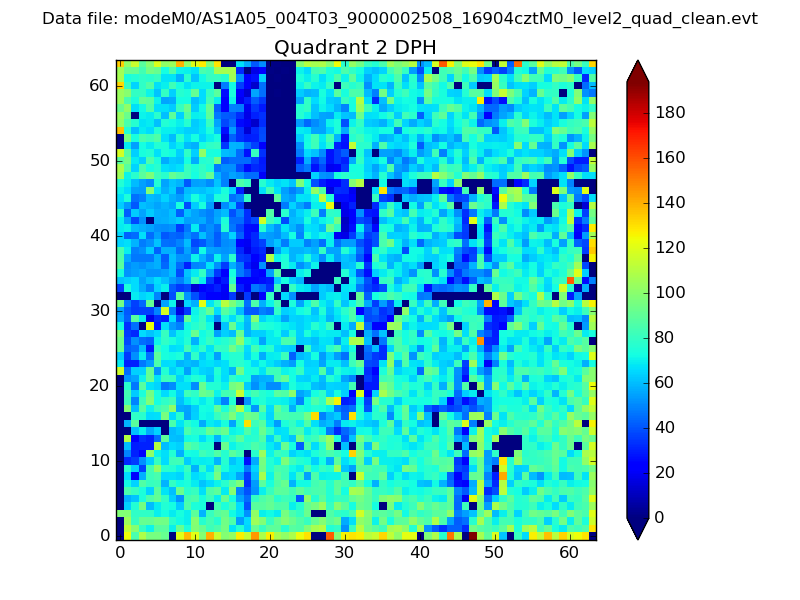
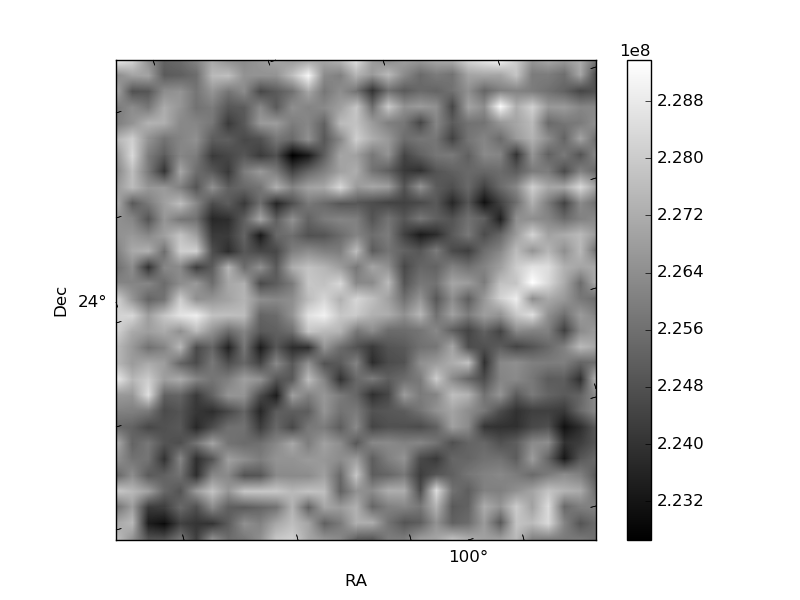
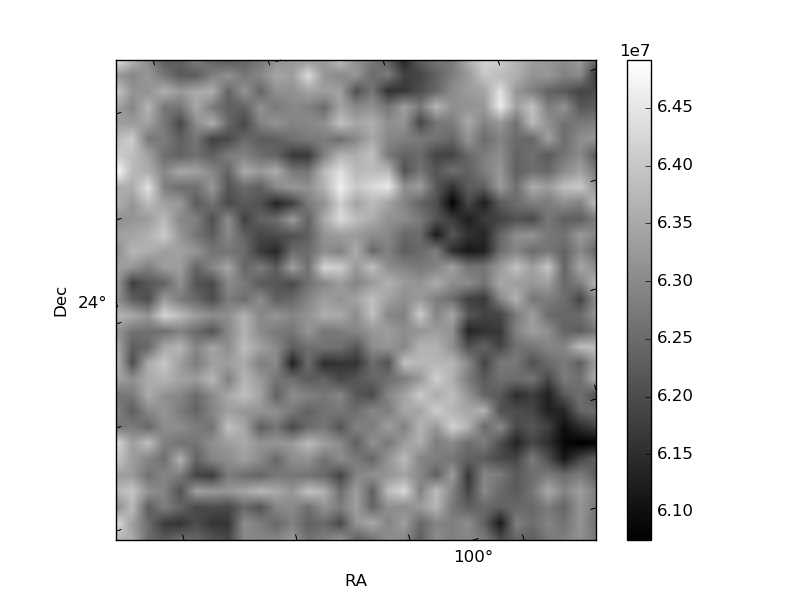
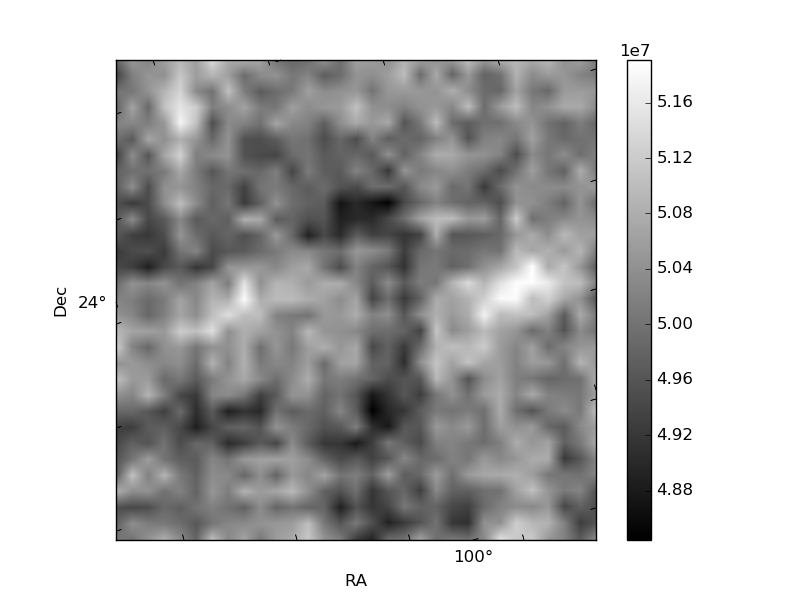
Histogram calculated using DETX and DETY for each event in the final _common_clean file
| Quadrant A | 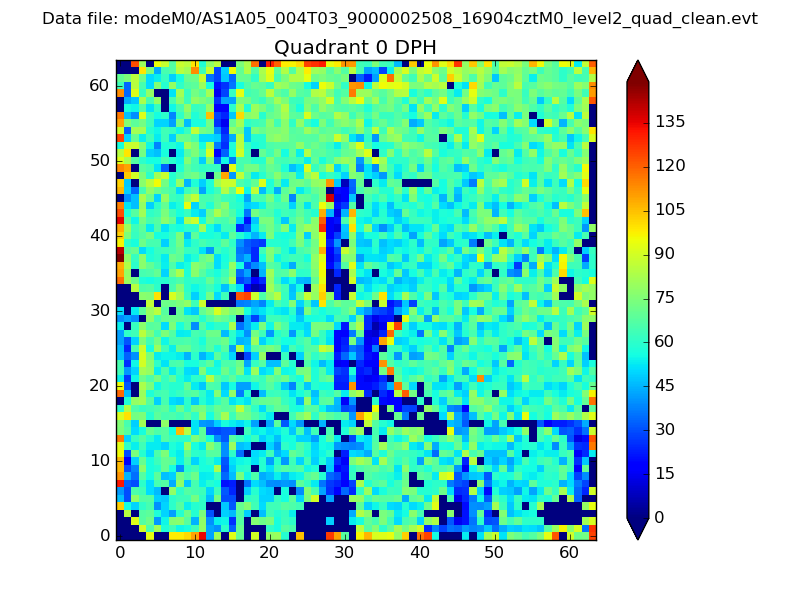 |
 |
Quadrant B |
|---|---|---|---|
| Quadrant D | 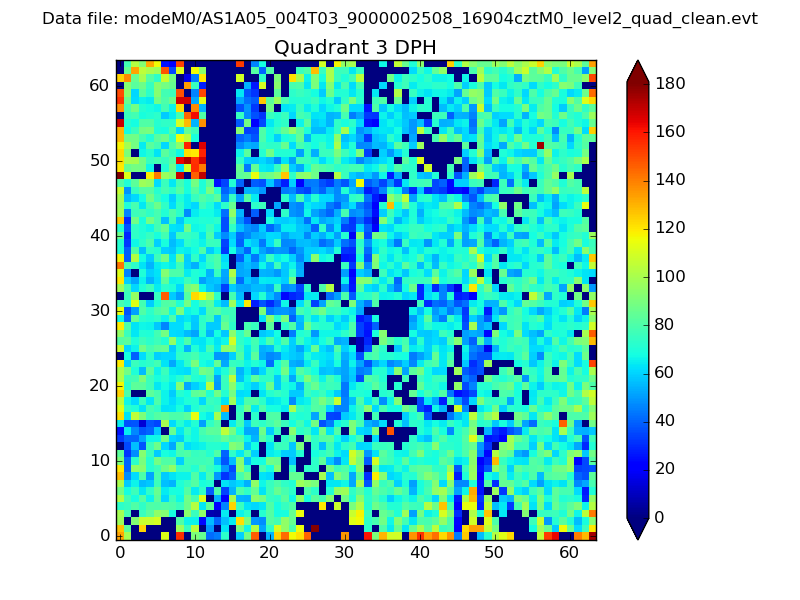 |
 |
Quadrant C |
| Plot type | Count rate plots | Images |
|---|---|---|
| Comparison with Poisson distribution Blue bars denote a histogram of data divided into 1 sec bins. Red curve is a Poisson curve with rate = median count rate of data. |
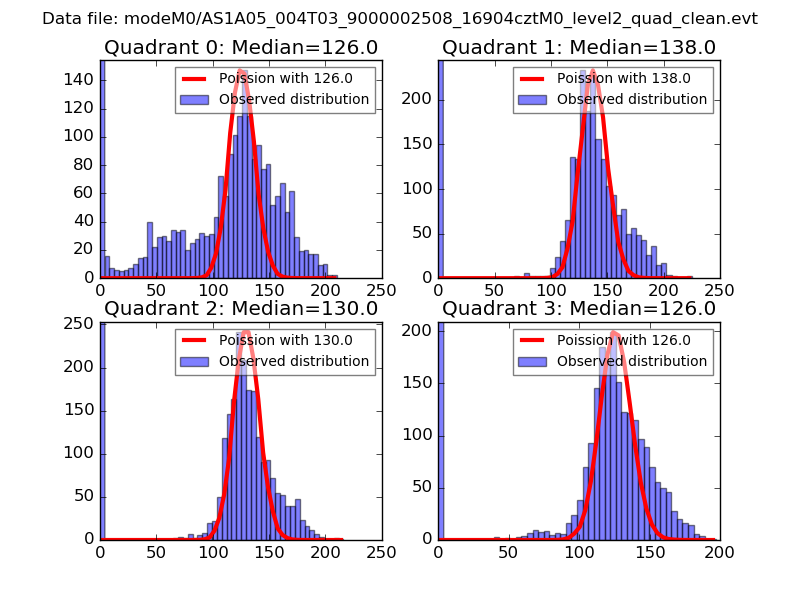 |
 |
| Quadrant-wise count rates Data is divided into 100 sec bins |
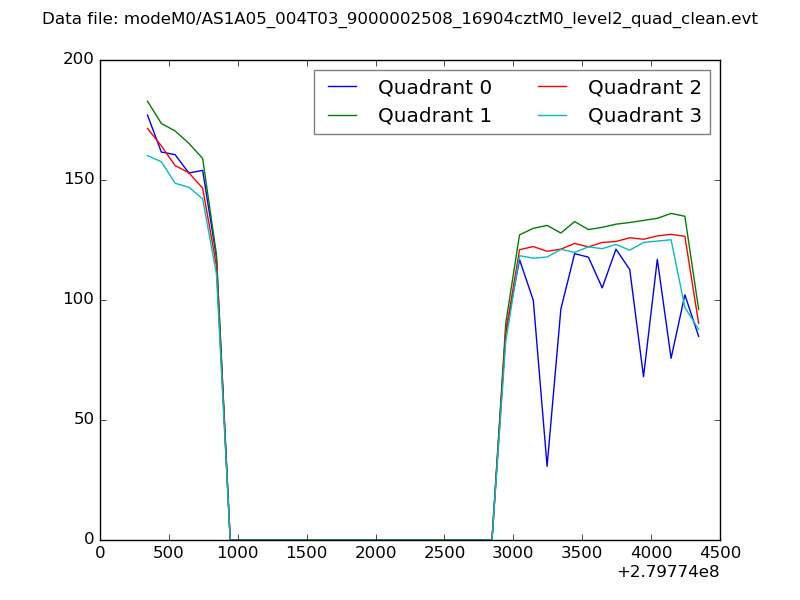 |
|
| Module-wise count rates for Quadrant A Data is divided into 100 sec bins |
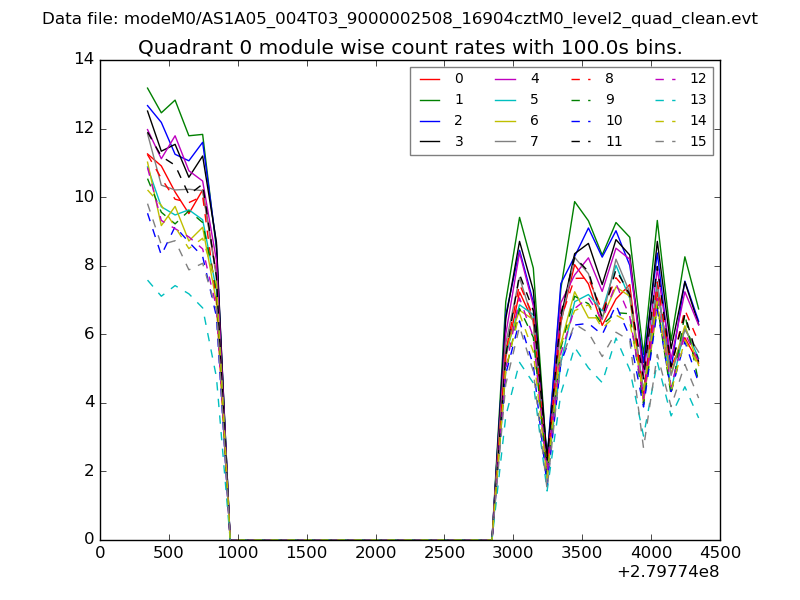 |
 |
| Module-wise count rates for Quadrant B Data is divided into 100 sec bins |
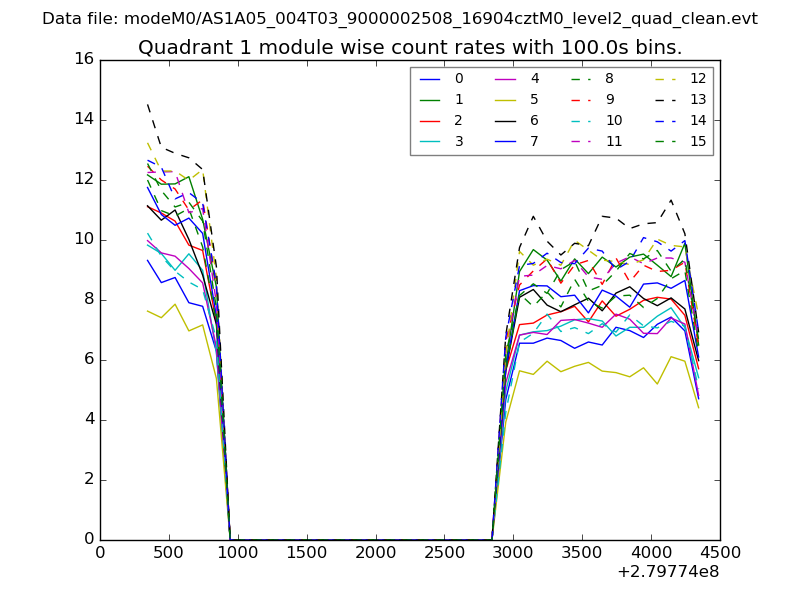 |
 |
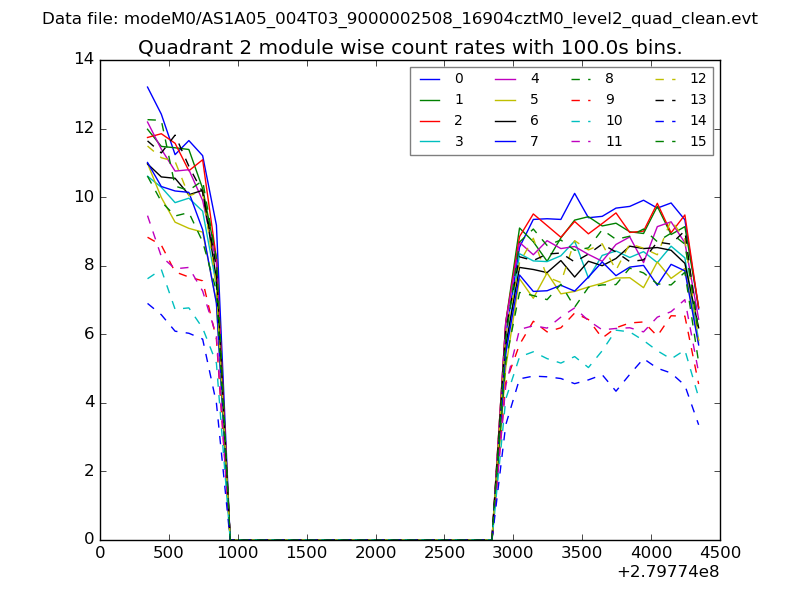
| Module-wise count rates for Quadrant C Data is divided into 100 sec bins |
 |
 |
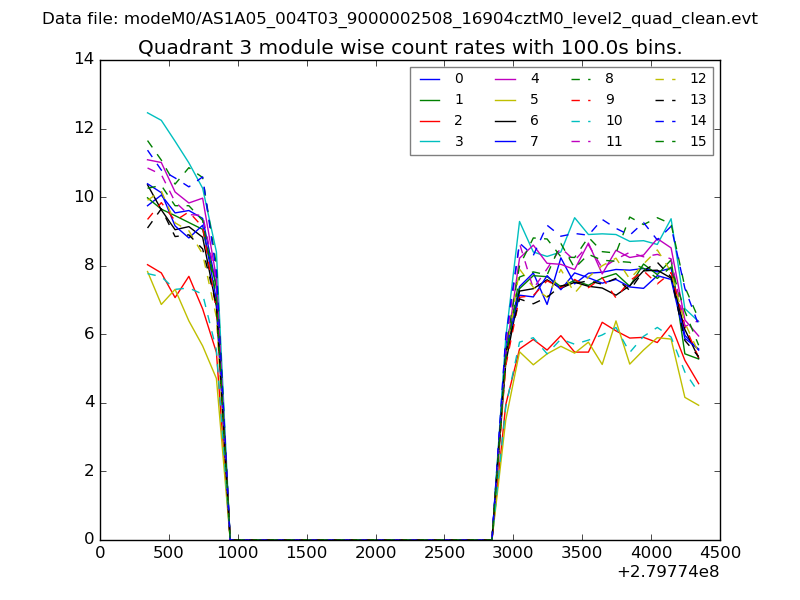
| Module-wise count rates for Quadrant D Data is divided into 100 sec bins |
 |
 |
| Parameter | Plot |
|---|---|
| CZT HV Monitor | 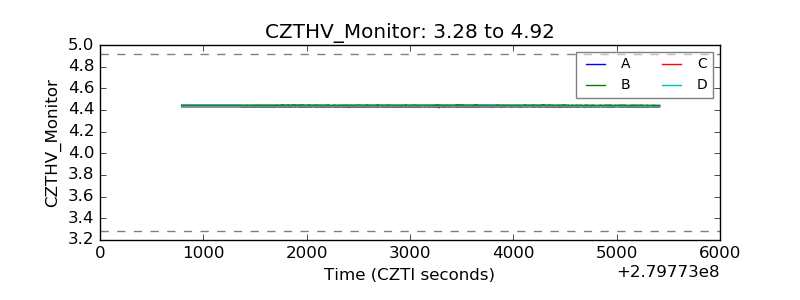 |
| D_VDD | 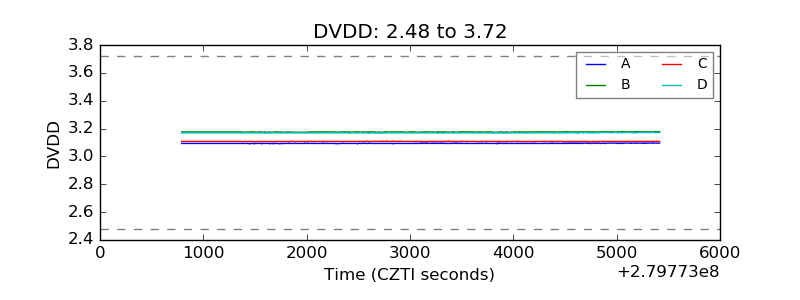 |
| Temperature 1 | 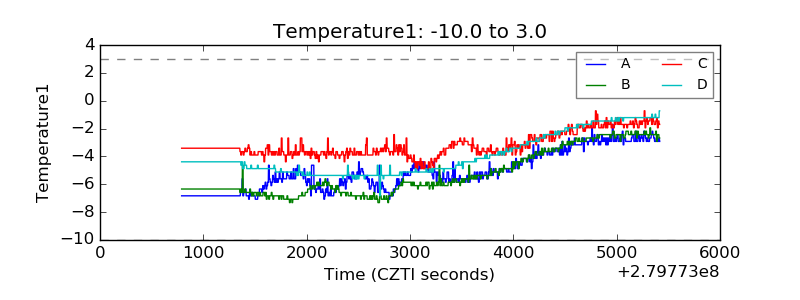 |
| Veto HV Monitor | 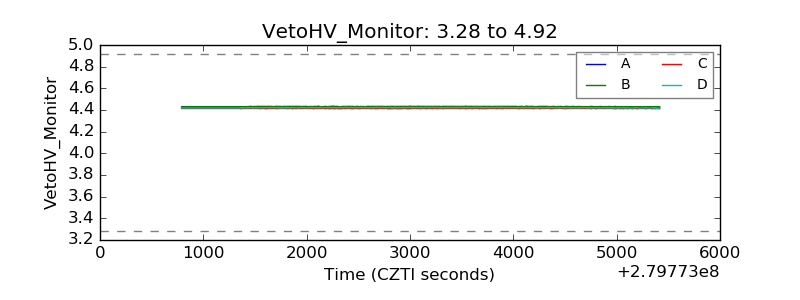 |
| Veto LLD | 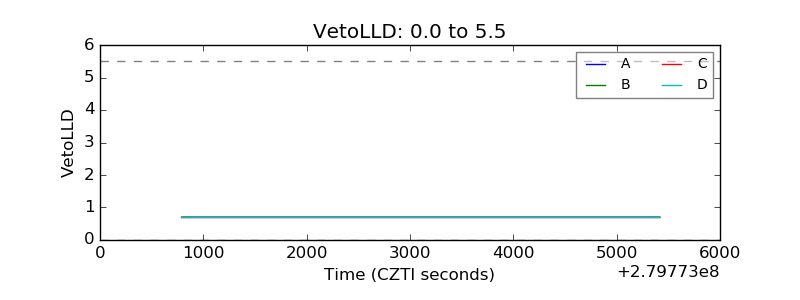 |
| Alpha Counter | 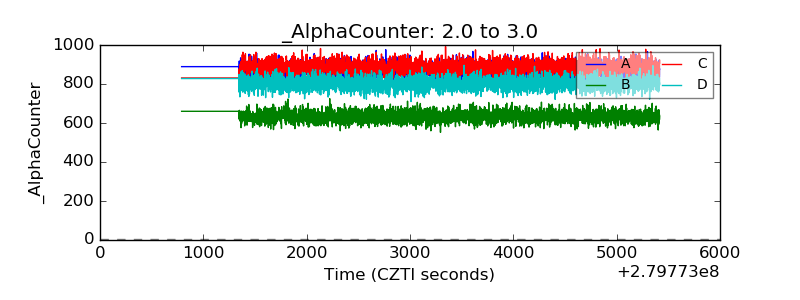 |
| _CPM_Rate | 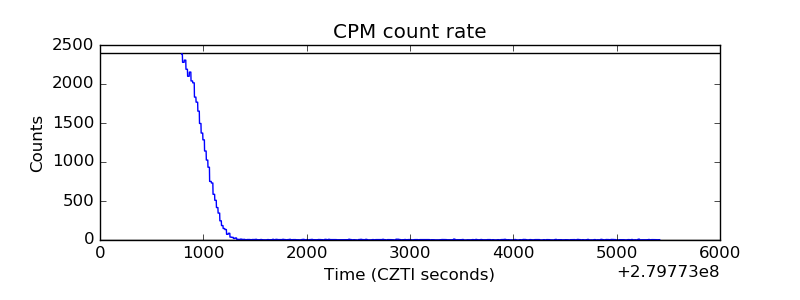 |
| CZT Counter | 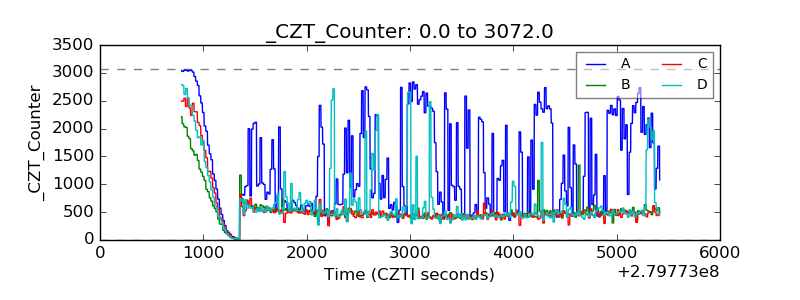 |
| +2.5 Volts monitor | 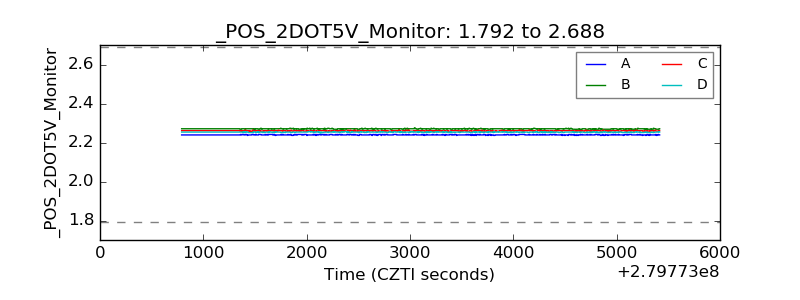 |
| +5 Volts monitor |  |
| _ROLL_ROT | 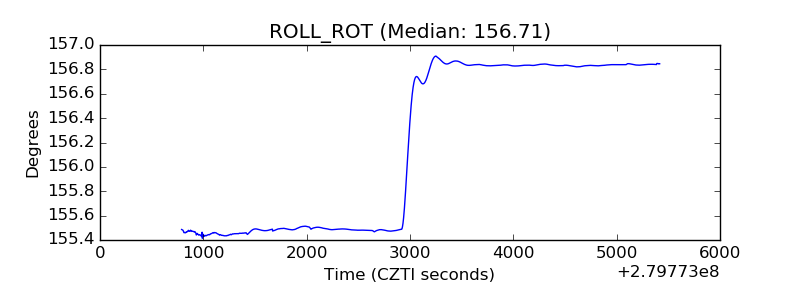 |
| _Roll_DEC | 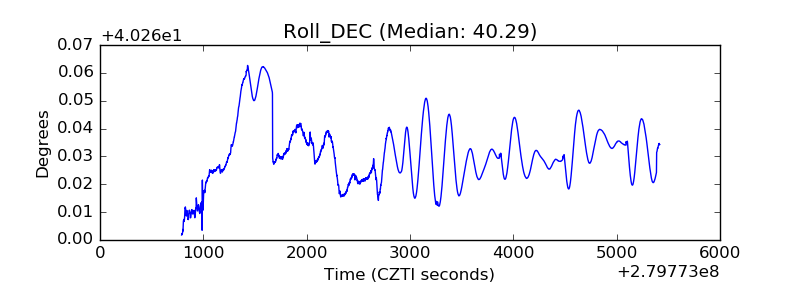 |
| _Roll_RA | 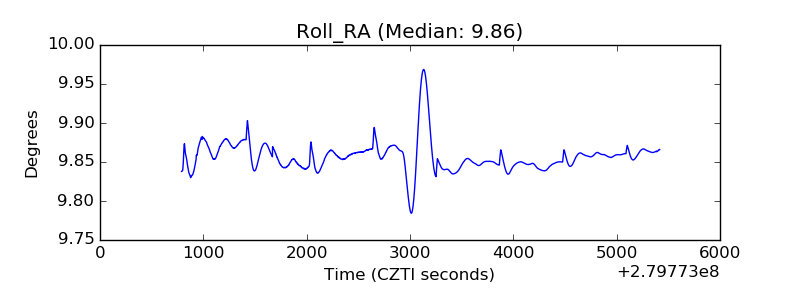 |
| Veto Counter | 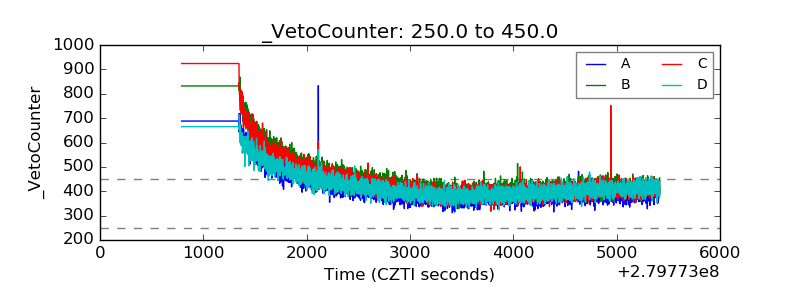 |