| Param | Original file | Final file |
|---|---|---|
| Filename | modeM0/AS1A05_004T03_9000002508_16905cztM0_level2.evt | modeM0/AS1A05_004T03_9000002508_16905cztM0_level2_quad_clean.evt |
| Size (bytes) | 647,809,920 | 58,628,160 |
| Size | 617.8 MB | 55.9 MB |
| Events in quadrant A | 9,164,981 | 279,679 |
| Events in quadrant B | 3,161,153 | 375,861 |
| Events in quadrant C | 3,174,228 | 355,744 |
| Events in quadrant D | 3,710,706 | 342,625 |
| Mode M0 | |||
|---|---|---|---|
| Quadrant | BADHDUFLAG | Total packets | Discarded packets |
| A | 0 | 31212 | 1 |
| B | 0 | 12866 | 1 |
| C | 0 | 12985 | 1 |
| D | 0 | 14880 | 1 |
| Mode SS | |||
|---|---|---|---|
| Quadrant | BADHDUFLAG | Total packets | Discarded packets |
| A | 0 | 122 | 0 |
| B | 0 | 122 | 0 |
| C | 0 | 122 | 0 |
| D | 0 | 122 | 0 |
| Mode M9 | |||
|---|---|---|---|
| Quadrant | BADHDUFLAG | Total packets | Discarded packets |
| A | 0 | 13 | 0 |
| B | 0 | 13 | 0 |
| C | 0 | 13 | 0 |
| D | 0 | 13 | 0 |
| Quadrant | Total seconds | Saturated seconds | Saturation percentage |
|---|---|---|---|
| A | 6019 | 2988 | 49.642798% |
| B | 6020 | 54 | 0.897010% |
| C | 6020 | 57 | 0.946844% |
| D | 6020 | 82 | 1.362126% |
Noise dominated data is calculated using 1-second bins in cleaned event files. If a bin has >2000 counts, and if more than 50% of those come from <1% of pixels, then it is considered to be noise-dominated and hence unusable.
| Quadrant | # 1 sec bins | Bins with >0 counts | Bins with >2000 counts | High rate bins dominated by noise | Noise dominated (total time) | Noise dominated (detector-on time) | Marked lightcurve |
|---|---|---|---|---|---|---|---|
| A | 7320 | 6021 | 2167 | 2167 | 29.60% | 35.99% | 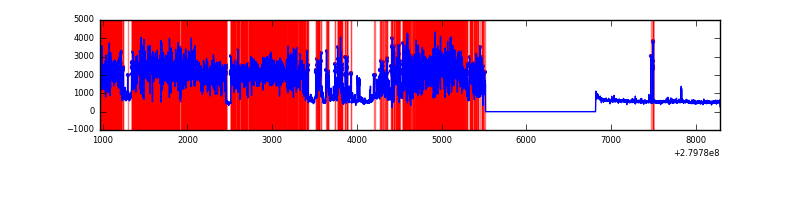 |
| B | 7321 | 6022 | 1 | 1 | 0.01% | 0.02% | 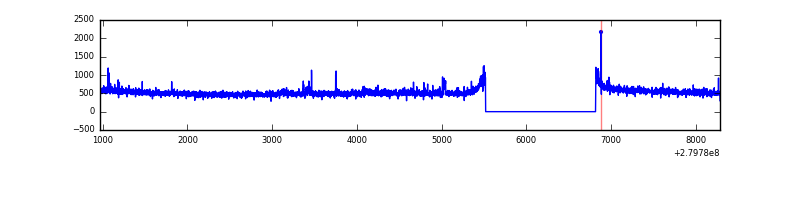 |
| C | 7321 | 6022 | 0 | 0 | 0.00% | 0.00% | 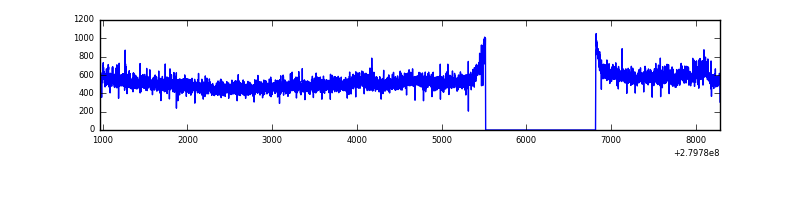 |
| D | 7321 | 6022 | 30 | 30 | 0.41% | 0.50% | 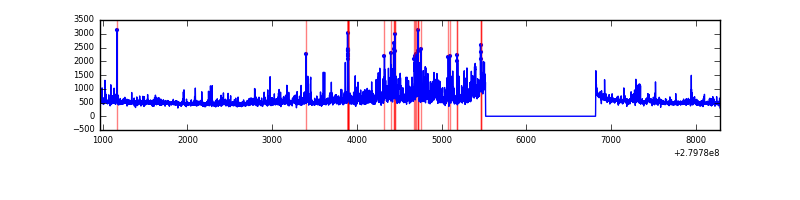 |
Top three noisy pixels from each quadrant. If the there are fewer than three noisy pixels in the level2.evt file, extra rows are filled as -1
| Pixel properties | Quadrant properties | ||||||
|---|---|---|---|---|---|---|---|
| Quadrant | DetID | PixID | Counts | Sigma | Mean | Median | Sigma |
| A | 15 | 174 | 6644226 | 51860.91 | 646 | 635 | 128.1 |
| A | 12 | 189 | 21764 | 164.94 | 646 | 635 | 128.1 |
| A | 9 | 143 | 11969 | 88.47 | 646 | 635 | 128.1 |
| B | 0 | 189 | 24147 | 158.4 | 790 | 772 | 147.6 |
| B | 12 | 111 | 16808 | 108.67 | 790 | 772 | 147.6 |
| B | 0 | 219 | 14781 | 94.93 | 790 | 772 | 147.6 |
| C | 3 | 233 | 146228 | 852.81 | 745 | 751 | 170.6 |
| C | 14 | 238 | 118440 | 689.91 | 745 | 751 | 170.6 |
| C | 13 | 61 | 5450 | 27.55 | 745 | 751 | 170.6 |
| D | 1 | 52 | 474586 | 2610.99 | 750 | 730 | 181.5 |
| D | 12 | 235 | 378367 | 2080.81 | 750 | 730 | 181.5 |
| D | 2 | 234 | 26276 | 140.76 | 750 | 730 | 181.5 |
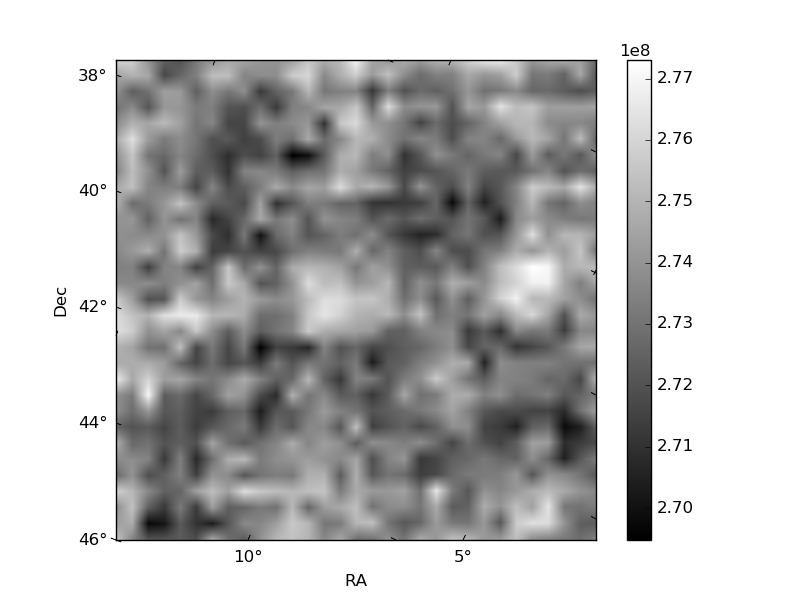
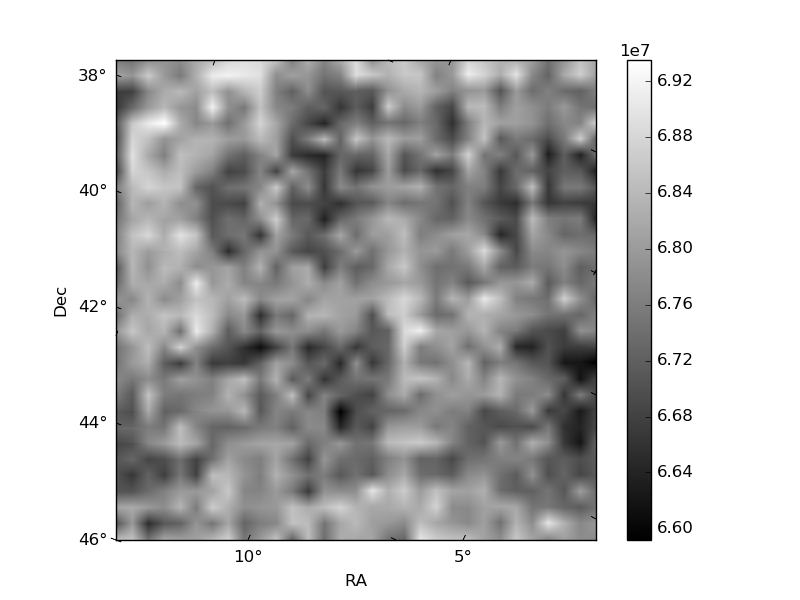
Histogram calculated using DETX and DETY for each event in the final _common_clean file
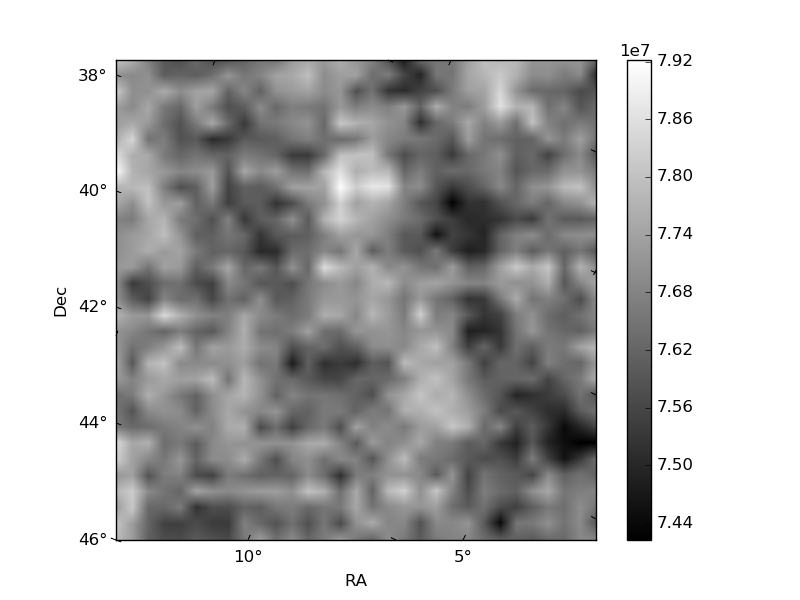
| Quadrant A | 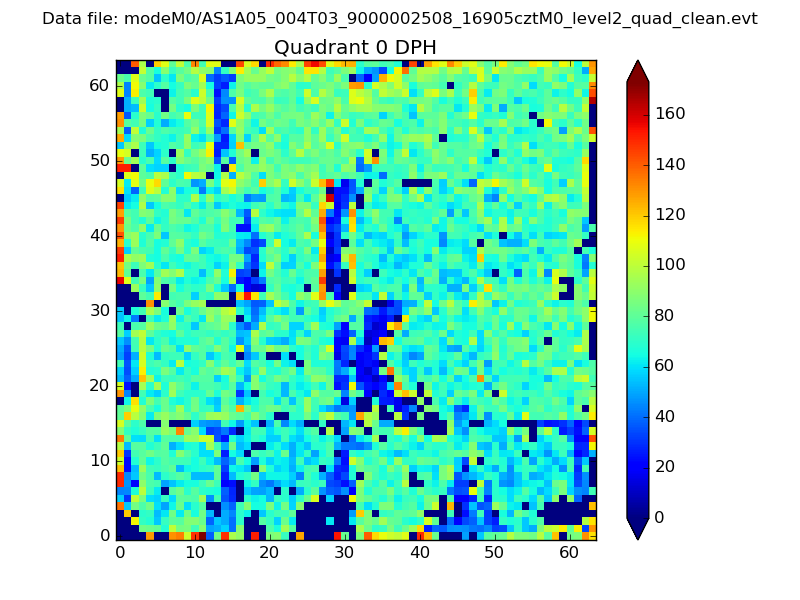 |
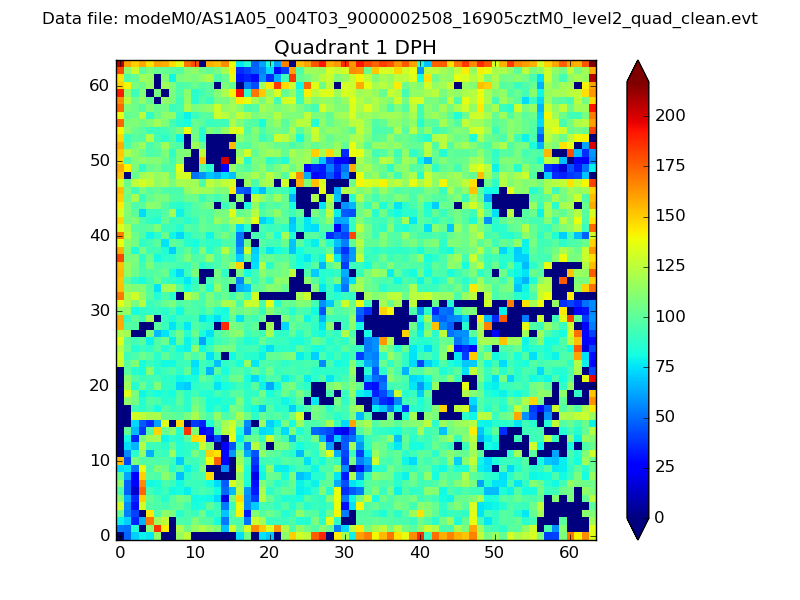 |
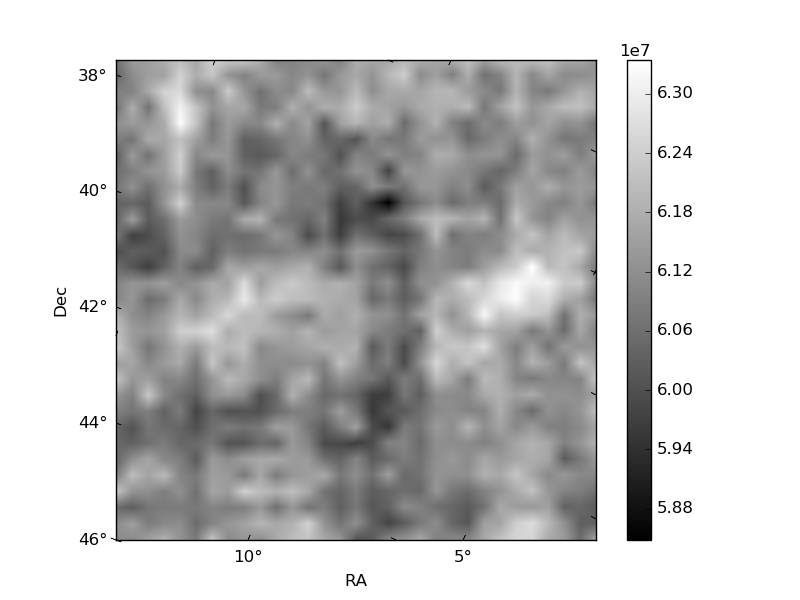
Quadrant B |
|---|---|---|---|
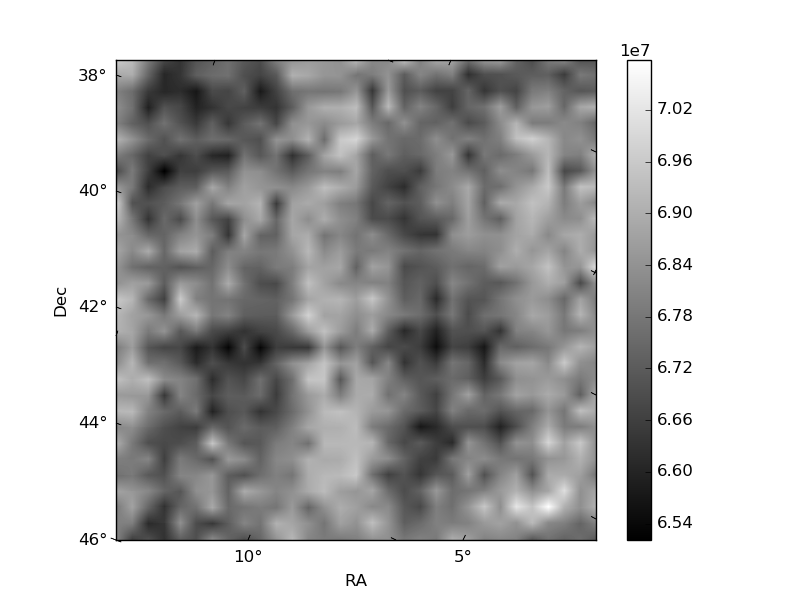
| Quadrant D | 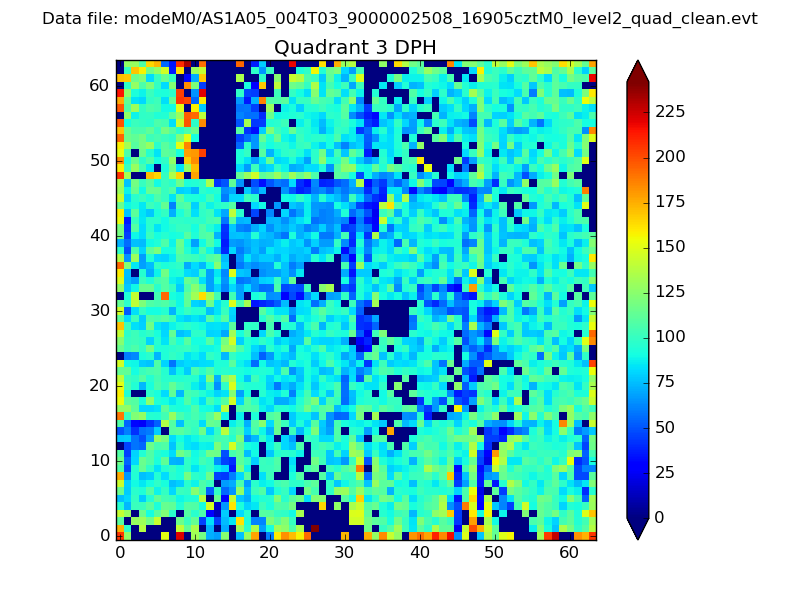 |
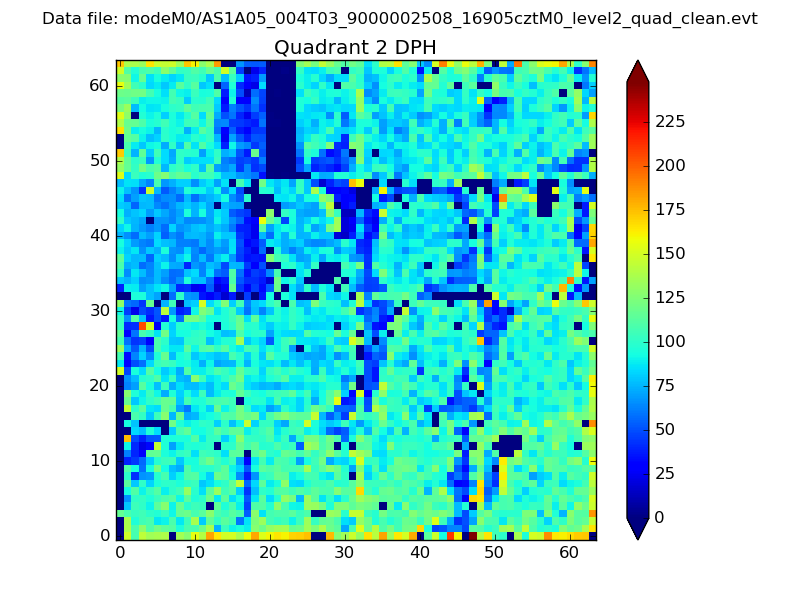 |
Quadrant C |
| Plot type | Count rate plots | Images |
|---|---|---|
| Comparison with Poisson distribution Blue bars denote a histogram of data divided into 1 sec bins. Red curve is a Poisson curve with rate = median count rate of data. |
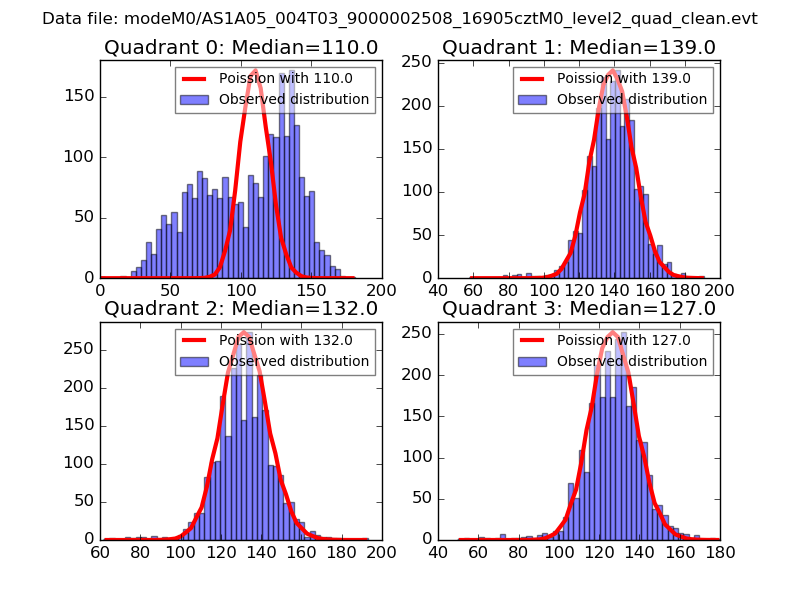 |
 |
| Quadrant-wise count rates Data is divided into 100 sec bins |
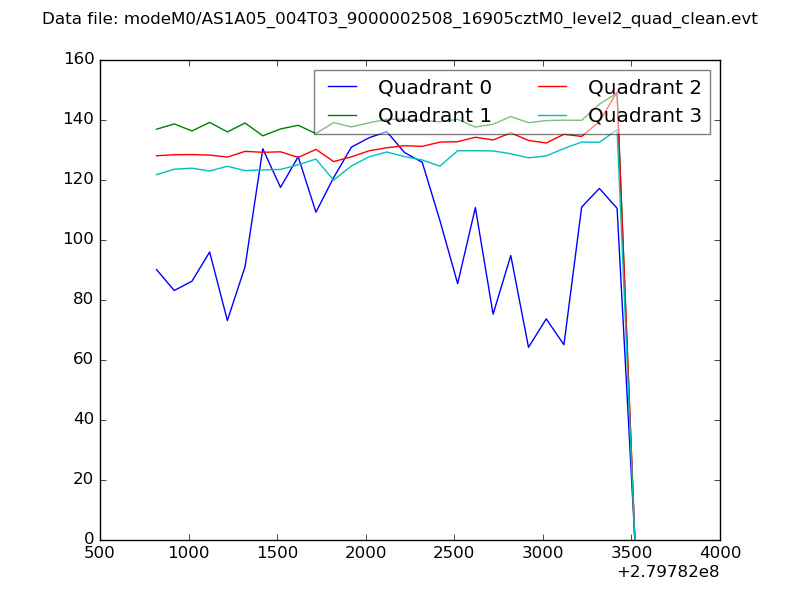 |
|
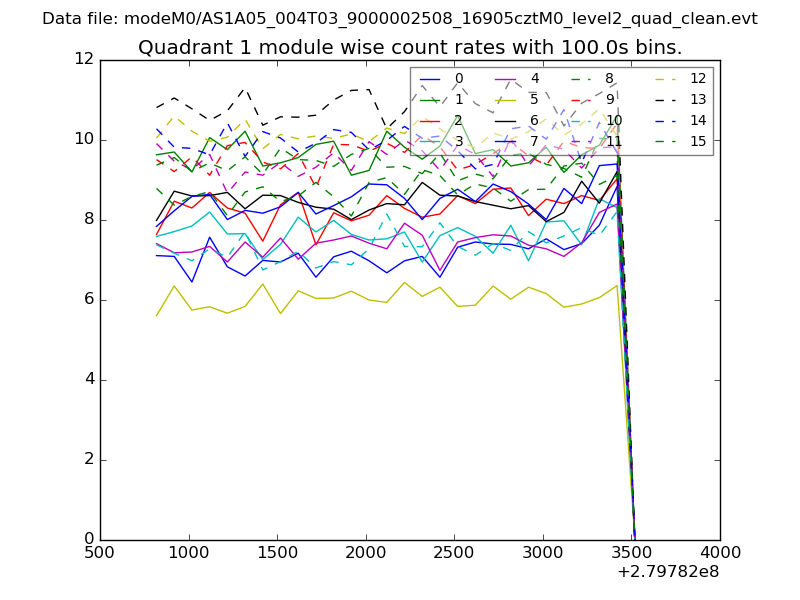
| Module-wise count rates for Quadrant A Data is divided into 100 sec bins |
 |
 |
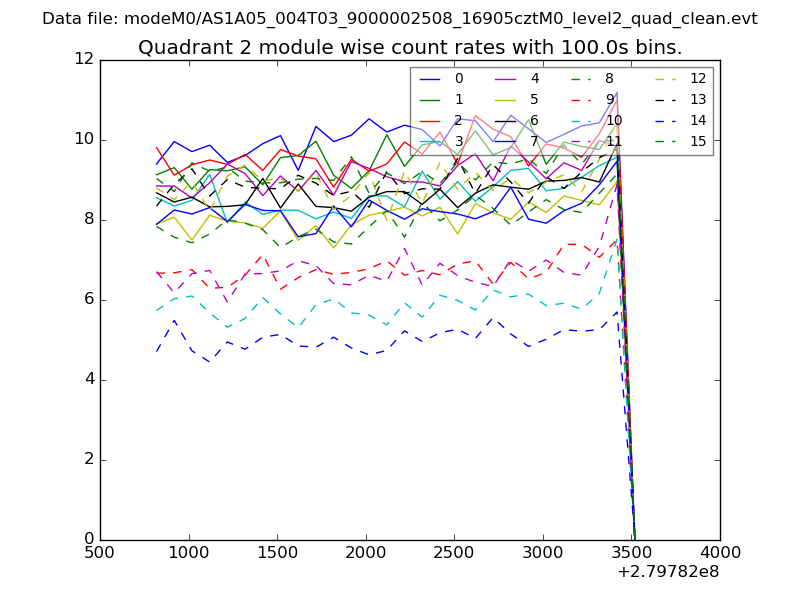
| Module-wise count rates for Quadrant B Data is divided into 100 sec bins |
 |
 |
| Module-wise count rates for Quadrant C Data is divided into 100 sec bins |
 |
 |
| Module-wise count rates for Quadrant D Data is divided into 100 sec bins |
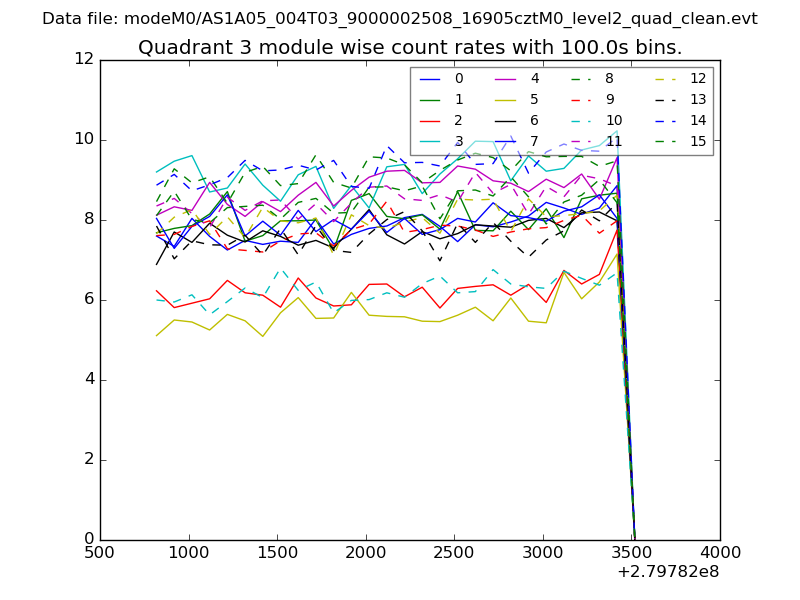 |
 |
| Parameter | Plot |
|---|---|
| CZT HV Monitor | 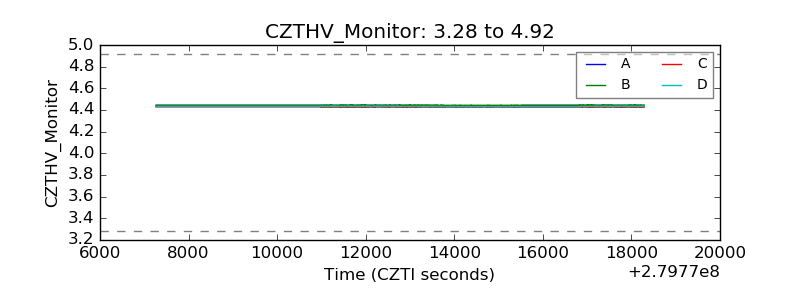 |
| D_VDD | 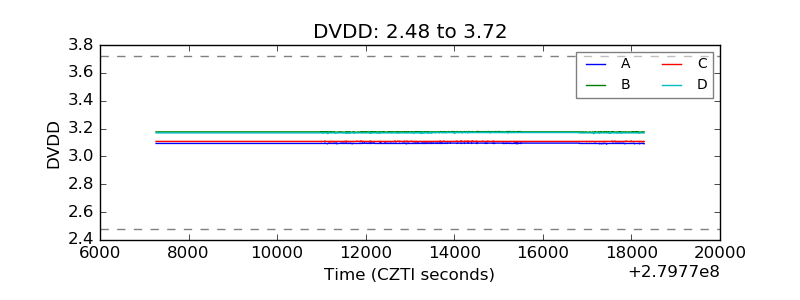 |
| Temperature 1 | 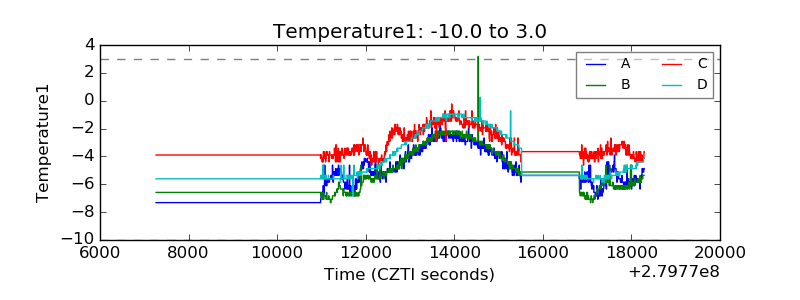 |
| Veto HV Monitor | 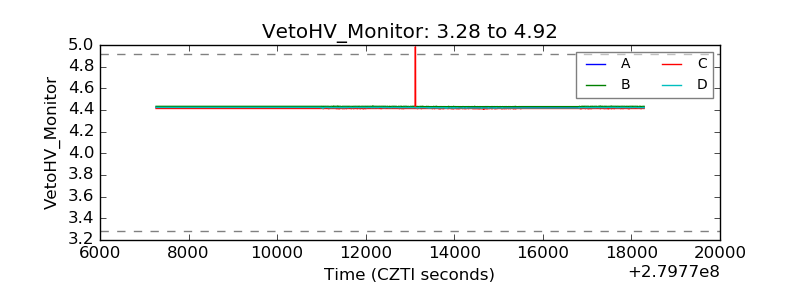 |
| Veto LLD | 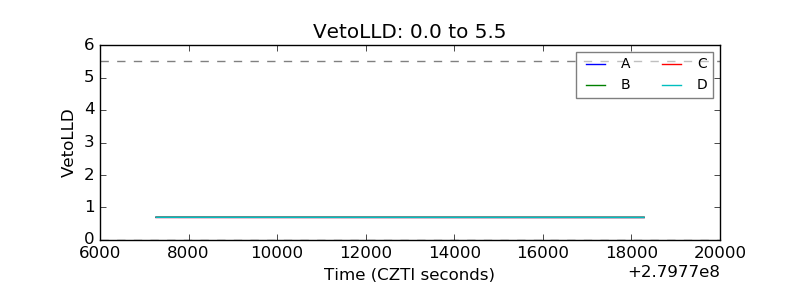 |
| Alpha Counter | 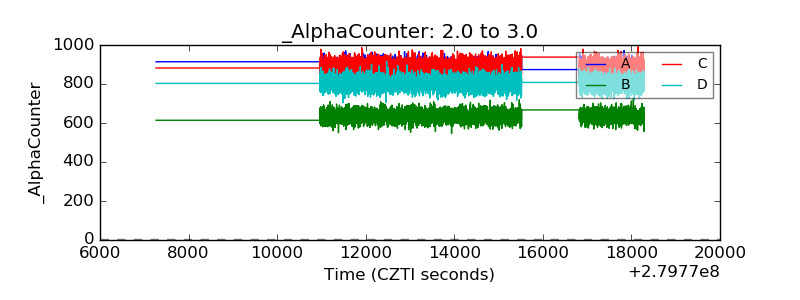 |
| _CPM_Rate | 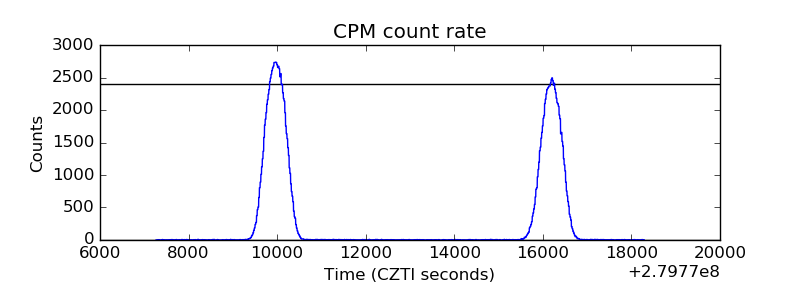 |
| CZT Counter | 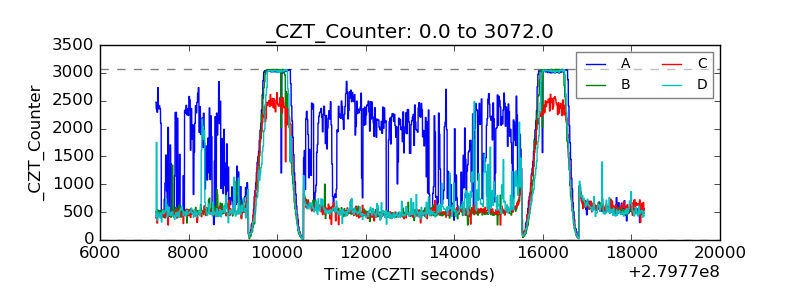 |
| +2.5 Volts monitor |  |
| +5 Volts monitor |  |
| _ROLL_ROT | 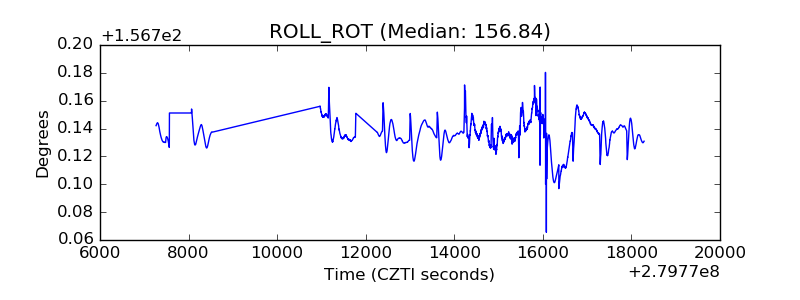 |
| _Roll_DEC | 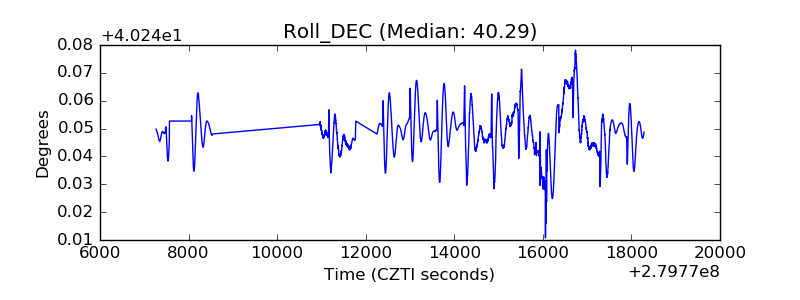 |
| _Roll_RA | 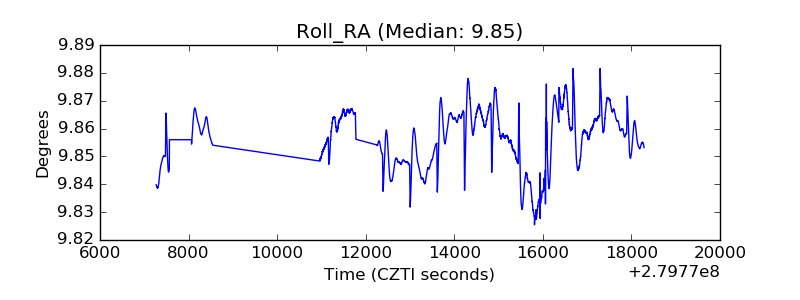 |
| Veto Counter | 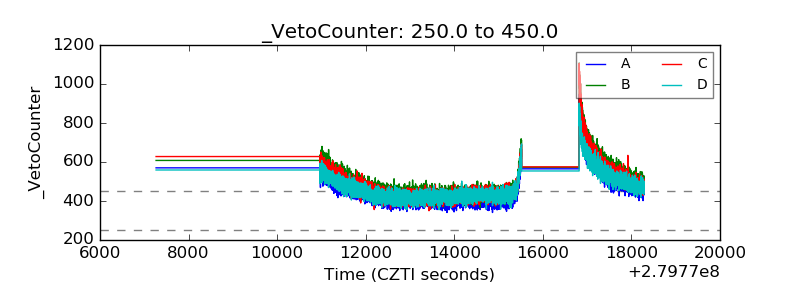 |