| Param | Original file | Final file |
|---|---|---|
| Filename | modeM0/AS1A05_004T03_9000002508_16906cztM0_level2.evt | modeM0/AS1A05_004T03_9000002508_16906cztM0_level2_quad_clean.evt |
| Size (bytes) | 518,448,960 | 70,214,400 |
| Size | 494.4 MB | 67.0 MB |
| Events in quadrant A | 4,218,626 | 428,460 |
| Events in quadrant B | 3,447,443 | 440,204 |
| Events in quadrant C | 3,709,776 | 412,235 |
| Events in quadrant D | 3,897,177 | 403,998 |
| Mode M0 | |||
|---|---|---|---|
| Quadrant | BADHDUFLAG | Total packets | Discarded packets |
| A | 0 | 16408 | 2 |
| B | 0 | 13968 | 2 |
| C | 0 | 15063 | 2 |
| D | 0 | 15571 | 2 |
| Mode SS | |||
|---|---|---|---|
| Quadrant | BADHDUFLAG | Total packets | Discarded packets |
| A | 0 | 128 | 0 |
| B | 0 | 128 | 0 |
| C | 0 | 128 | 0 |
| D | 0 | 128 | 0 |
| Mode M9 | |||
|---|---|---|---|
| Quadrant | BADHDUFLAG | Total packets | Discarded packets |
| A | 0 | 16 | 0 |
| B | 0 | 17 | 0 |
| C | 0 | 17 | 0 |
| D | 0 | 17 | 0 |
| Quadrant | Total seconds | Saturated seconds | Saturation percentage |
|---|---|---|---|
| A | 6319 | 239 | 3.782244% |
| B | 6319 | 107 | 1.693306% |
| C | 6319 | 126 | 1.993986% |
| D | 6319 | 75 | 1.186897% |
Noise dominated data is calculated using 1-second bins in cleaned event files. If a bin has >2000 counts, and if more than 50% of those come from <1% of pixels, then it is considered to be noise-dominated and hence unusable.
| Quadrant | # 1 sec bins | Bins with >0 counts | Bins with >2000 counts | High rate bins dominated by noise | Noise dominated (total time) | Noise dominated (detector-on time) | Marked lightcurve |
|---|---|---|---|---|---|---|---|
| A | 7615 | 6321 | 109 | 109 | 1.43% | 1.72% | 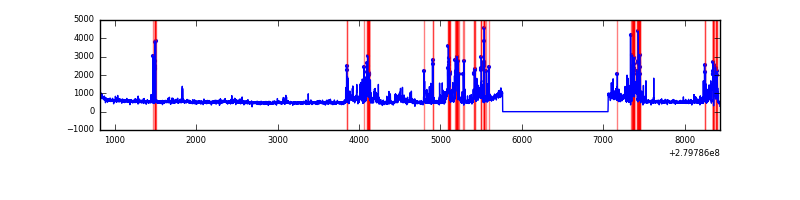 |
| B | 7615 | 6321 | 1 | 1 | 0.01% | 0.02% |  |
| C | 7615 | 6321 | 9 | 9 | 0.12% | 0.14% | 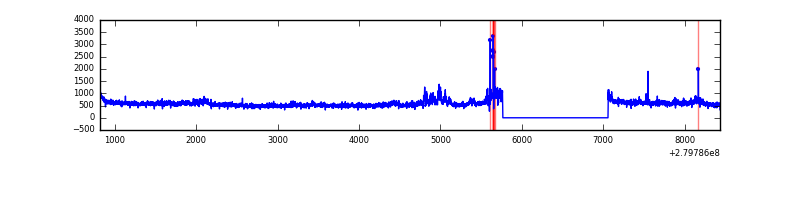 |
| D | 7615 | 6321 | 20 | 20 | 0.26% | 0.32% | 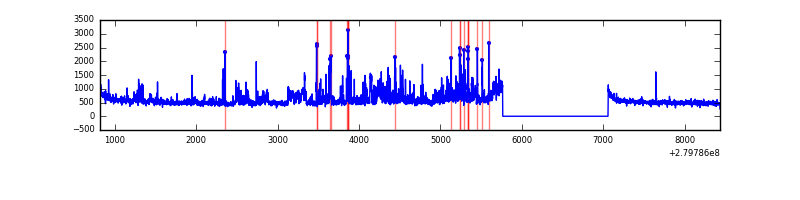 |
Top three noisy pixels from each quadrant. If the there are fewer than three noisy pixels in the level2.evt file, extra rows are filled as -1
| Pixel properties | Quadrant properties | ||||||
|---|---|---|---|---|---|---|---|
| Quadrant | DetID | PixID | Counts | Sigma | Mean | Median | Sigma |
| A | 15 | 174 | 919206 | 5419.99 | 849 | 833 | 169.4 |
| A | 9 | 143 | 21854 | 124.06 | 849 | 833 | 169.4 |
| A | 12 | 189 | 15215 | 84.88 | 849 | 833 | 169.4 |
| B | 15 | 35 | 69608 | 430.85 | 854 | 835 | 159.6 |
| B | 0 | 189 | 24623 | 149.03 | 854 | 835 | 159.6 |
| B | 12 | 111 | 18391 | 109.99 | 854 | 835 | 159.6 |
| C | 3 | 233 | 408396 | 2209.82 | 802 | 811 | 184.4 |
| C | 14 | 238 | 127227 | 685.39 | 802 | 811 | 184.4 |
| C | 14 | 225 | 40611 | 215.79 | 802 | 811 | 184.4 |
| D | 12 | 235 | 660797 | 3373.58 | 814 | 791 | 195.6 |
| D | 1 | 52 | 90317 | 457.61 | 814 | 791 | 195.6 |
| D | 7 | 38 | 31293 | 155.91 | 814 | 791 | 195.6 |
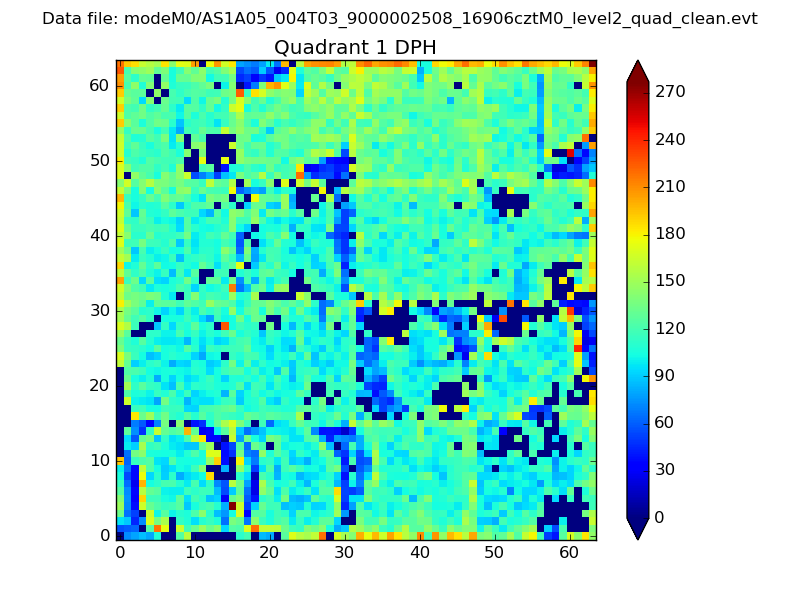
Histogram calculated using DETX and DETY for each event in the final _common_clean file
| Quadrant A |  |
 |
Quadrant B |
|---|---|---|---|
| Quadrant D | 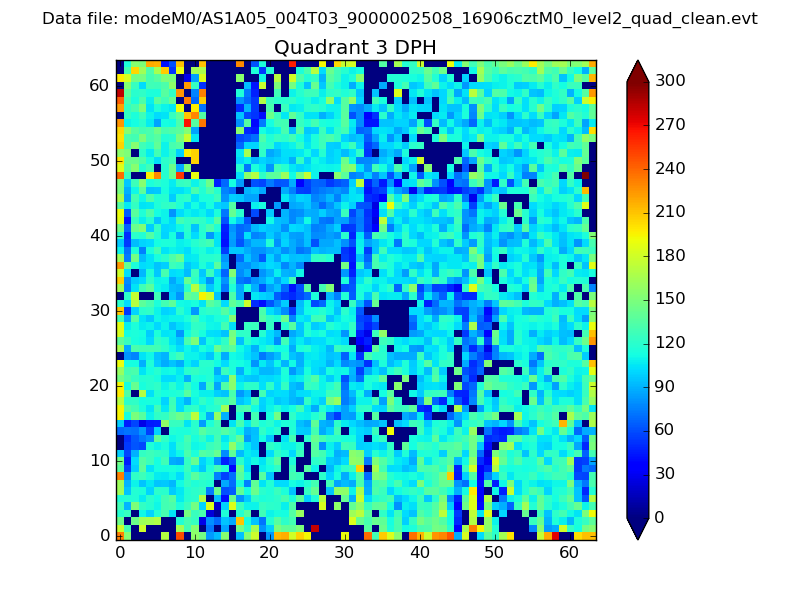 |
 |
Quadrant C |
| Plot type | Count rate plots | Images |
|---|---|---|
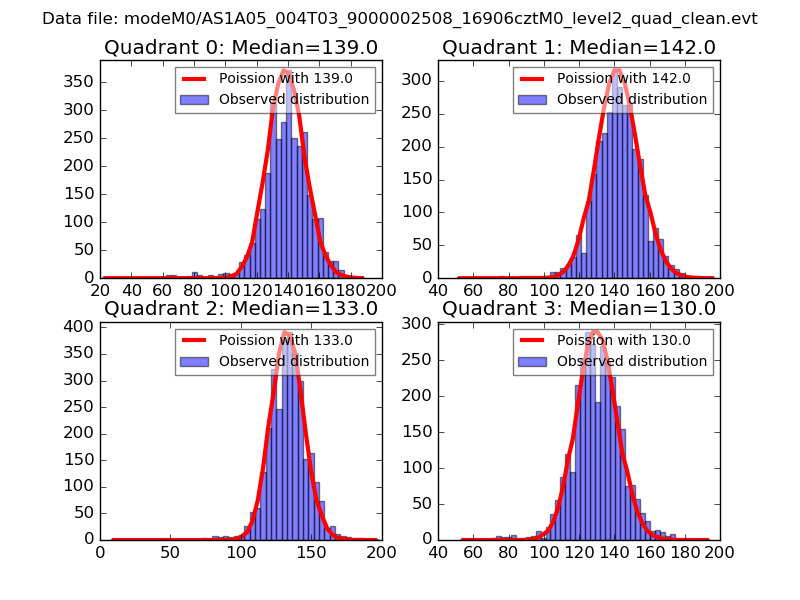
| Comparison with Poisson distribution Blue bars denote a histogram of data divided into 1 sec bins. Red curve is a Poisson curve with rate = median count rate of data. |
 |
 |
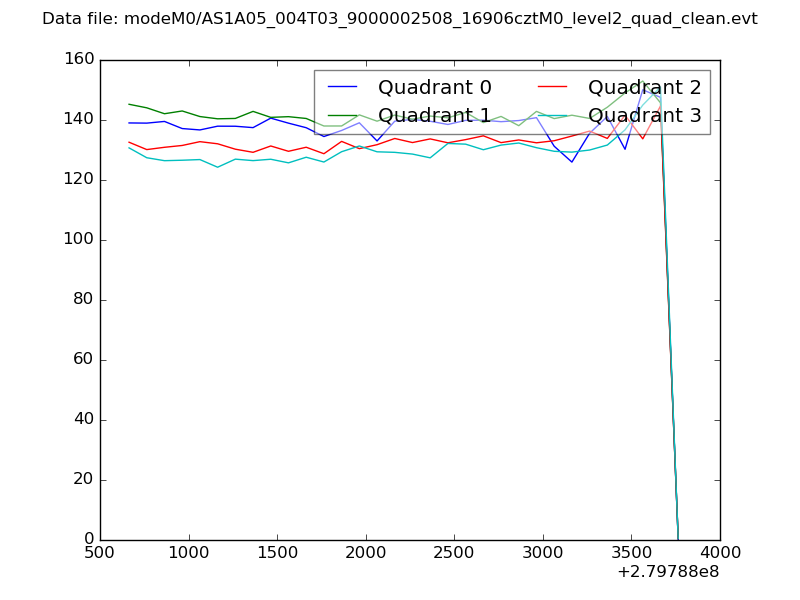
| Quadrant-wise count rates Data is divided into 100 sec bins |
 |
|
| Module-wise count rates for Quadrant A Data is divided into 100 sec bins |
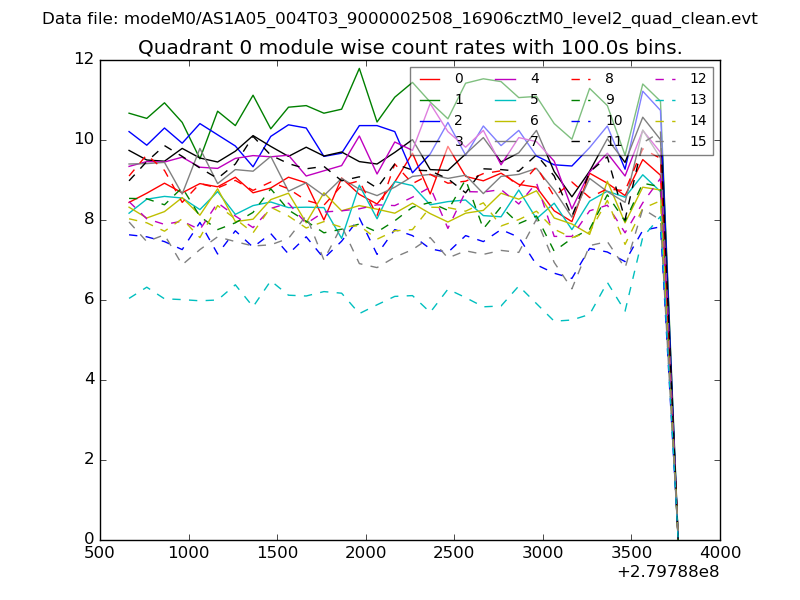 |
 |
| Module-wise count rates for Quadrant B Data is divided into 100 sec bins |
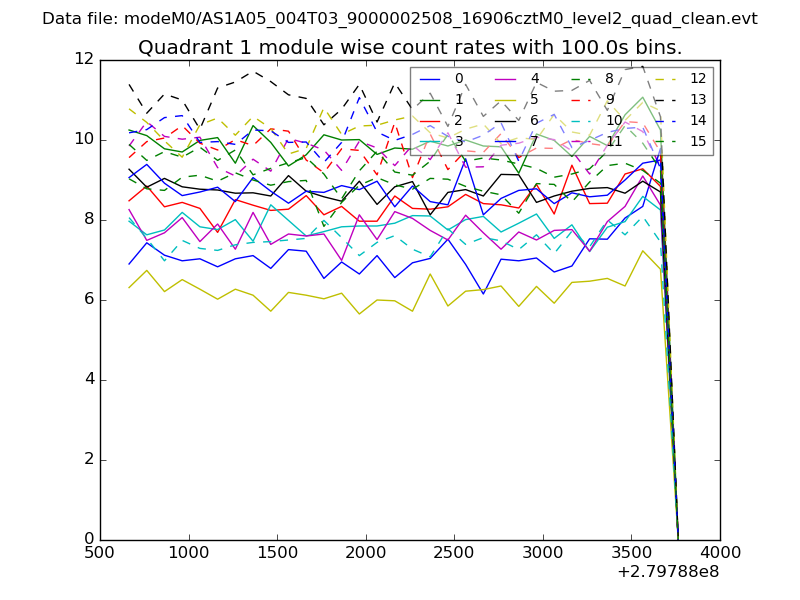 |
 |
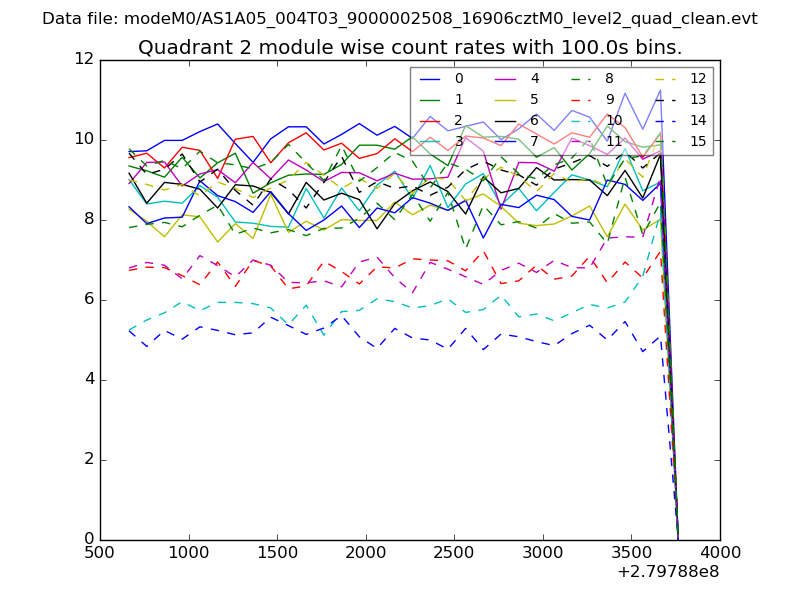
| Module-wise count rates for Quadrant C Data is divided into 100 sec bins |
 |
 |
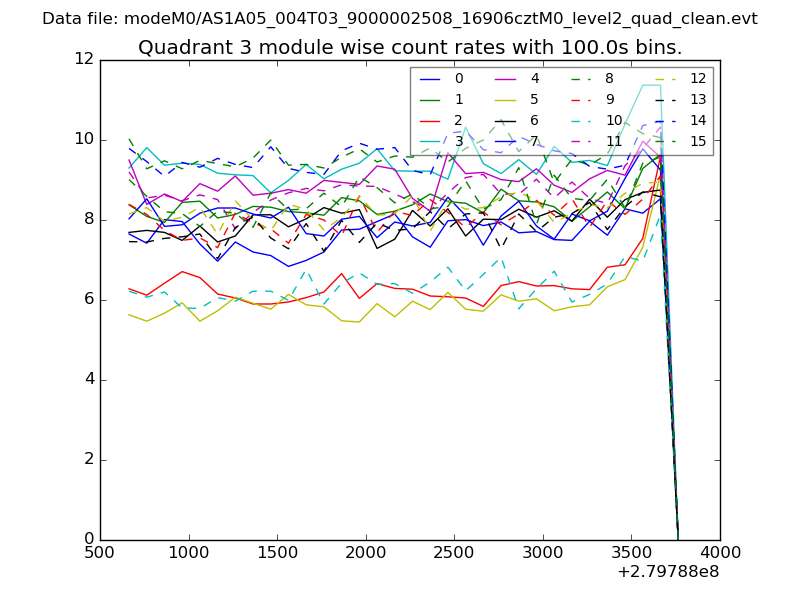
| Module-wise count rates for Quadrant D Data is divided into 100 sec bins |
 |
 |
| Parameter | Plot |
|---|---|
| CZT HV Monitor | 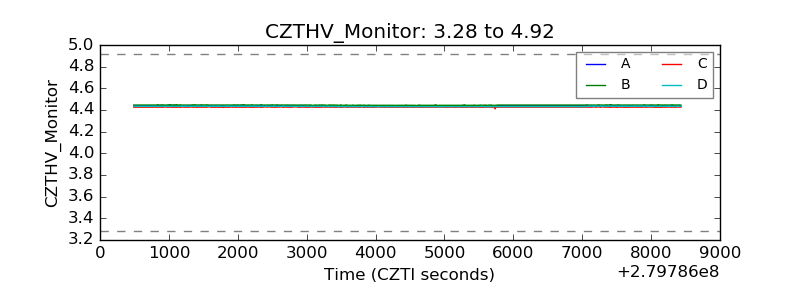 |
| D_VDD | 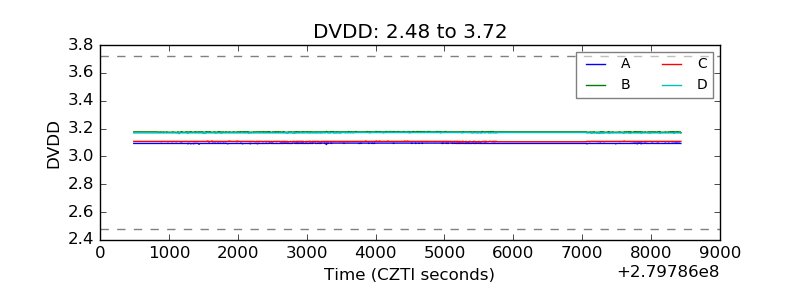 |
| Temperature 1 | 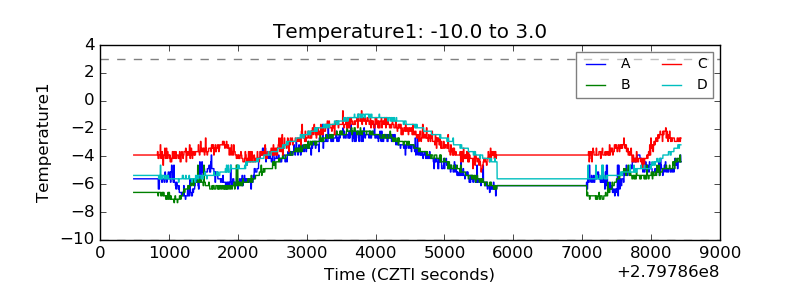 |
| Veto HV Monitor | 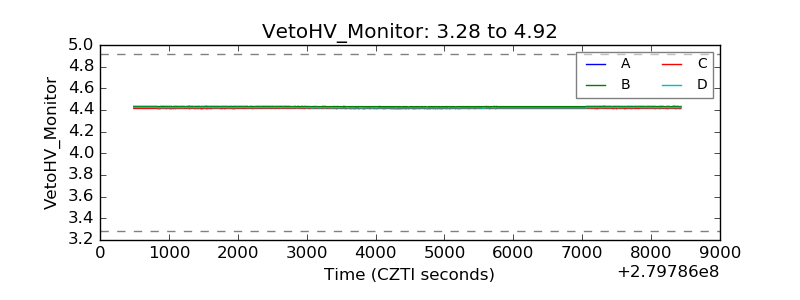 |
| Veto LLD | 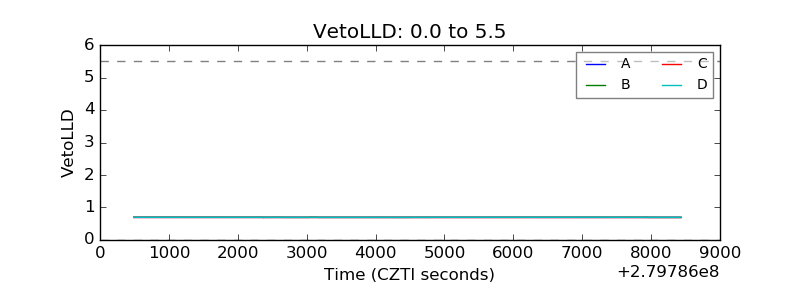 |
| Alpha Counter | 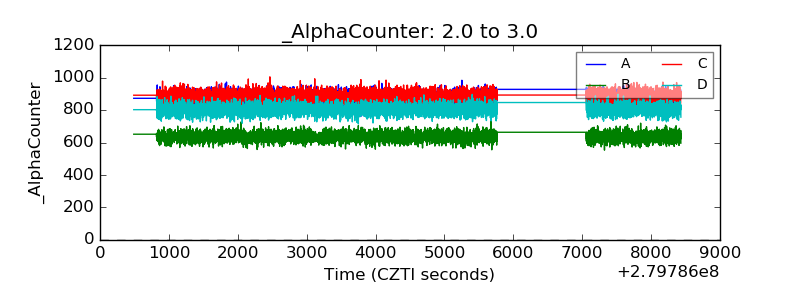 |
| _CPM_Rate | 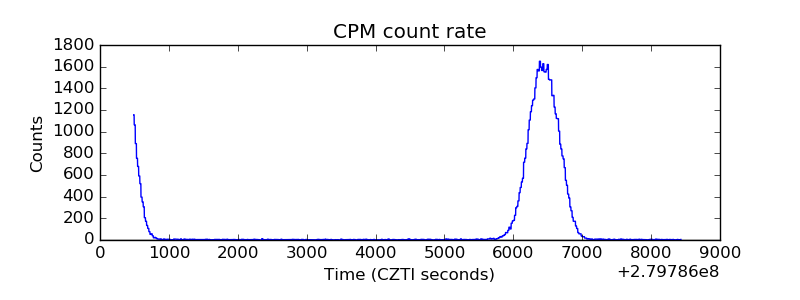 |
| CZT Counter |  |
| +2.5 Volts monitor |  |
| +5 Volts monitor |  |
| _ROLL_ROT | 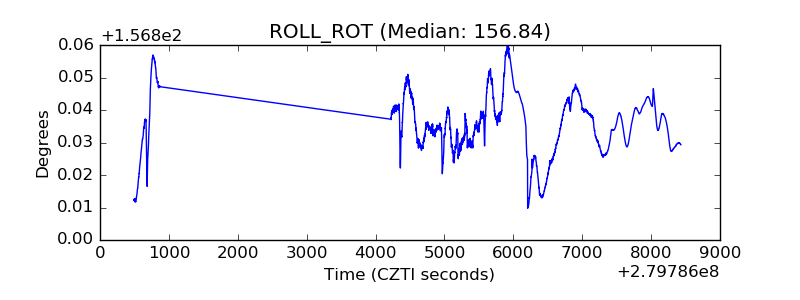 |
| _Roll_DEC | 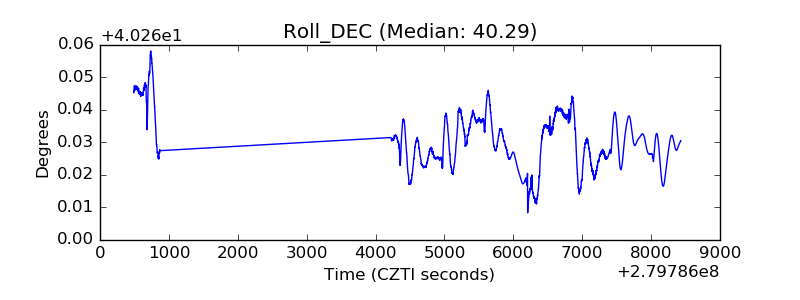 |
| _Roll_RA | 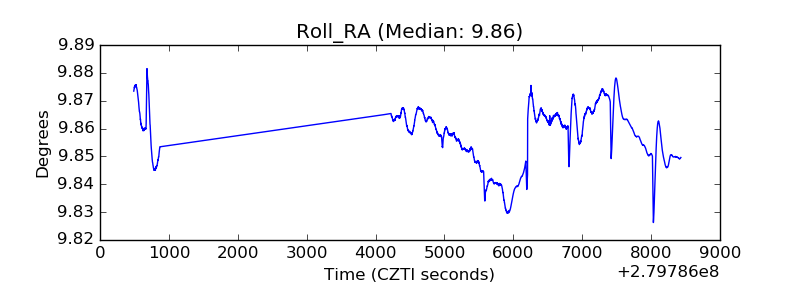 |
| Veto Counter | 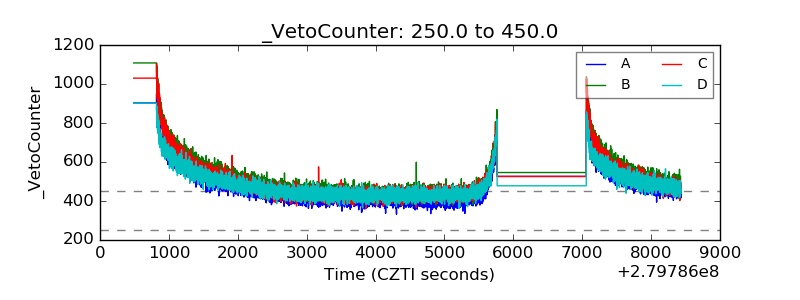 |