| Param | Original file | Final file |
|---|---|---|
| Filename | modeM0/AS1A05_004T03_9000002508_16907cztM0_level2.evt | modeM0/AS1A05_004T03_9000002508_16907cztM0_level2_quad_clean.evt |
| Size (bytes) | 538,715,520 | 83,920,320 |
| Size | 513.8 MB | 80.0 MB |
| Events in quadrant A | 5,311,188 | 511,402 |
| Events in quadrant B | 3,508,143 | 549,408 |
| Events in quadrant C | 3,678,212 | 518,291 |
| Events in quadrant D | 3,380,429 | 512,414 |
| Mode M0 | |||
|---|---|---|---|
| Quadrant | BADHDUFLAG | Total packets | Discarded packets |
| A | 0 | 19818 | 2 |
| B | 0 | 14241 | 2 |
| C | 0 | 14961 | 2 |
| D | 0 | 14032 | 2 |
| Mode SS | |||
|---|---|---|---|
| Quadrant | BADHDUFLAG | Total packets | Discarded packets |
| A | 0 | 132 | 0 |
| B | 0 | 132 | 0 |
| C | 0 | 132 | 0 |
| D | 0 | 132 | 0 |
| Mode M9 | |||
|---|---|---|---|
| Quadrant | BADHDUFLAG | Total packets | Discarded packets |
| A | 0 | 14 | 0 |
| B | 0 | 15 | 0 |
| C | 0 | 15 | 0 |
| D | 0 | 15 | 0 |
| Quadrant | Total seconds | Saturated seconds | Saturation percentage |
|---|---|---|---|
| A | 6440 | 631 | 9.798137% |
| B | 6440 | 145 | 2.251553% |
| C | 6440 | 133 | 2.065217% |
| D | 6440 | 108 | 1.677019% |
Noise dominated data is calculated using 1-second bins in cleaned event files. If a bin has >2000 counts, and if more than 50% of those come from <1% of pixels, then it is considered to be noise-dominated and hence unusable.
| Quadrant | # 1 sec bins | Bins with >0 counts | Bins with >2000 counts | High rate bins dominated by noise | Noise dominated (total time) | Noise dominated (detector-on time) | Marked lightcurve |
|---|---|---|---|---|---|---|---|
| A | 7642 | 6442 | 420 | 420 | 5.50% | 6.52% | 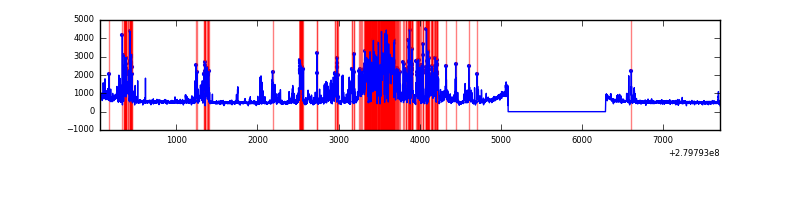 |
| B | 7642 | 6442 | 5 | 5 | 0.07% | 0.08% | 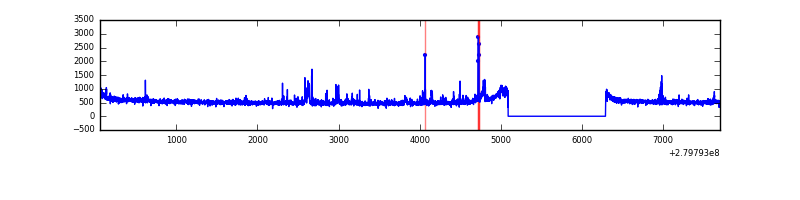 |
| C | 7642 | 6442 | 1 | 1 | 0.01% | 0.02% | 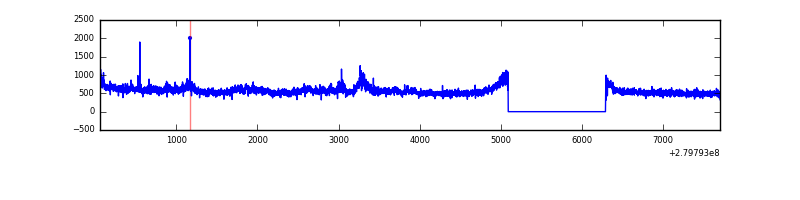 |
| D | 7642 | 6442 | 21 | 21 | 0.27% | 0.33% | 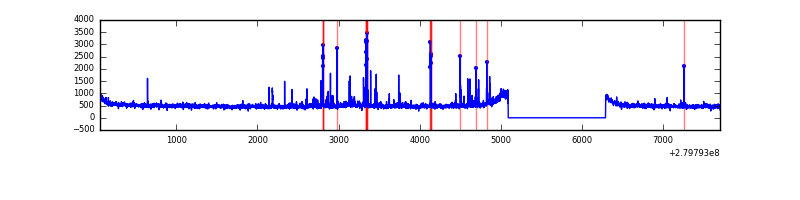 |
Top three noisy pixels from each quadrant. If the there are fewer than three noisy pixels in the level2.evt file, extra rows are filled as -1
| Pixel properties | Quadrant properties | ||||||
|---|---|---|---|---|---|---|---|
| Quadrant | DetID | PixID | Counts | Sigma | Mean | Median | Sigma |
| A | 15 | 174 | 2083013 | 12546.59 | 831 | 816 | 166.0 |
| A | 9 | 143 | 21050 | 121.92 | 831 | 816 | 166.0 |
| A | 11 | 29 | 11424 | 63.92 | 831 | 816 | 166.0 |
| B | 15 | 35 | 93070 | 573.58 | 852 | 833 | 160.8 |
| B | 12 | 111 | 18265 | 108.4 | 852 | 833 | 160.8 |
| B | 0 | 219 | 16353 | 96.51 | 852 | 833 | 160.8 |
| C | 3 | 233 | 411295 | 2225.74 | 802 | 809 | 184.4 |
| C | 14 | 238 | 127471 | 686.79 | 802 | 809 | 184.4 |
| C | 5 | 112 | 7638 | 37.03 | 802 | 809 | 184.4 |
| D | 1 | 52 | 144388 | 720.46 | 820 | 795 | 199.3 |
| D | 12 | 235 | 112516 | 560.54 | 820 | 795 | 199.3 |
| D | 2 | 234 | 23784 | 115.34 | 820 | 795 | 199.3 |
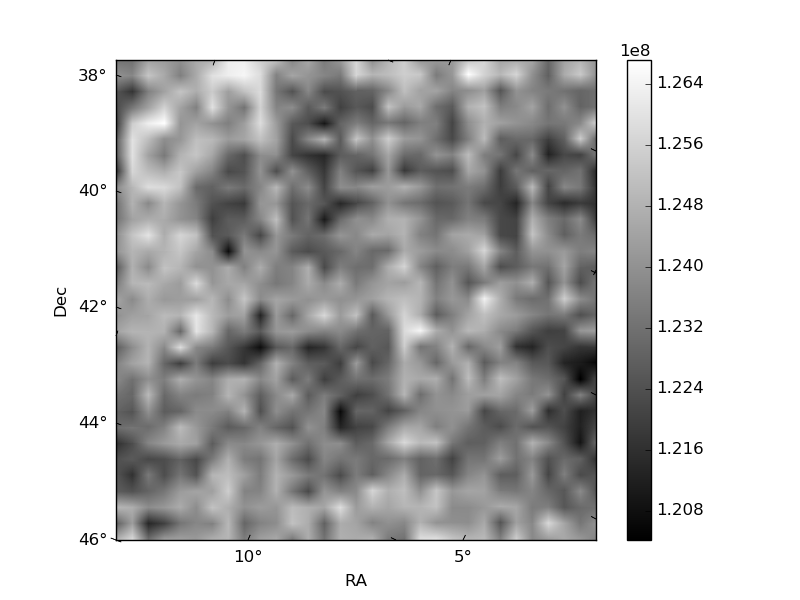
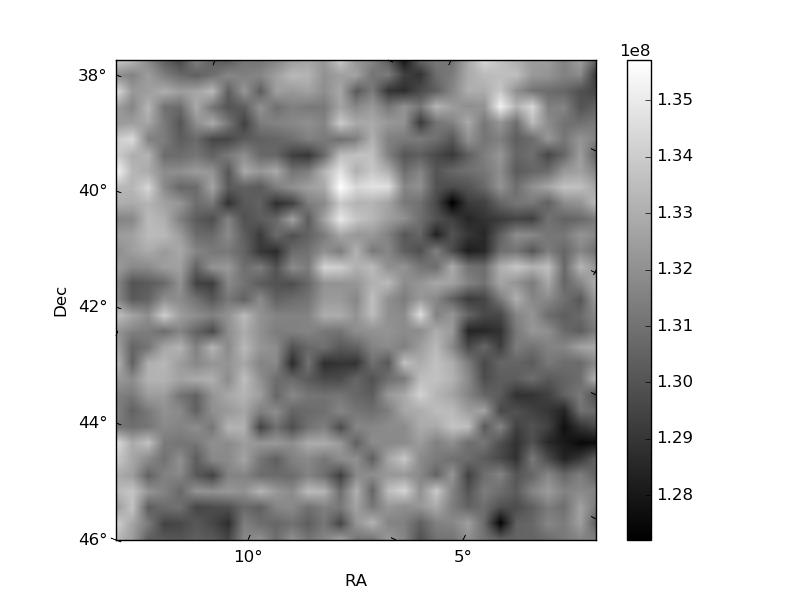
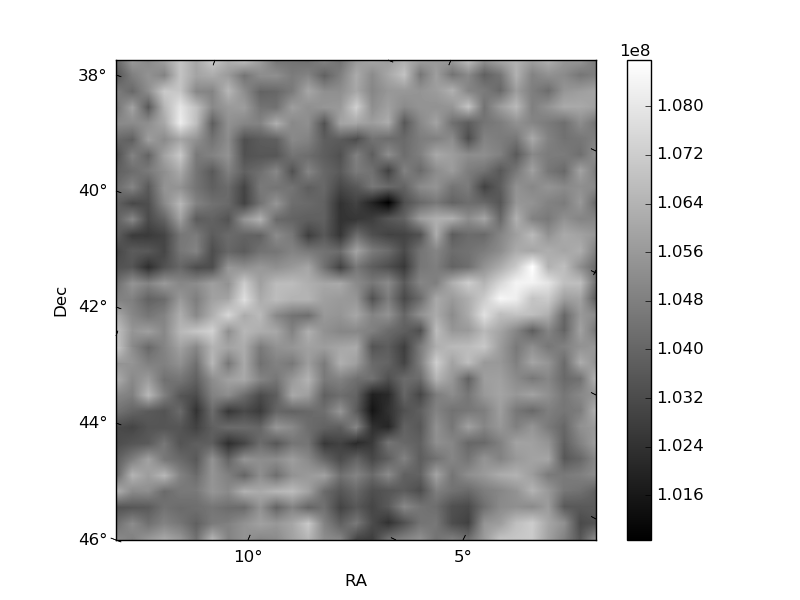
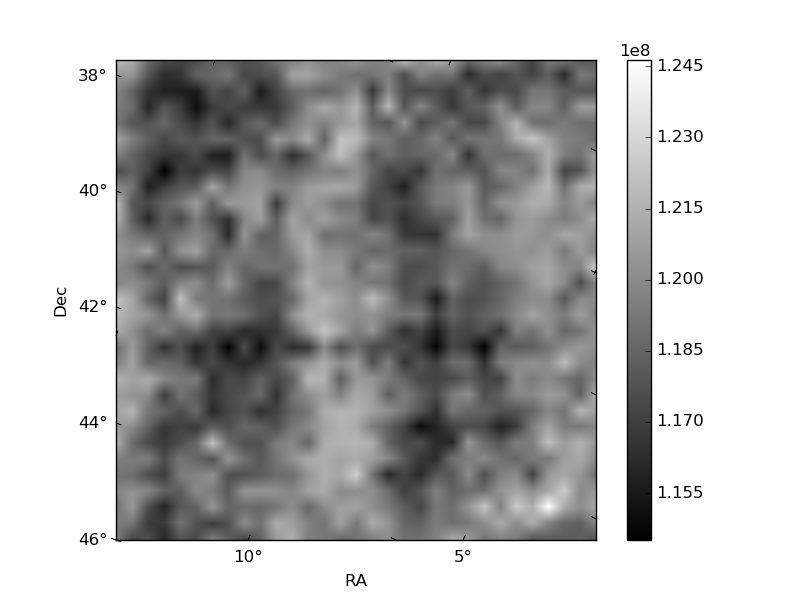
Histogram calculated using DETX and DETY for each event in the final _common_clean file
| Quadrant A | 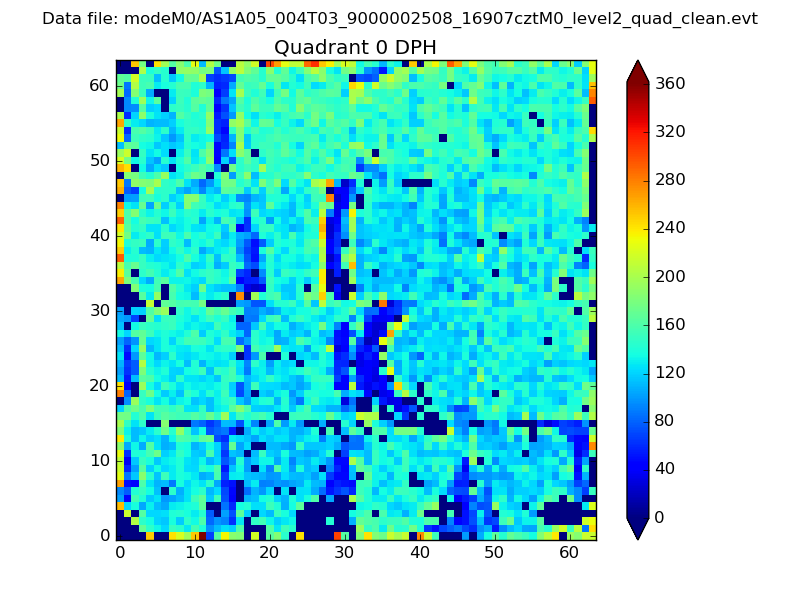 |
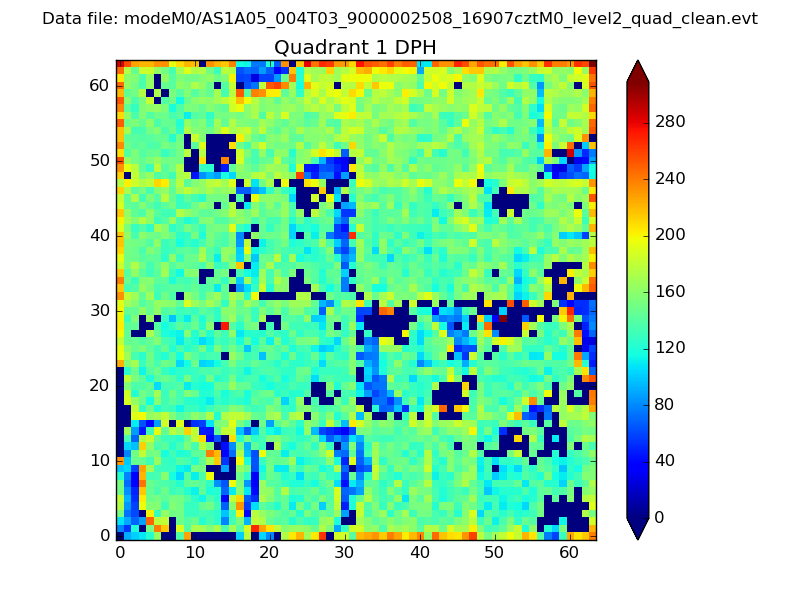 |
Quadrant B |
|---|---|---|---|
| Quadrant D | 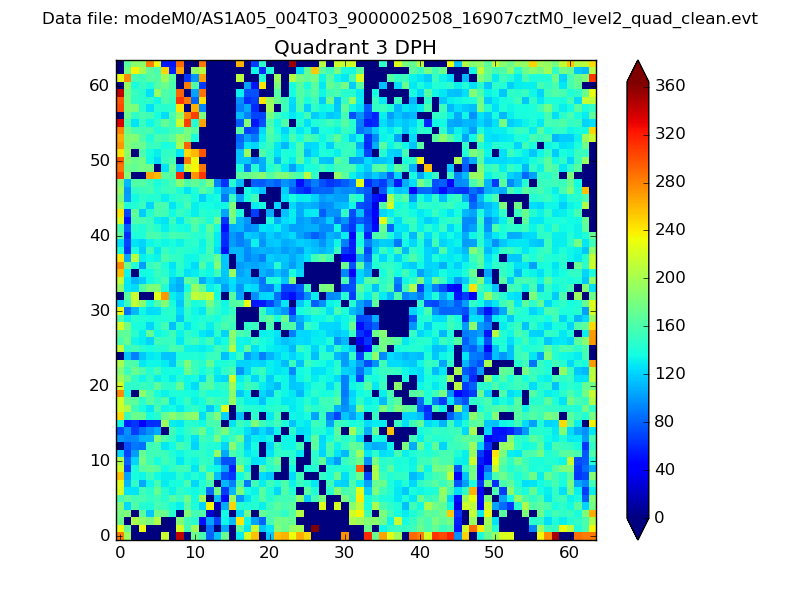 |
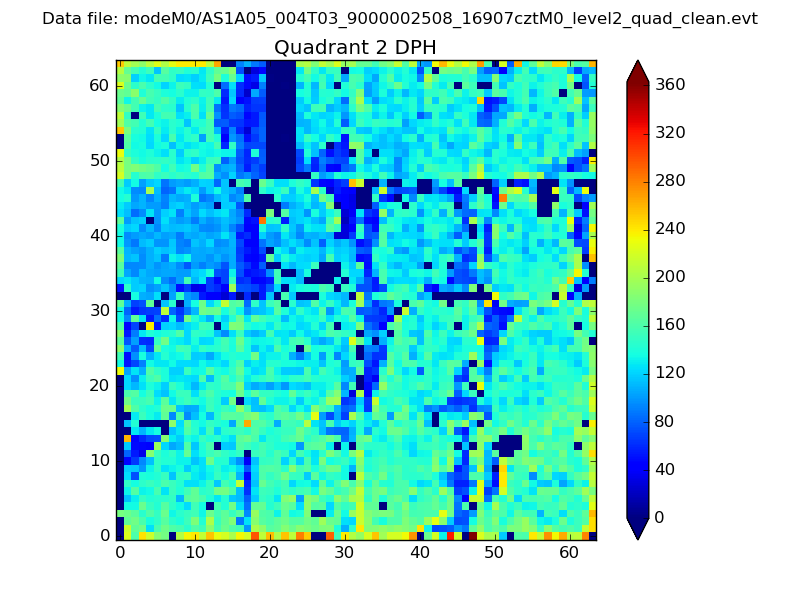 |
Quadrant C |
| Plot type | Count rate plots | Images |
|---|---|---|
| Comparison with Poisson distribution Blue bars denote a histogram of data divided into 1 sec bins. Red curve is a Poisson curve with rate = median count rate of data. |
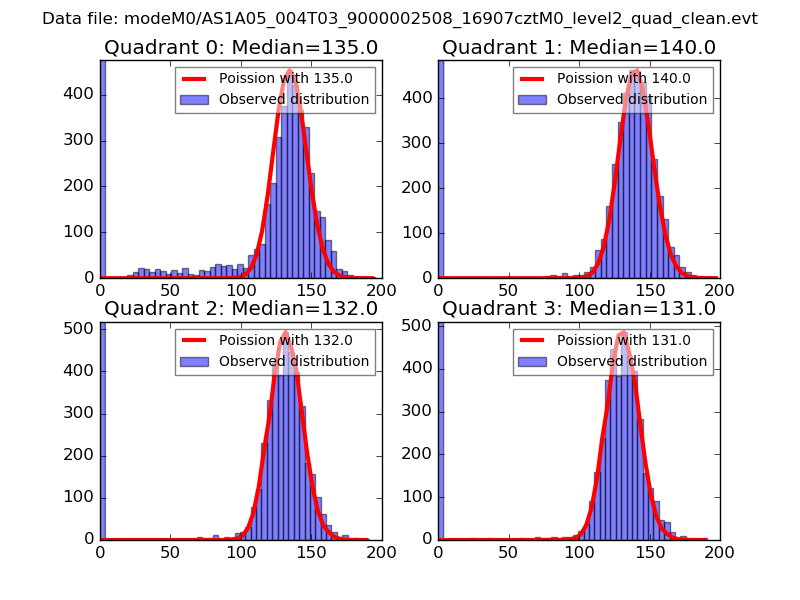 |
 |
| Quadrant-wise count rates Data is divided into 100 sec bins |
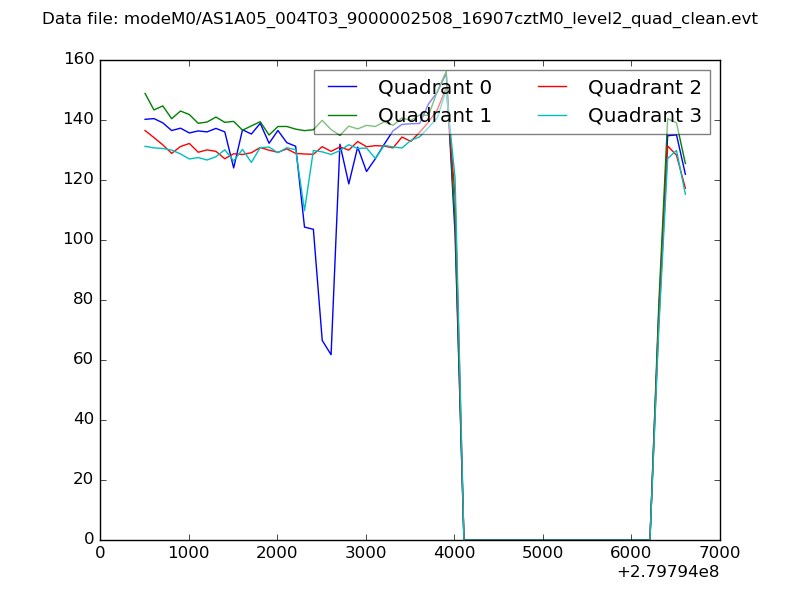 |
|
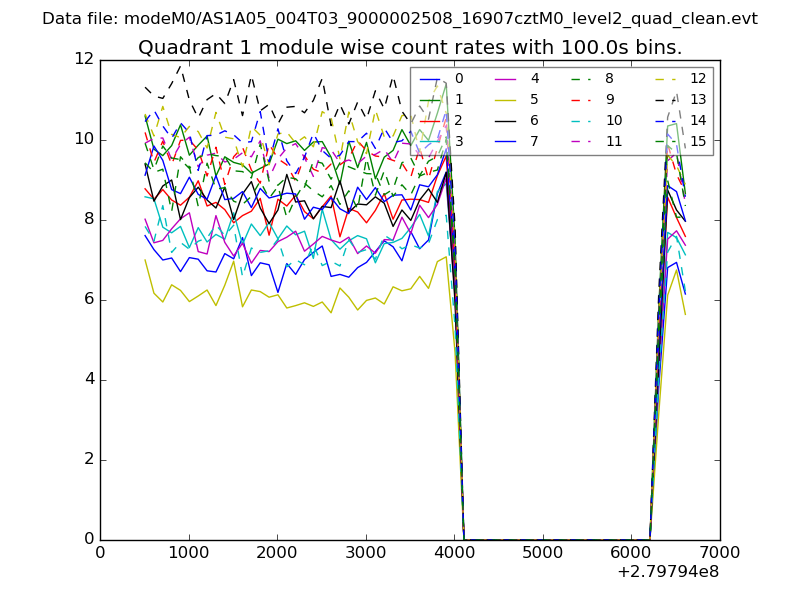
| Module-wise count rates for Quadrant A Data is divided into 100 sec bins |
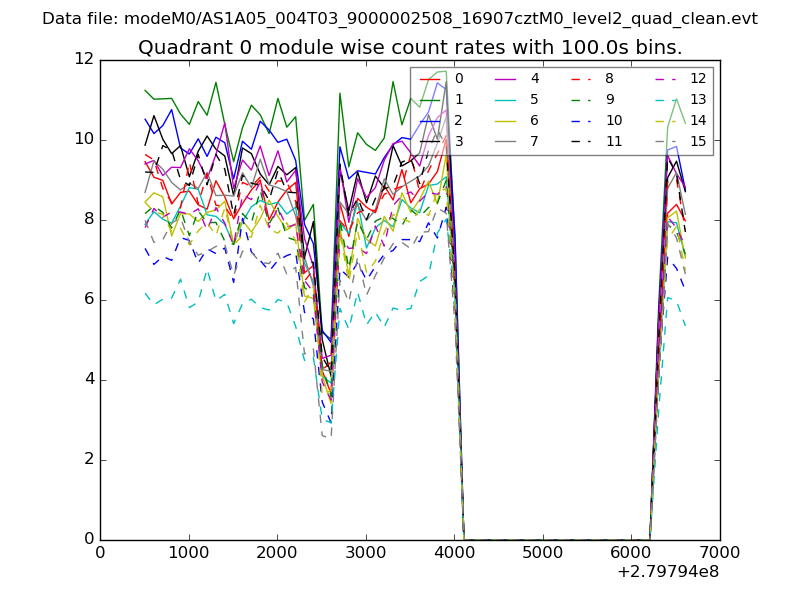 |
 |
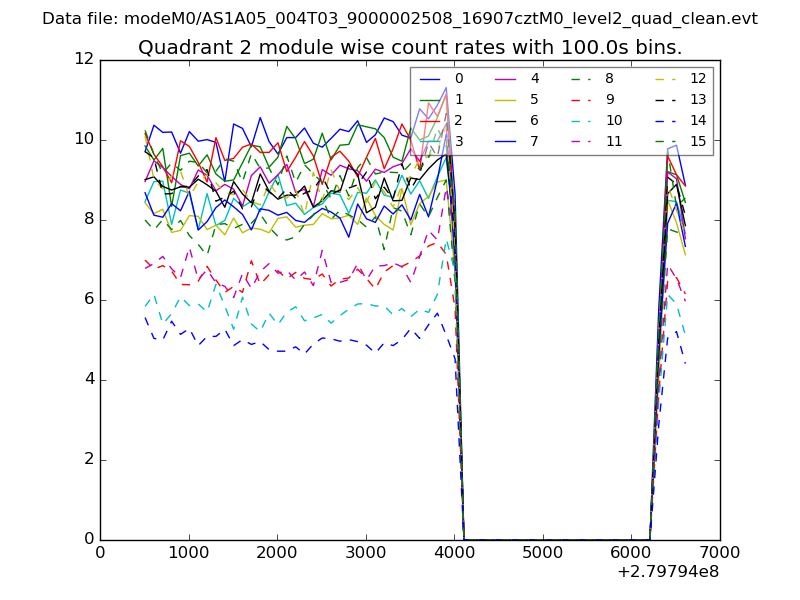
| Module-wise count rates for Quadrant B Data is divided into 100 sec bins |
 |
 |
| Module-wise count rates for Quadrant C Data is divided into 100 sec bins |
 |
 |
| Module-wise count rates for Quadrant D Data is divided into 100 sec bins |
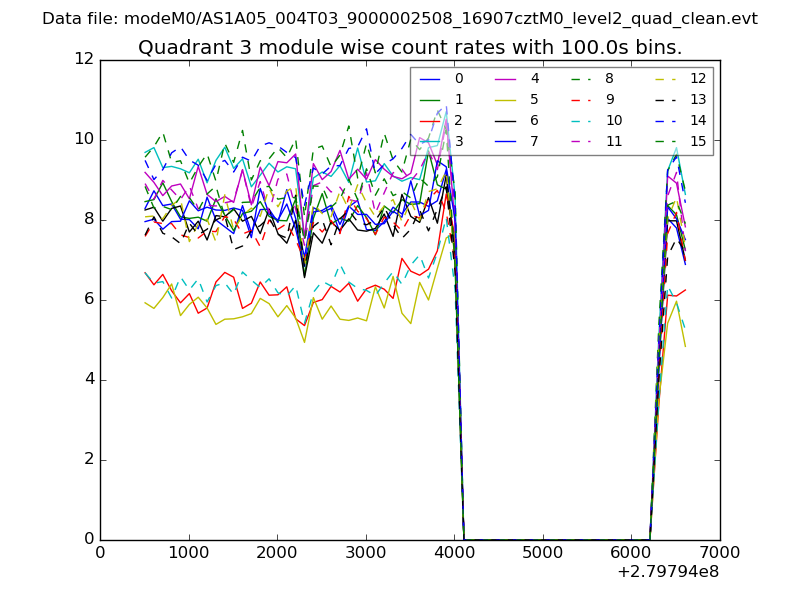 |
 |
| Parameter | Plot |
|---|---|
| CZT HV Monitor | 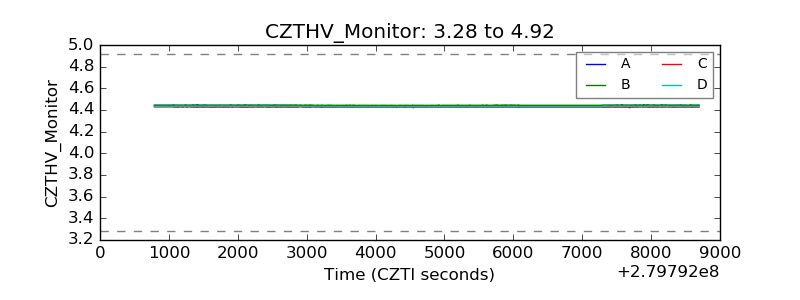 |
| D_VDD | 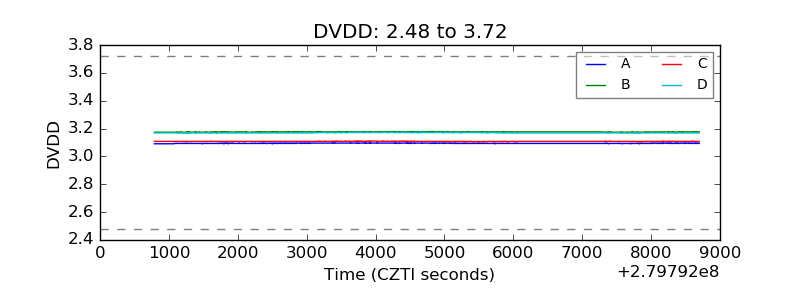 |
| Temperature 1 | 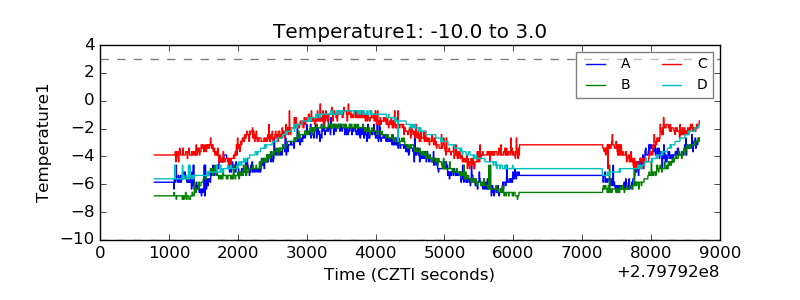 |
| Veto HV Monitor | 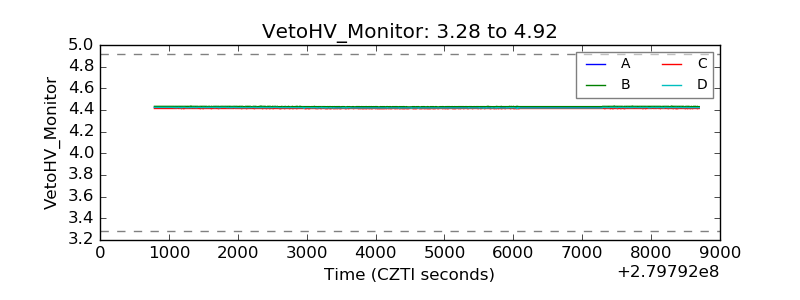 |
| Veto LLD | 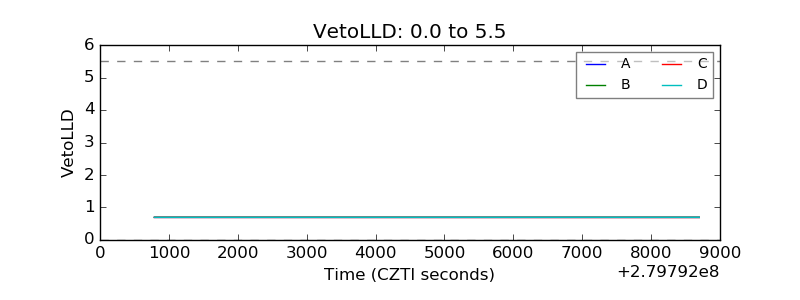 |
| Alpha Counter | 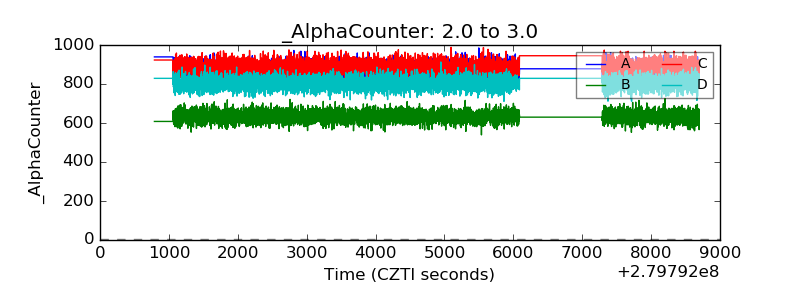 |
| _CPM_Rate | 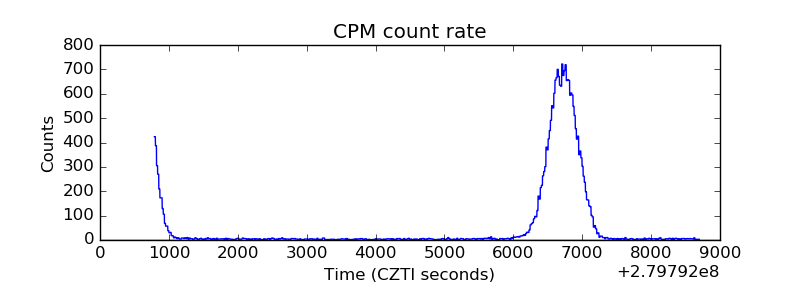 |
| CZT Counter | 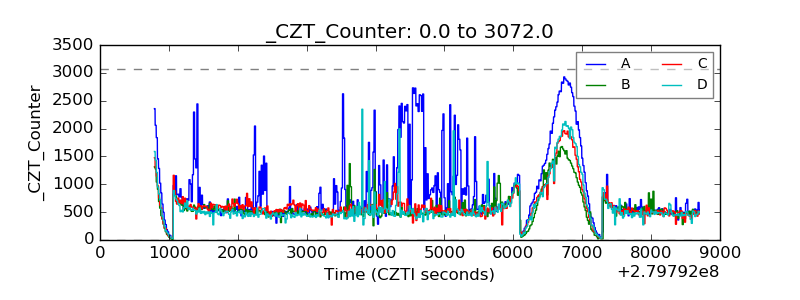 |
| +2.5 Volts monitor |  |
| +5 Volts monitor | 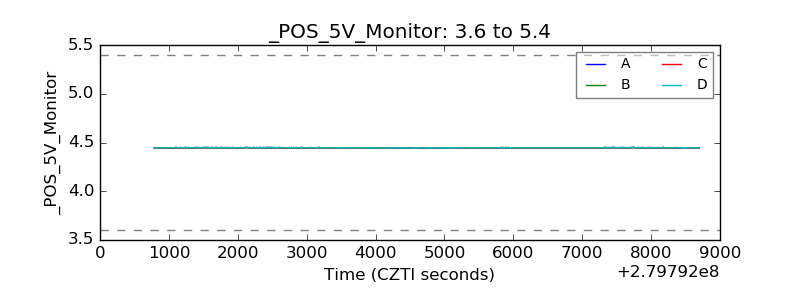 |
| _ROLL_ROT | 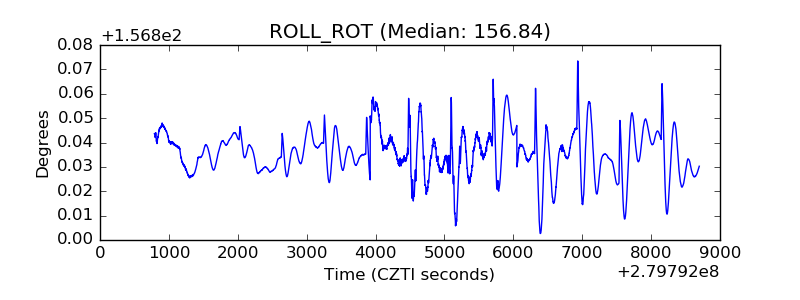 |
| _Roll_DEC | 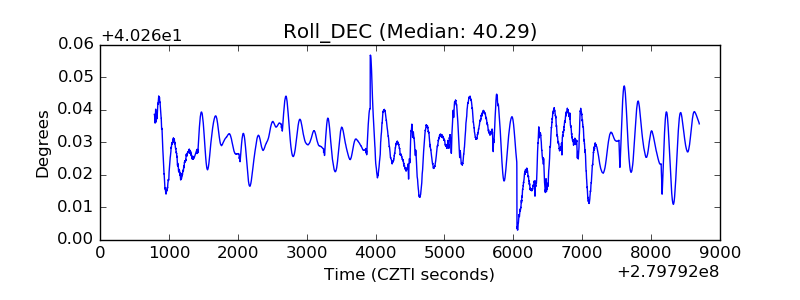 |
| _Roll_RA |  |
| Veto Counter | 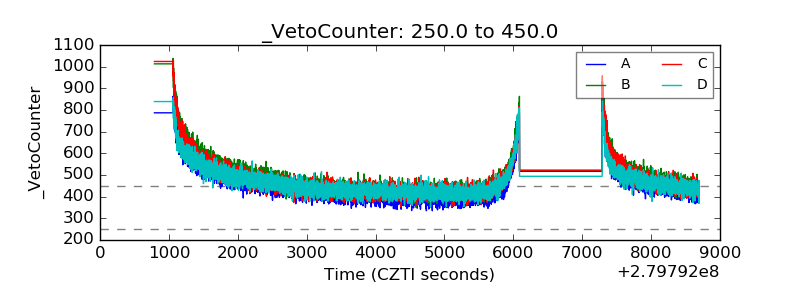 |