| Param | Original file | Final file |
|---|---|---|
| Filename | modeM0/AS1A05_004T03_9000002508_16908cztM0_level2.evt | modeM0/AS1A05_004T03_9000002508_16908cztM0_level2_quad_clean.evt |
| Size (bytes) | 376,001,280 | 17,622,720 |
| Size | 358.6 MB | 16.8 MB |
| Events in quadrant A | 3,887,845 | 53,296 |
| Events in quadrant B | 2,469,998 | 53,367 |
| Events in quadrant C | 2,283,606 | 52,824 |
| Events in quadrant D | 2,435,953 | 53,181 |
| Mode M0 | |||
|---|---|---|---|
| Quadrant | BADHDUFLAG | Total packets | Discarded packets |
| A | 0 | 14446 | 1 |
| B | 0 | 10134 | 1 |
| C | 0 | 9565 | 1 |
| D | 0 | 10234 | 1 |
| Mode SS | |||
|---|---|---|---|
| Quadrant | BADHDUFLAG | Total packets | Discarded packets |
| A | 0 | 92 | 0 |
| B | 0 | 92 | 0 |
| C | 0 | 92 | 0 |
| D | 0 | 92 | 0 |
| Mode M9 | |||
|---|---|---|---|
| Quadrant | BADHDUFLAG | Total packets | Discarded packets |
| A | 0 | 12 | 0 |
| B | 0 | 12 | 0 |
| C | 0 | 12 | 0 |
| D | 0 | 12 | 0 |
| Quadrant | Total seconds | Saturated seconds | Saturation percentage |
|---|---|---|---|
| A | 4552 | 591 | 12.983304% |
| B | 4552 | 130 | 2.855888% |
| C | 4552 | 102 | 2.240773% |
| D | 4553 | 116 | 2.547771% |
Noise dominated data is calculated using 1-second bins in cleaned event files. If a bin has >2000 counts, and if more than 50% of those come from <1% of pixels, then it is considered to be noise-dominated and hence unusable.
| Quadrant | # 1 sec bins | Bins with >0 counts | Bins with >2000 counts | High rate bins dominated by noise | Noise dominated (total time) | Noise dominated (detector-on time) | Marked lightcurve |
|---|---|---|---|---|---|---|---|
| A | 5754 | 4554 | 362 | 362 | 6.29% | 7.95% | 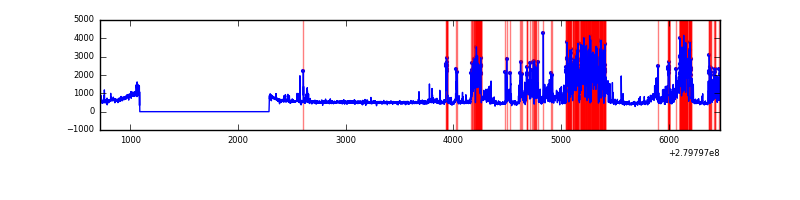 |
| B | 5754 | 4554 | 4 | 4 | 0.07% | 0.09% |  |
| C | 5754 | 4554 | 0 | 0 | 0.00% | 0.00% | 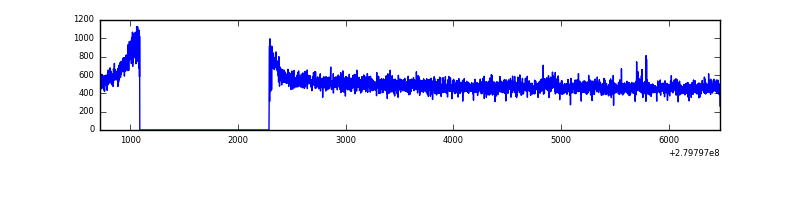 |
| D | 5755 | 4555 | 32 | 32 | 0.56% | 0.70% | 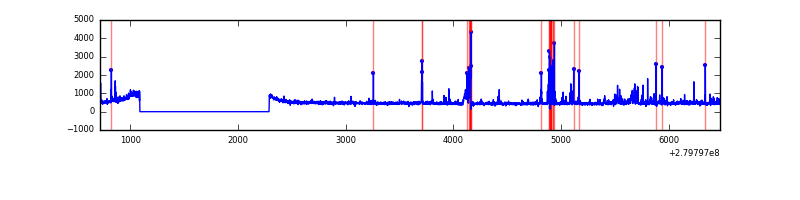 |
Top three noisy pixels from each quadrant. If the there are fewer than three noisy pixels in the level2.evt file, extra rows are filled as -1
| Pixel properties | Quadrant properties | ||||||
|---|---|---|---|---|---|---|---|
| Quadrant | DetID | PixID | Counts | Sigma | Mean | Median | Sigma |
| A | 15 | 174 | 1672309 | 14708.07 | 562 | 552 | 113.7 |
| A | 12 | 189 | 50474 | 439.21 | 562 | 552 | 113.7 |
| A | 0 | 226 | 4939 | 38.6 | 562 | 552 | 113.7 |
| B | 15 | 35 | 145880 | 1318.73 | 576 | 563 | 110.2 |
| B | 4 | 216 | 16092 | 140.92 | 576 | 563 | 110.2 |
| B | 0 | 219 | 15784 | 138.13 | 576 | 563 | 110.2 |
| C | 14 | 238 | 85748 | 669.39 | 547 | 552 | 127.3 |
| C | 3 | 233 | 54387 | 422.98 | 547 | 552 | 127.3 |
| C | 14 | 225 | 5565 | 39.39 | 547 | 552 | 127.3 |
| D | 1 | 52 | 181196 | 1315.62 | 563 | 547 | 137.3 |
| D | 2 | 33 | 54426 | 392.39 | 563 | 547 | 137.3 |
| D | 15 | 145 | 25501 | 181.73 | 563 | 547 | 137.3 |
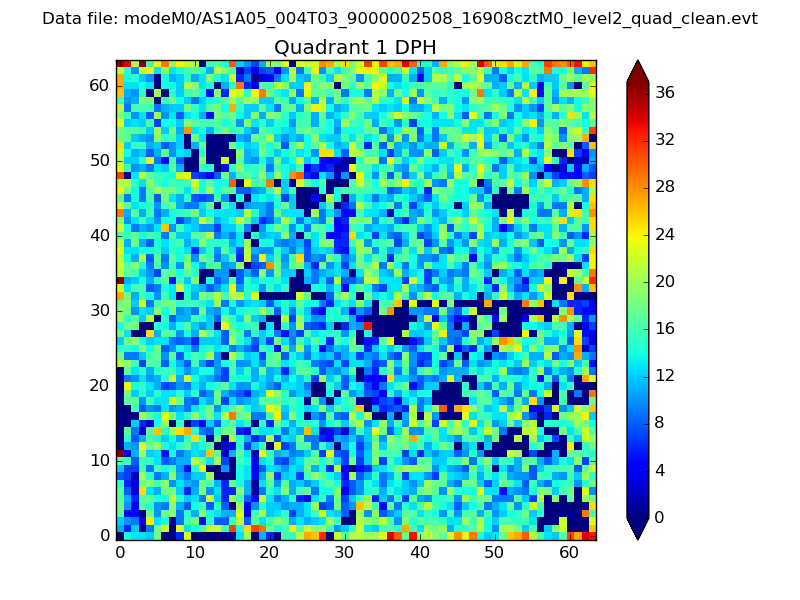
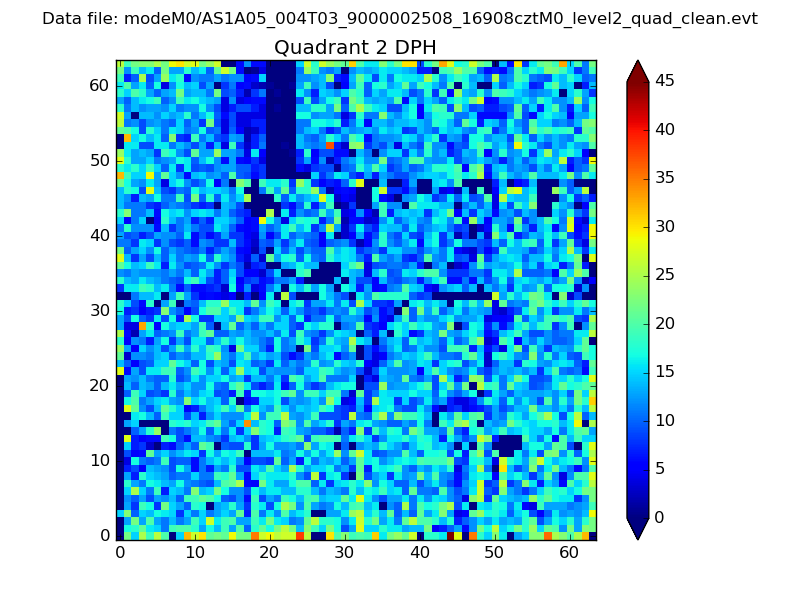
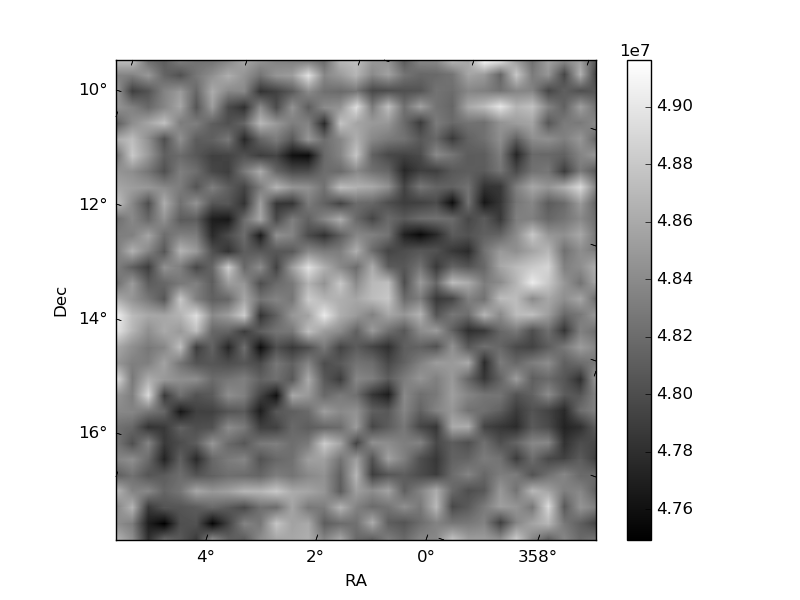
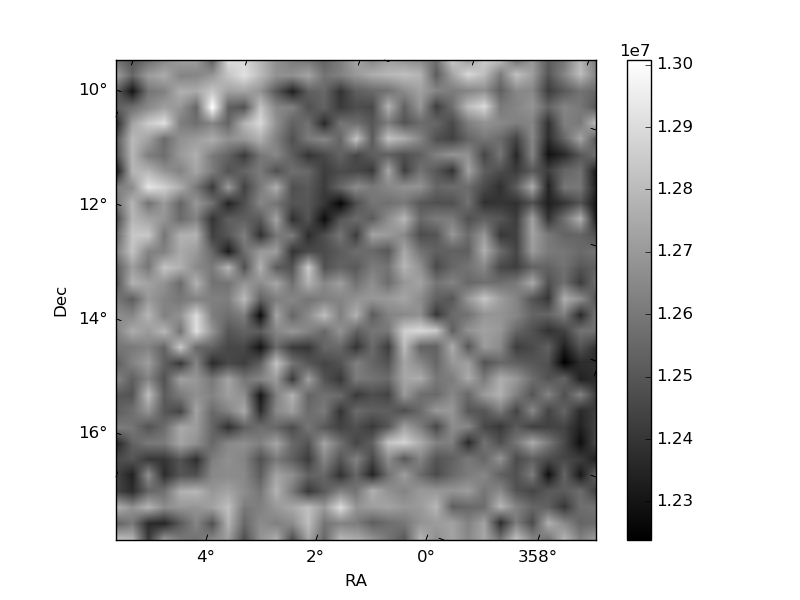
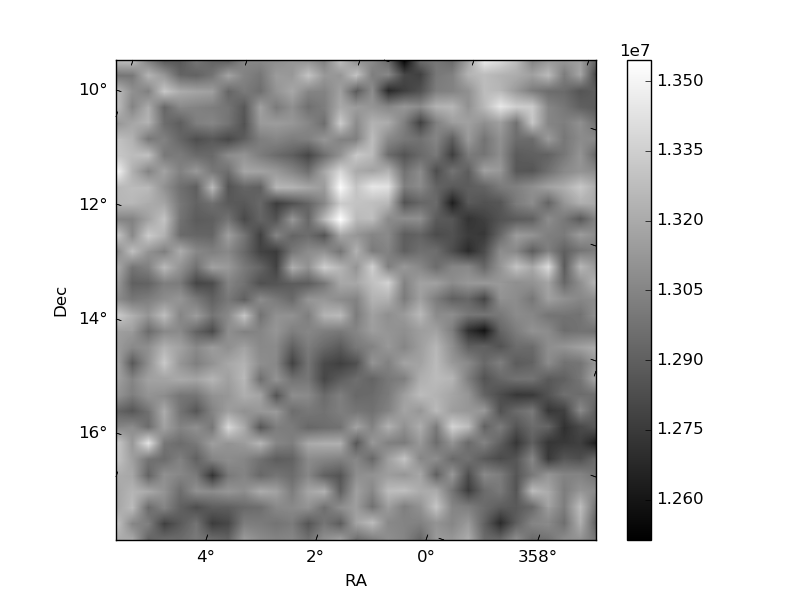
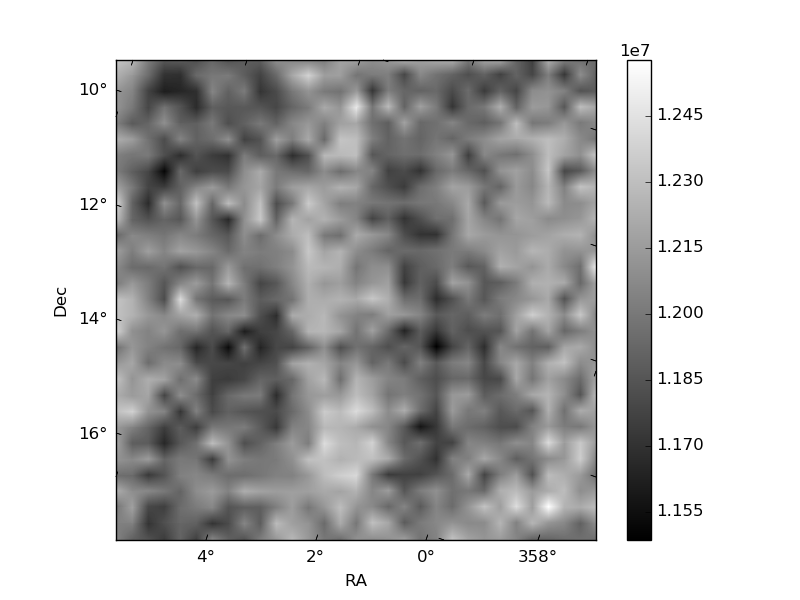
Histogram calculated using DETX and DETY for each event in the final _common_clean file
| Quadrant A | 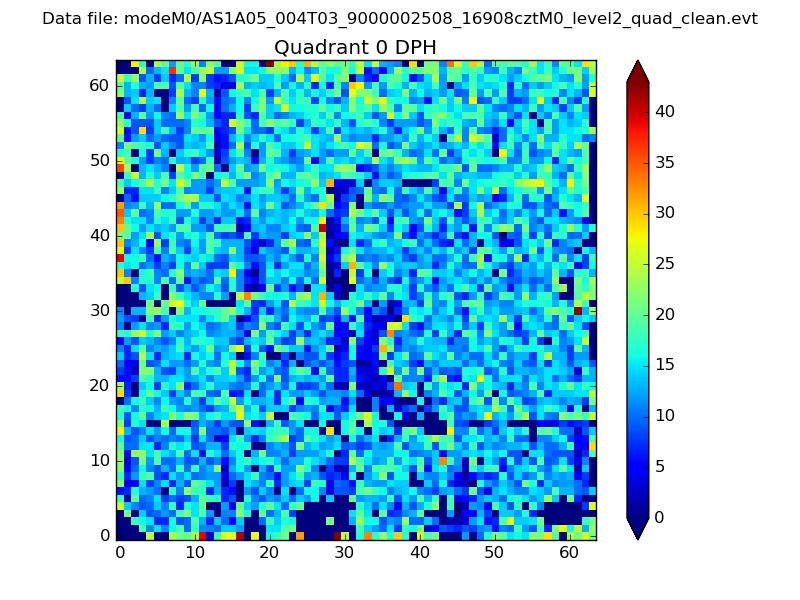 |
 |
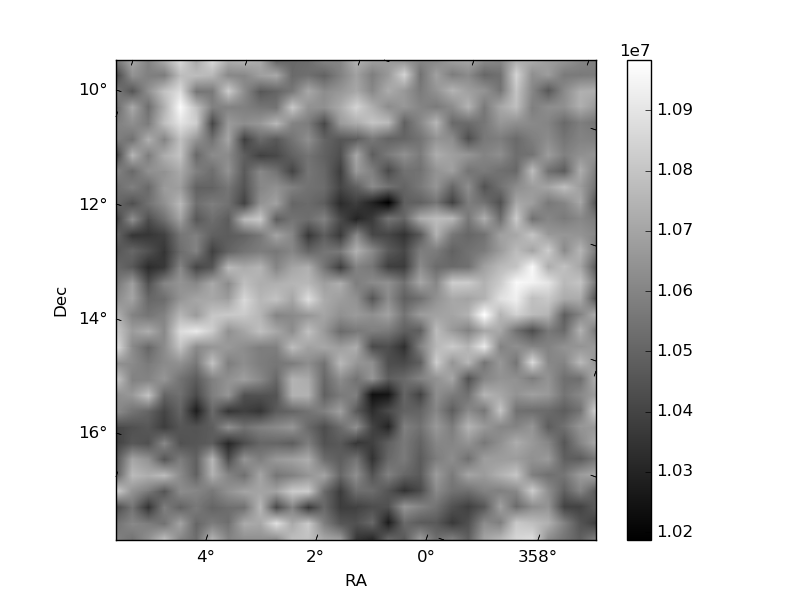
Quadrant B |
|---|---|---|---|
| Quadrant D | 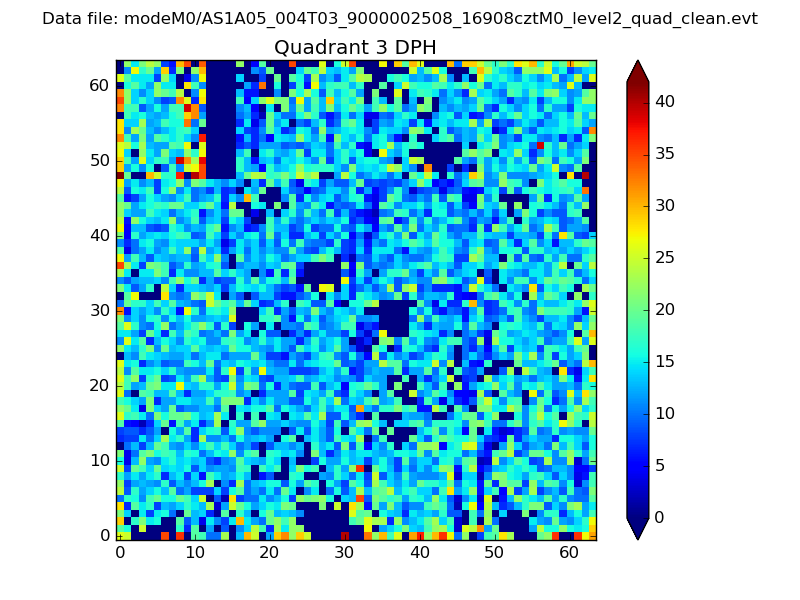 |
 |
Quadrant C |
| Plot type | Count rate plots | Images |
|---|---|---|
| Comparison with Poisson distribution Blue bars denote a histogram of data divided into 1 sec bins. Red curve is a Poisson curve with rate = median count rate of data. |
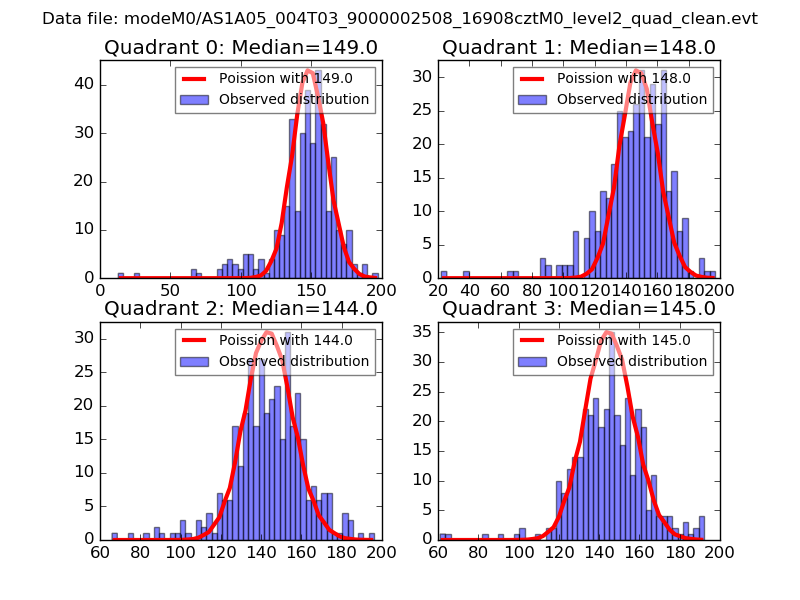 |
 |
| Quadrant-wise count rates Data is divided into 100 sec bins |
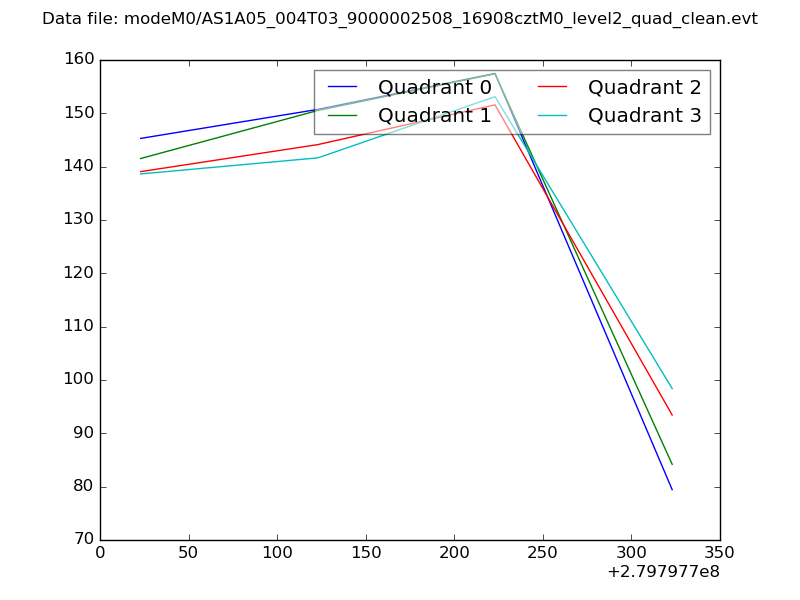 |
|
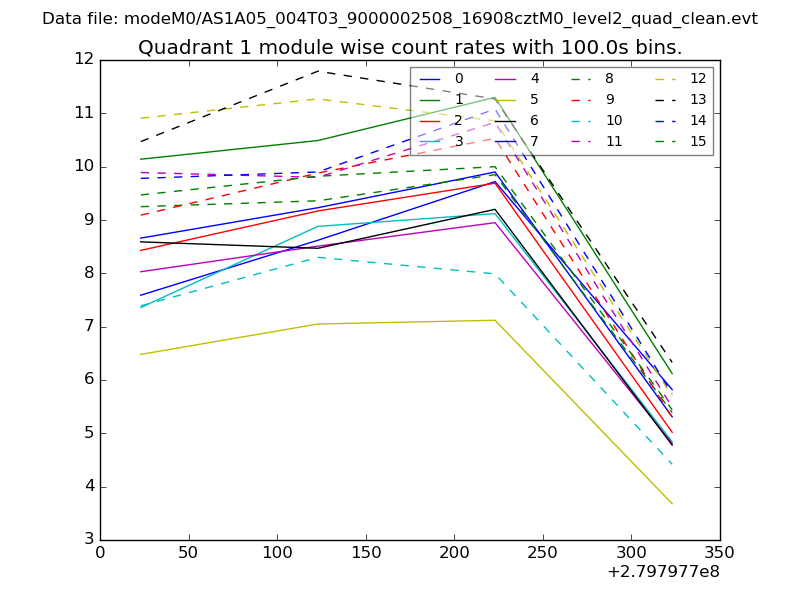
| Module-wise count rates for Quadrant A Data is divided into 100 sec bins |
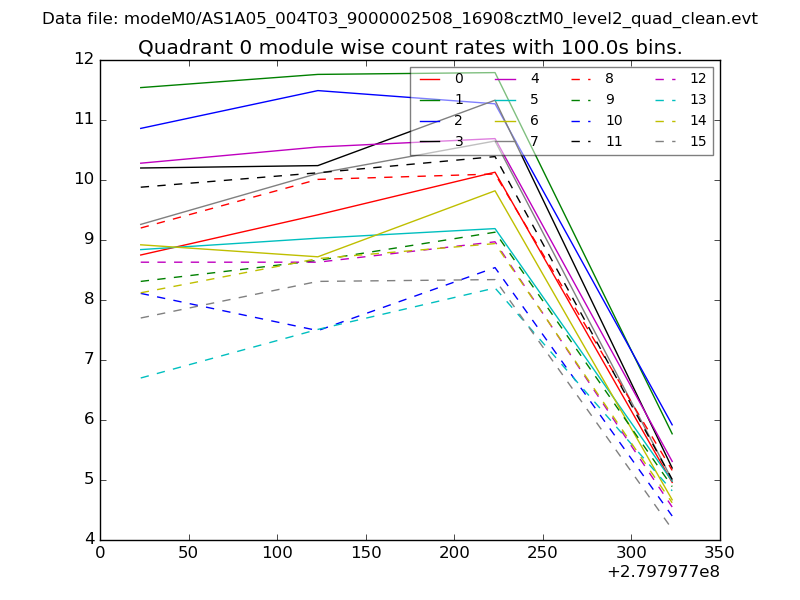 |
 |
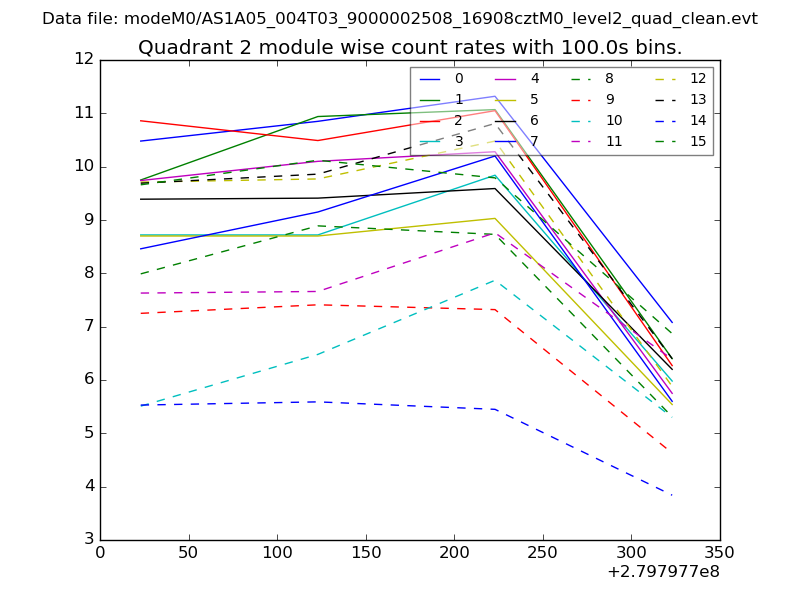
| Module-wise count rates for Quadrant B Data is divided into 100 sec bins |
 |
 |
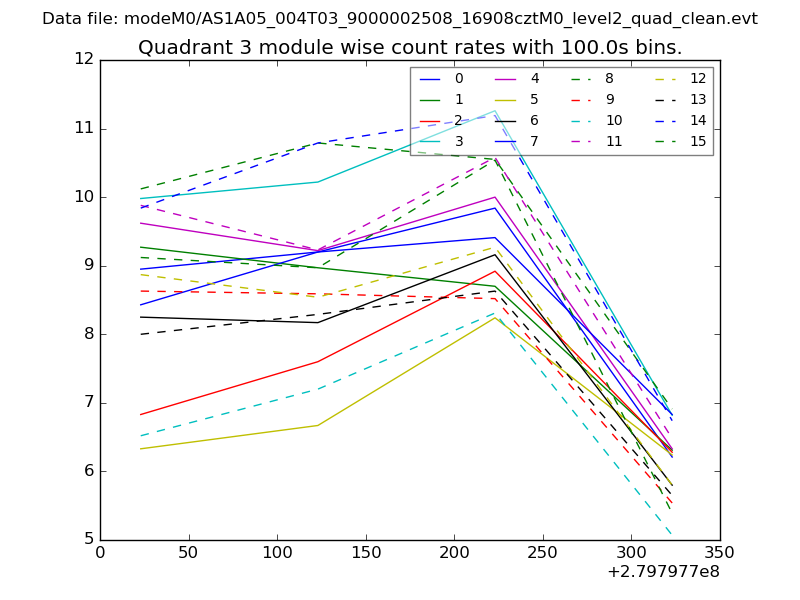
| Module-wise count rates for Quadrant C Data is divided into 100 sec bins |
 |
 |
| Module-wise count rates for Quadrant D Data is divided into 100 sec bins |
 |
 |
| Parameter | Plot |
|---|---|
| CZT HV Monitor | 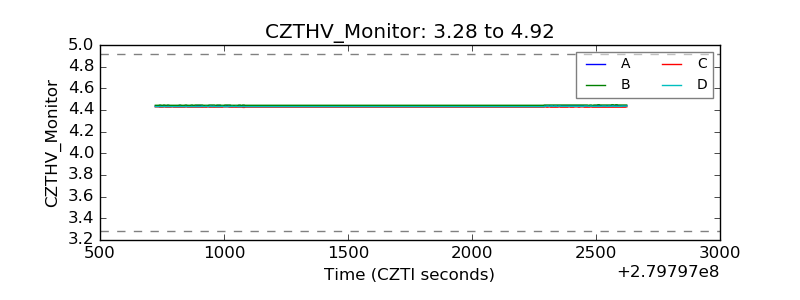 |
| D_VDD | 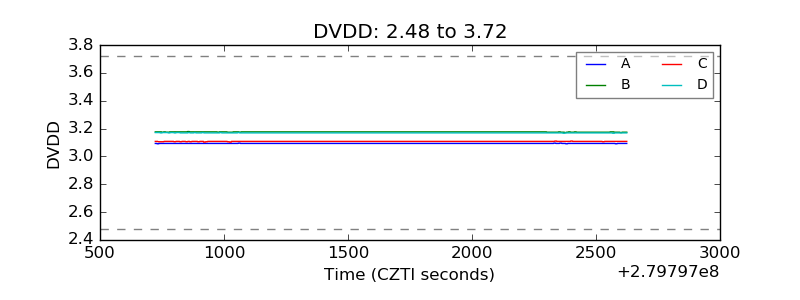 |
| Temperature 1 | 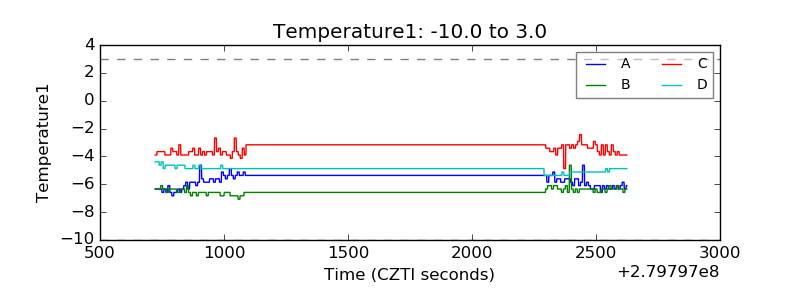 |
| Veto HV Monitor | 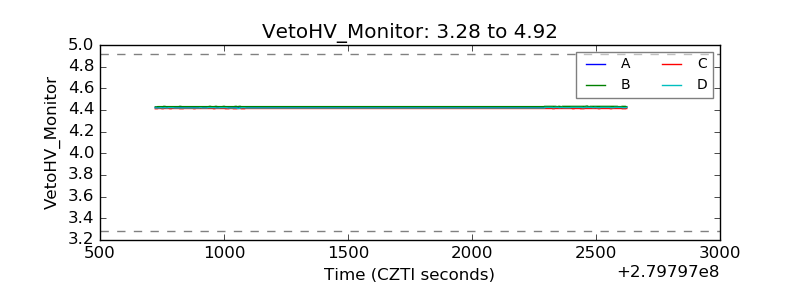 |
| Veto LLD |  |
| Alpha Counter | 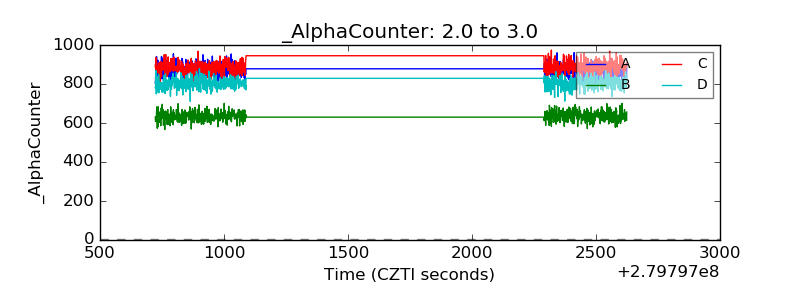 |
| _CPM_Rate | 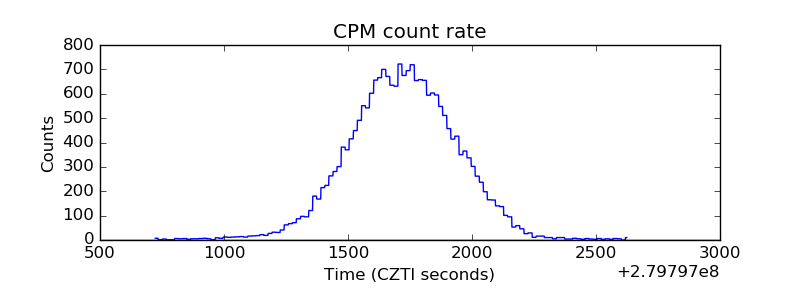 |
| CZT Counter | 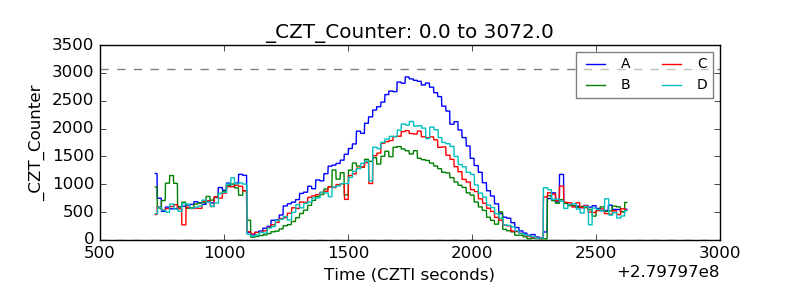 |
| +2.5 Volts monitor |  |
| +5 Volts monitor |  |
| _ROLL_ROT | 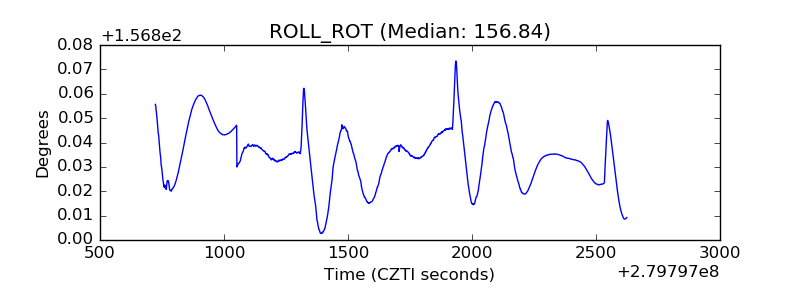 |
| _Roll_DEC | 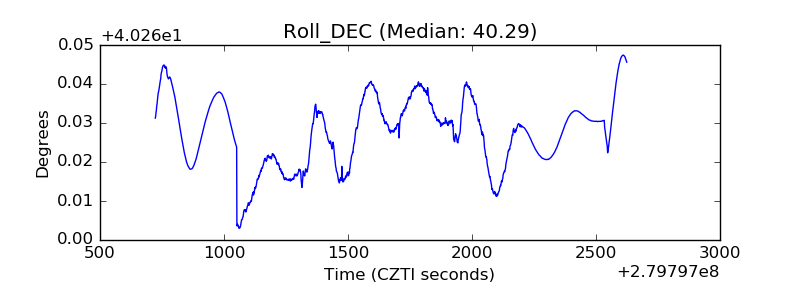 |
| _Roll_RA | 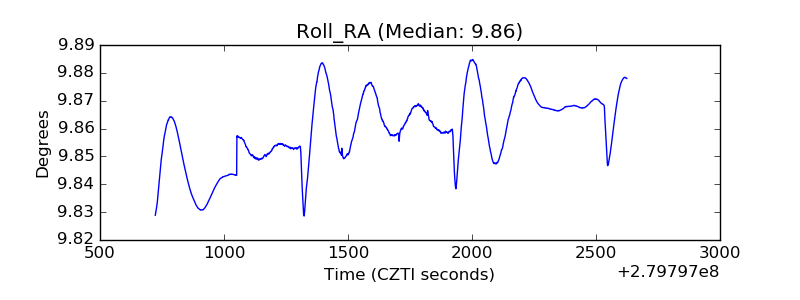 |
| Veto Counter | 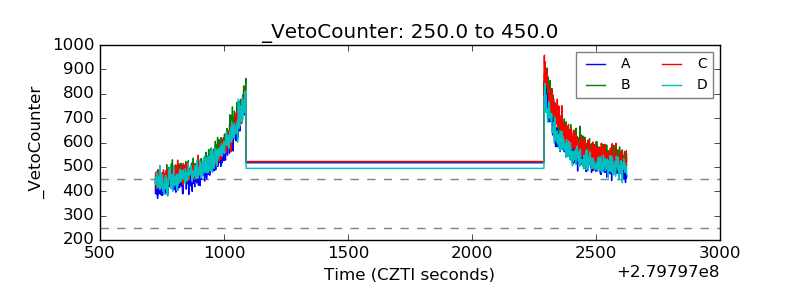 |