| Param | Original file | Final file |
|---|---|---|
| Filename | modeM0/AS1A05_225T02_9000002510cztM0_level2.fits | modeM0/AS1A05_225T02_9000002510cztM0_level2_quad_clean.evt |
| Size (bytes) | 43,300,800 | 66,216,960 |
| Size | 41.3 MB | 63.1 MB |
| Events in quadrant A | 240,892 | 376,419 |
| Events in quadrant B | 258,016 | 460,044 |
| Events in quadrant C | 258,596 | 436,271 |
| Events in quadrant D | 225,362 | 403,867 |
| Mode M0 | |||
|---|---|---|---|
| Quadrant | BADHDUFLAG | Total packets | Discarded packets |
| A | 0 | 20551 | 0 |
| B | 0 | 9738 | 0 |
| C | 0 | 9550 | 0 |
| D | 0 | 10468 | 0 |
| Mode SS | |||
|---|---|---|---|
| Quadrant | BADHDUFLAG | Total packets | Discarded packets |
| A | 0 | 96 | 0 |
| B | 0 | 96 | 0 |
| C | 0 | 96 | 0 |
| D | 0 | 96 | 0 |
| Mode M9 | |||
|---|---|---|---|
| Quadrant | BADHDUFLAG | Total packets | Discarded packets |
| A | 0 | 6 | 0 |
| B | 0 | 6 | 0 |
| C | 0 | 6 | 0 |
| D | 0 | 6 | 0 |
| Quadrant | Total seconds | Saturated seconds | Saturation percentage |
|---|---|---|---|
| A | 4670 | 1008 | 21.584582% |
| B | 4669 | 79 | 1.692011% |
| C | 4669 | 71 | 1.520668% |
| D | 4669 | 81 | 1.734847% |
Noise dominated data is calculated using 1-second bins in cleaned event files. If a bin has >2000 counts, and if more than 50% of those come from <1% of pixels, then it is considered to be noise-dominated and hence unusable.
| Quadrant | # 1 sec bins | Bins with >0 counts | Bins with >2000 counts | High rate bins dominated by noise | Noise dominated (total time) | Noise dominated (detector-on time) | Marked lightcurve |
|---|---|---|---|---|---|---|---|
| A | 5305 | 4667 | 0 | 0 | 0.00% | 0.00% | 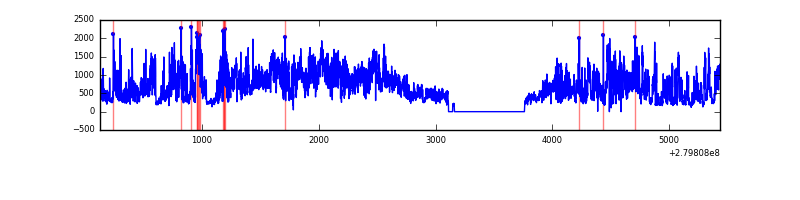 |
| B | 5304 | 4669 | 0 | 0 | 0.00% | 0.00% |  |
| C | 5304 | 4669 | 0 | 0 | 0.00% | 0.00% | 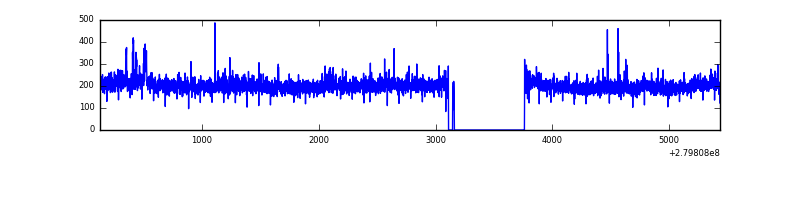 |
| D | 5304 | 4668 | 0 | 0 | 0.00% | 0.00% | 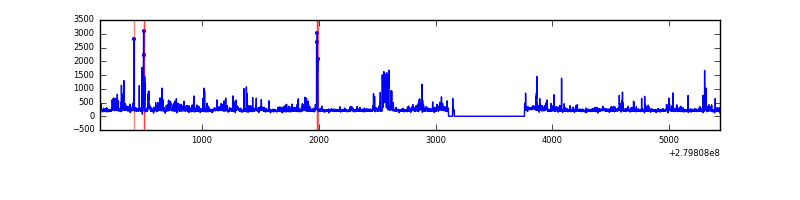 |
Top three noisy pixels from each quadrant. If the there are fewer than three noisy pixels in the level2.evt file, extra rows are filled as -1
| Pixel properties | Quadrant properties | ||||||
|---|---|---|---|---|---|---|---|
| Quadrant | DetID | PixID | Counts | Sigma | Mean | Median | Sigma |
| A | 0 | 29 | 242 | 10.47 | 62 | 59 | 17.5 |
| A | 14 | 188 | 241 | 10.42 | 62 | 59 | 17.5 |
| A | 14 | 204 | 218 | 9.1 | 62 | 59 | 17.5 |
| B | 2 | 9 | 221 | 9.69 | 68 | 65 | 16.1 |
| B | 12 | 226 | 186 | 7.51 | 68 | 65 | 16.1 |
| B | 2 | 8 | 178 | 7.02 | 68 | 65 | 16.1 |
| C | 1 | 80 | 240 | 9.04 | 68 | 64 | 19.5 |
| C | 1 | 81 | 233 | 8.68 | 68 | 64 | 19.5 |
| C | 15 | 65 | 192 | 6.57 | 68 | 64 | 19.5 |
| D | 6 | 38 | 184 | 6.69 | 64 | 58 | 18.8 |
| D | 7 | 3 | 180 | 6.48 | 64 | 58 | 18.8 |
| D | 10 | 113 | 177 | 6.32 | 64 | 58 | 18.8 |
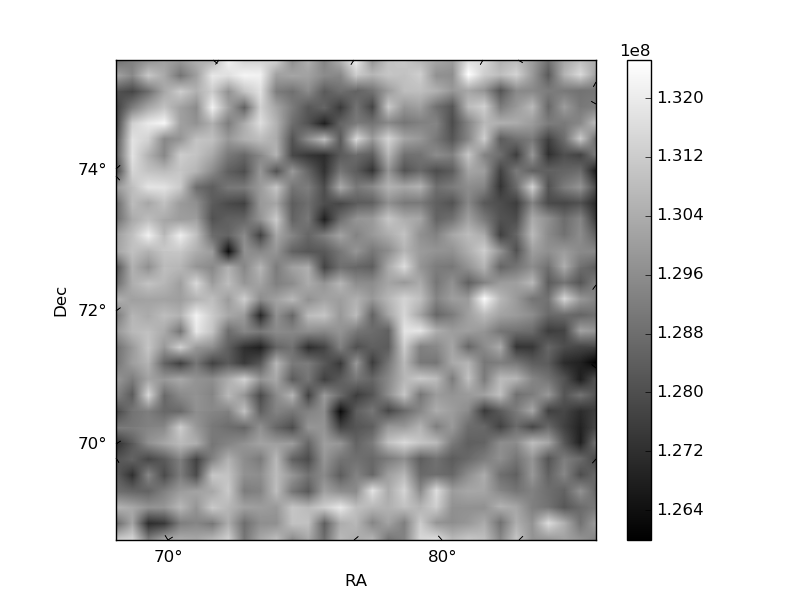
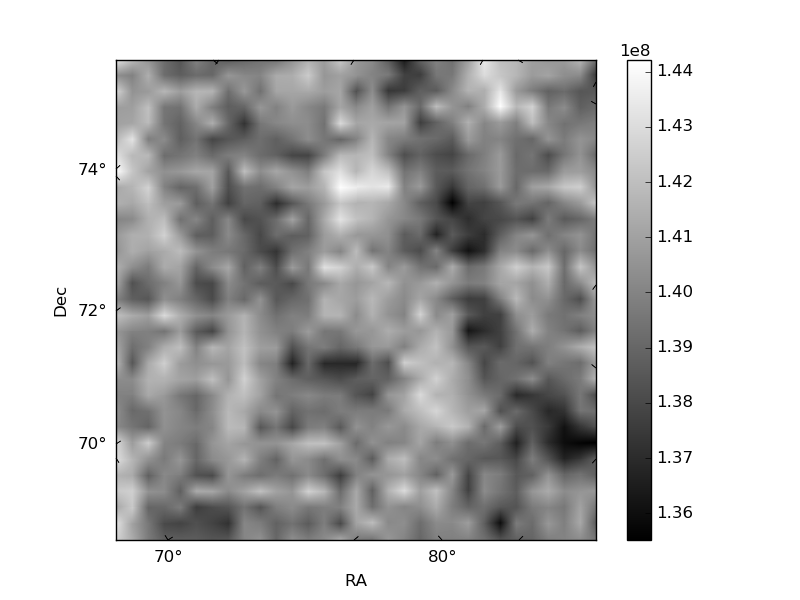
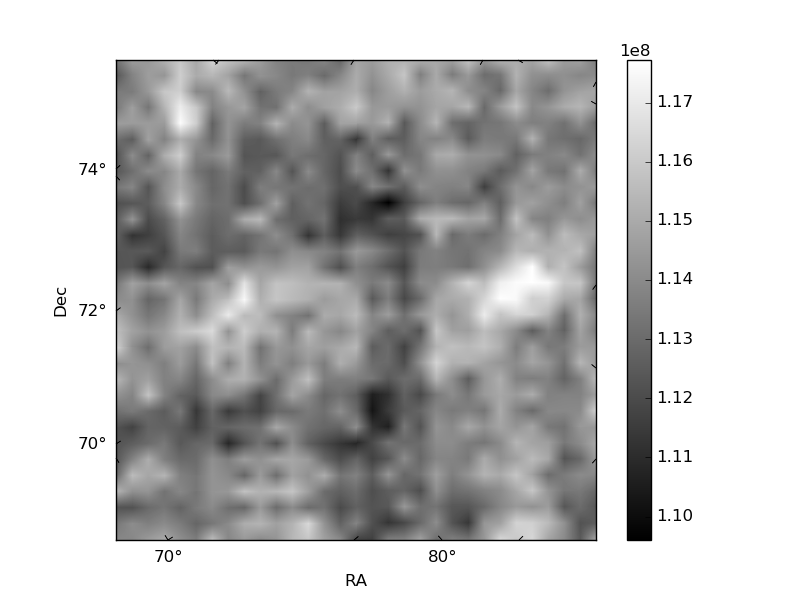
Histogram calculated using DETX and DETY for each event in the final _common_clean file
| Quadrant A |  |
 |
Quadrant B |
|---|---|---|---|
| Quadrant D |  |
 |
Quadrant C |
| Plot type | Count rate plots | Images |
|---|---|---|
| Comparison with Poisson distribution Blue bars denote a histogram of data divided into 1 sec bins. Red curve is a Poisson curve with rate = median count rate of data. |
 |
 |
| Quadrant-wise count rates Data is divided into 100 sec bins |
 |
|
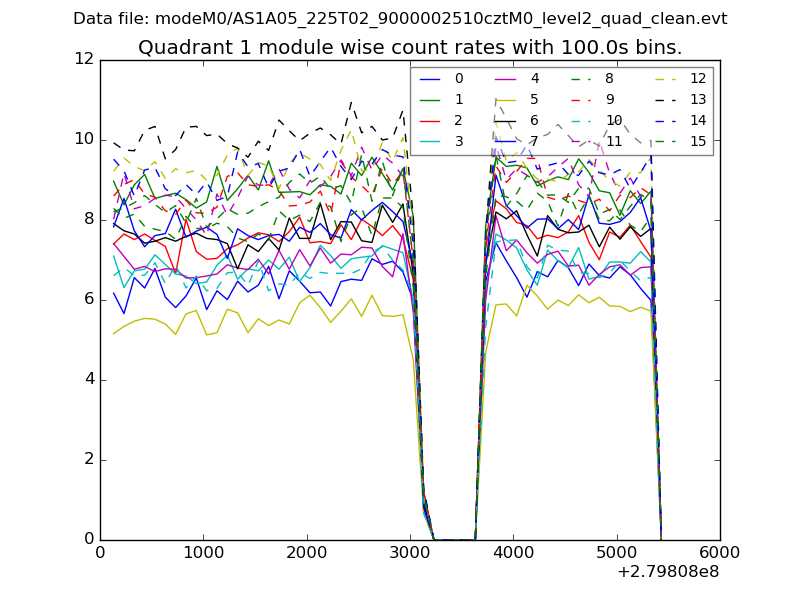
| Module-wise count rates for Quadrant A Data is divided into 100 sec bins |
 |
 |
| Module-wise count rates for Quadrant B Data is divided into 100 sec bins |
 |
 |
| Module-wise count rates for Quadrant C Data is divided into 100 sec bins |
 |
 |
| Module-wise count rates for Quadrant D Data is divided into 100 sec bins |
 |
 |
| Parameter | Plot |
|---|---|
| CZT HV Monitor | 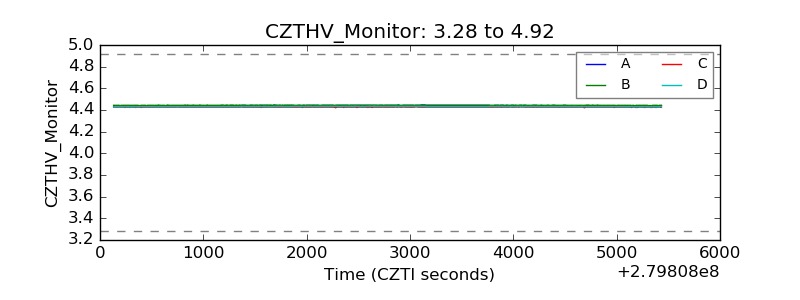 |
| D_VDD |  |
| Temperature 1 |  |
| Veto HV Monitor |  |
| Veto LLD | 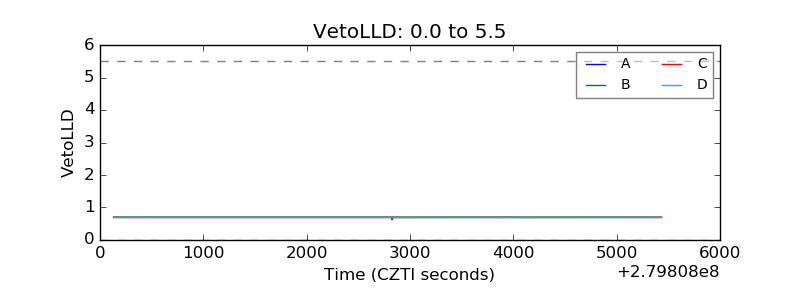 |
| Alpha Counter |  |
| _CPM_Rate | 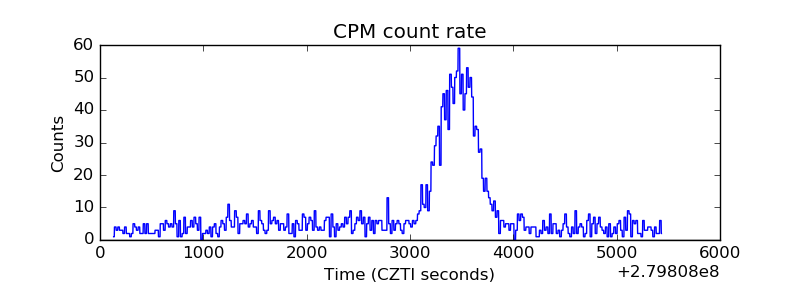 |
| CZT Counter |  |
| +2.5 Volts monitor | 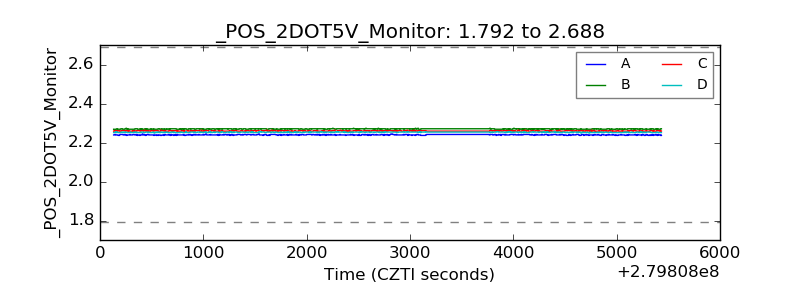 |
| +5 Volts monitor |  |
| _ROLL_ROT |  |
| _Roll_DEC |  |
| _Roll_RA |  |
| Veto Counter | 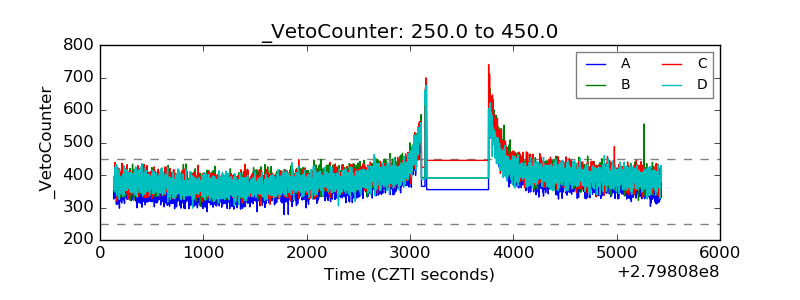 |