| Param | Original file | Final file |
|---|---|---|
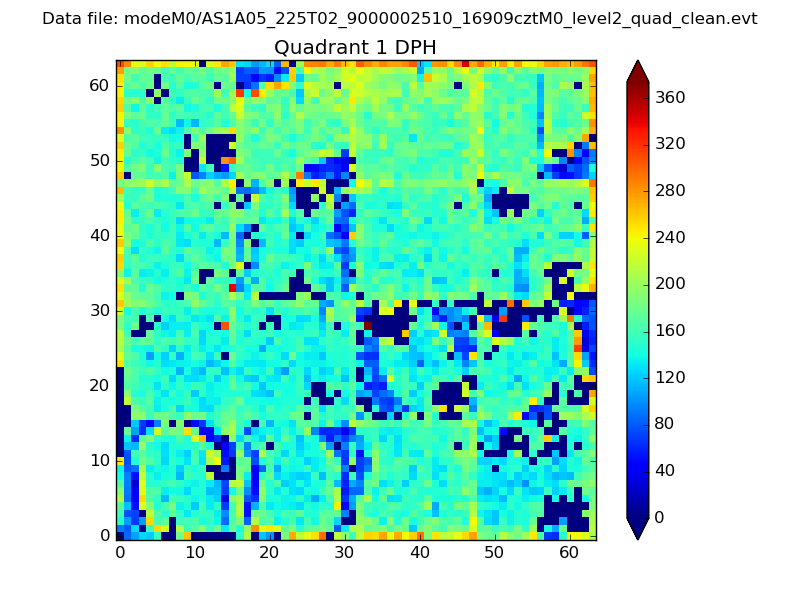
| Filename | modeM0/AS1A05_225T02_9000002510_16909cztM0_level2.evt | modeM0/AS1A05_225T02_9000002510_16909cztM0_level2_quad_clean.evt |
| Size (bytes) | 430,721,280 | 85,944,960 |
| Size | 410.8 MB | 82.0 MB |
| Events in quadrant A | 5,818,763 | 536,816 |
| Events in quadrant B | 2,238,309 | 598,958 |
| Events in quadrant C | 2,205,052 | 573,698 |
| Events in quadrant D | 2,464,694 | 564,716 |
| Mode M0 | |||
|---|---|---|---|
| Quadrant | BADHDUFLAG | Total packets | Discarded packets |
| A | 0 | 20552 | 1 |
| B | 0 | 9739 | 1 |
| C | 0 | 9551 | 1 |
| D | 0 | 10469 | 1 |
| Mode SS | |||
|---|---|---|---|
| Quadrant | BADHDUFLAG | Total packets | Discarded packets |
| A | 0 | 96 | 0 |
| B | 0 | 96 | 0 |
| C | 0 | 96 | 0 |
| D | 0 | 96 | 0 |
| Mode M9 | |||
|---|---|---|---|
| Quadrant | BADHDUFLAG | Total packets | Discarded packets |
| A | 0 | 6 | 0 |
| B | 0 | 6 | 0 |
| C | 0 | 6 | 0 |
| D | 0 | 6 | 0 |
| Quadrant | Total seconds | Saturated seconds | Saturation percentage |
|---|---|---|---|
| A | 4670 | 1008 | 21.584582% |
| B | 4669 | 79 | 1.692011% |
| C | 4669 | 71 | 1.520668% |
| D | 4669 | 81 | 1.734847% |
Noise dominated data is calculated using 1-second bins in cleaned event files. If a bin has >2000 counts, and if more than 50% of those come from <1% of pixels, then it is considered to be noise-dominated and hence unusable.
| Quadrant | # 1 sec bins | Bins with >0 counts | Bins with >2000 counts | High rate bins dominated by noise | Noise dominated (total time) | Noise dominated (detector-on time) | Marked lightcurve |
|---|---|---|---|---|---|---|---|
| A | 5306 | 4673 | 679 | 679 | 12.80% | 14.53% |  |
| B | 5305 | 4672 | 3 | 3 | 0.06% | 0.06% | 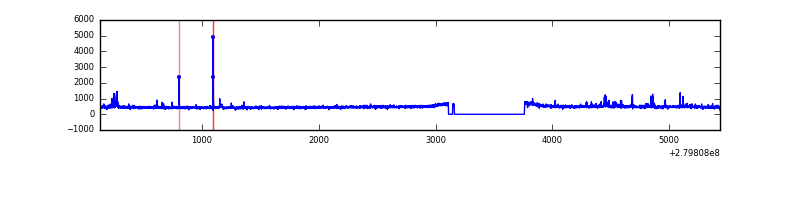 |
| C | 5305 | 4672 | 0 | 0 | 0.00% | 0.00% | 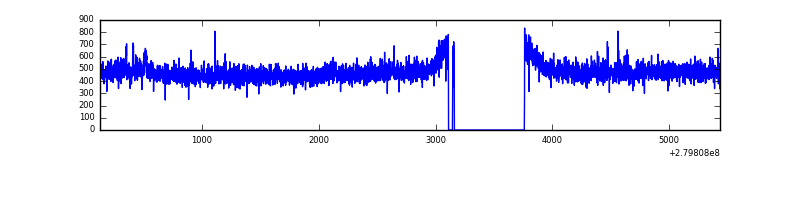 |
| D | 5305 | 4672 | 25 | 25 | 0.47% | 0.54% | 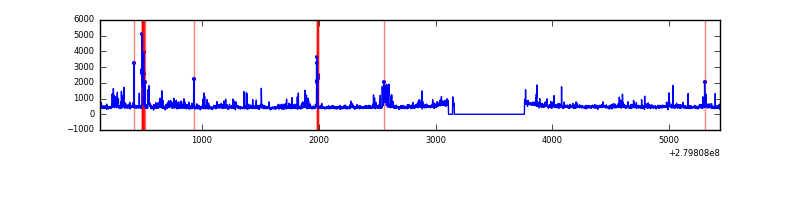 |
Top three noisy pixels from each quadrant. If the there are fewer than three noisy pixels in the level2.evt file, extra rows are filled as -1
| Pixel properties | Quadrant properties | ||||||
|---|---|---|---|---|---|---|---|
| Quadrant | DetID | PixID | Counts | Sigma | Mean | Median | Sigma |
| A | 15 | 174 | 3717773 | 35591.82 | 512 | 501 | 104.4 |
| A | 12 | 189 | 67614 | 642.59 | 512 | 501 | 104.4 |
| A | 0 | 23 | 51882 | 491.96 | 512 | 501 | 104.4 |
| B | 15 | 35 | 21304 | 198.33 | 548 | 533 | 104.7 |
| B | 0 | 189 | 19233 | 178.55 | 548 | 533 | 104.7 |
| B | 0 | 229 | 12192 | 111.32 | 548 | 533 | 104.7 |
| C | 14 | 238 | 81076 | 654.17 | 526 | 527 | 123.1 |
| C | 3 | 233 | 70231 | 566.09 | 526 | 527 | 123.1 |
| C | 13 | 61 | 3722 | 25.95 | 526 | 527 | 123.1 |
| D | 1 | 52 | 313219 | 2409.94 | 530 | 514 | 129.8 |
| D | 15 | 0 | 56985 | 435.21 | 530 | 514 | 129.8 |
| D | 13 | 112 | 43621 | 332.22 | 530 | 514 | 129.8 |
Histogram calculated using DETX and DETY for each event in the final _common_clean file
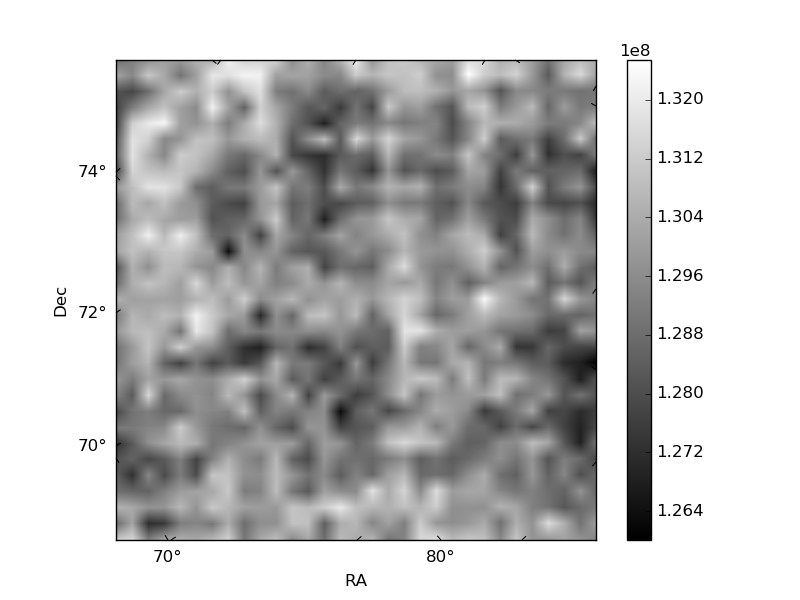
| Quadrant A |  |
 |
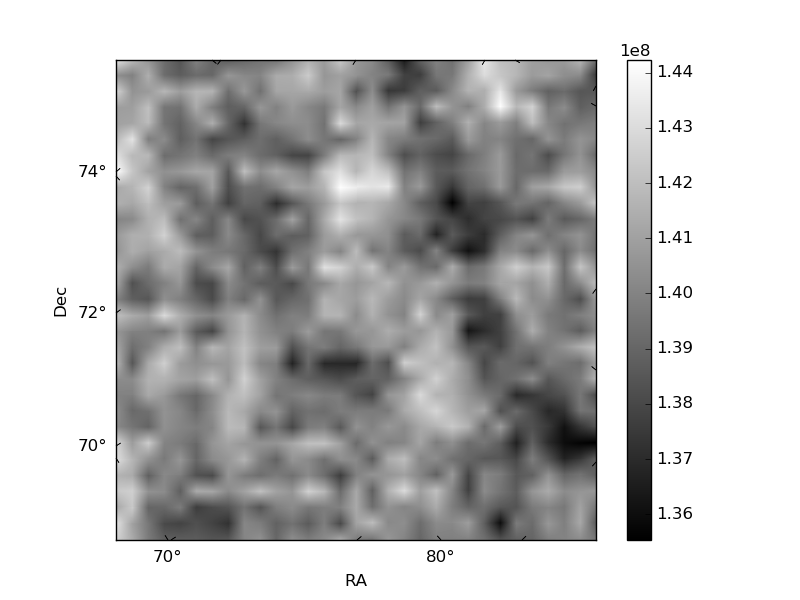
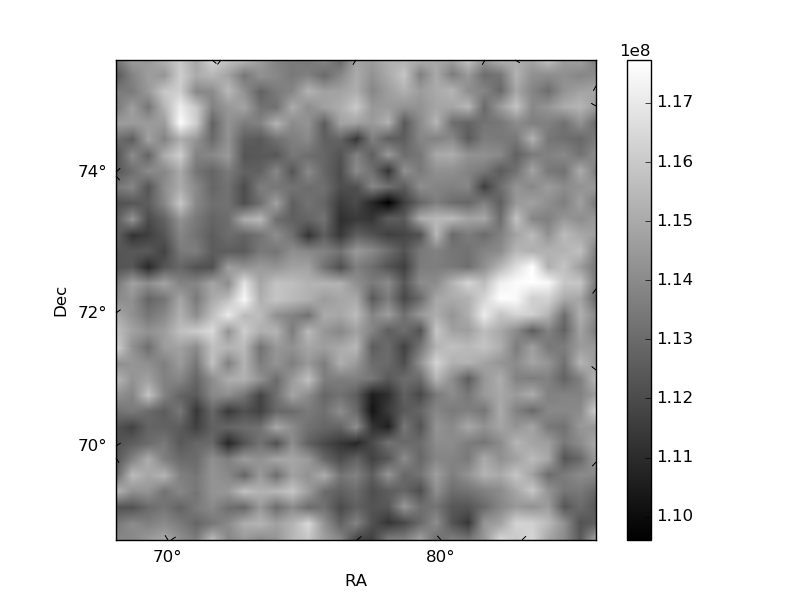
Quadrant B |
|---|---|---|---|
| Quadrant D | 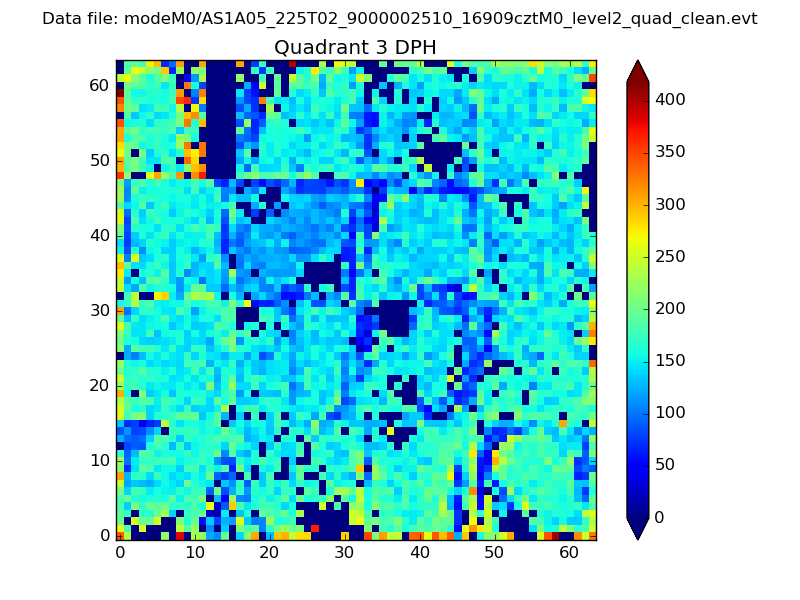 |
 |
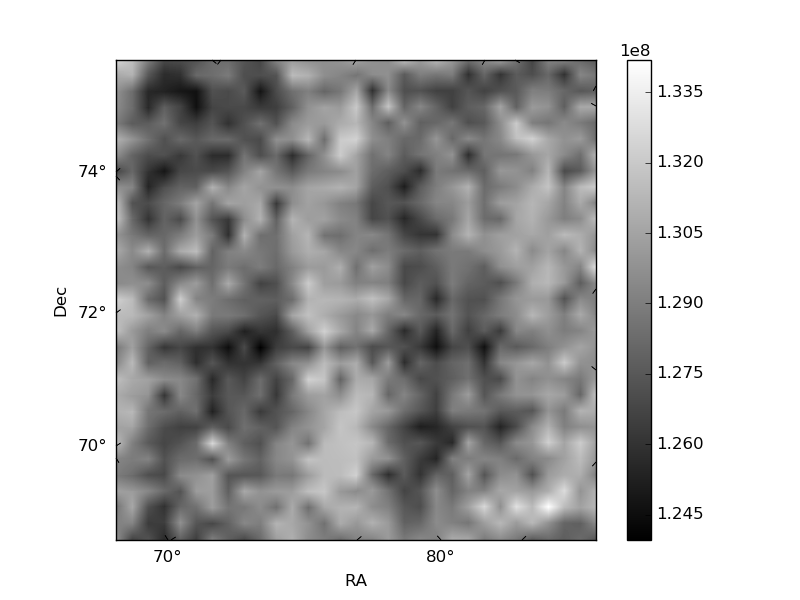
Quadrant C |
| Plot type | Count rate plots | Images |
|---|---|---|
| Comparison with Poisson distribution Blue bars denote a histogram of data divided into 1 sec bins. Red curve is a Poisson curve with rate = median count rate of data. |
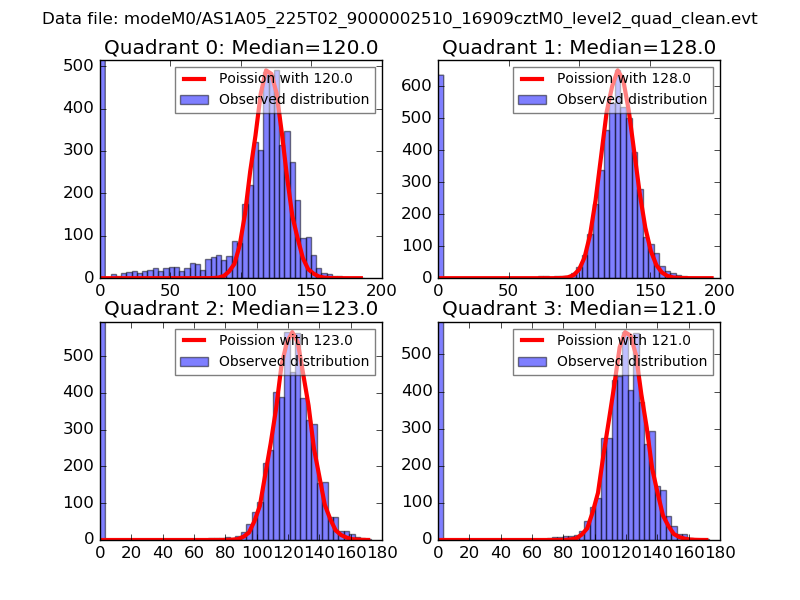 |
 |
| Quadrant-wise count rates Data is divided into 100 sec bins |
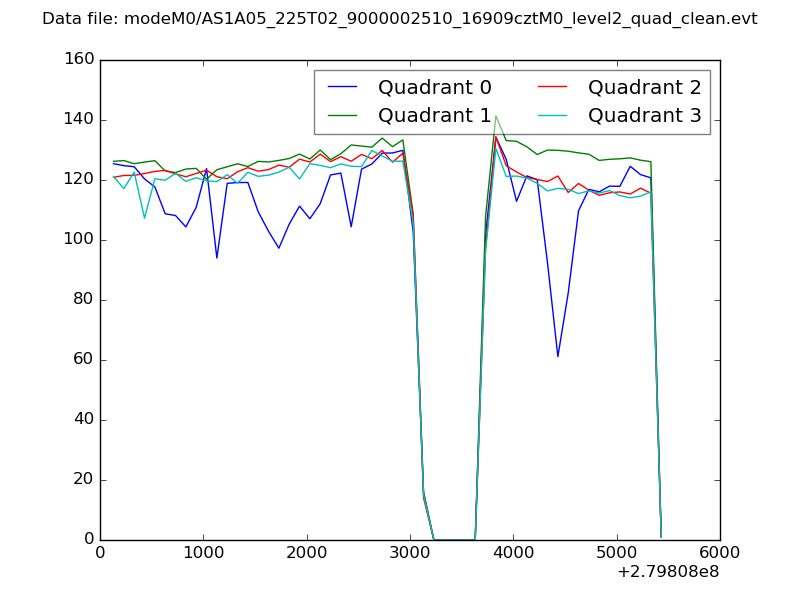 |
|
| Module-wise count rates for Quadrant A Data is divided into 100 sec bins |
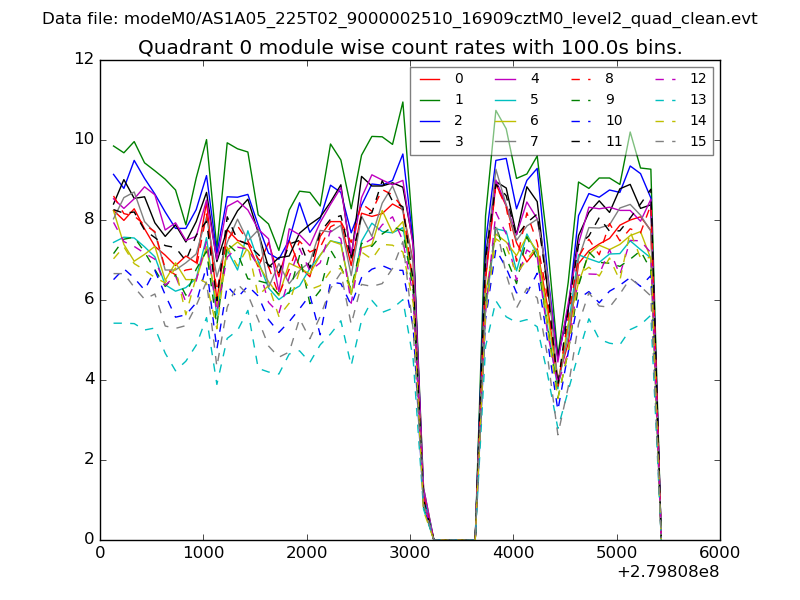 |
 |
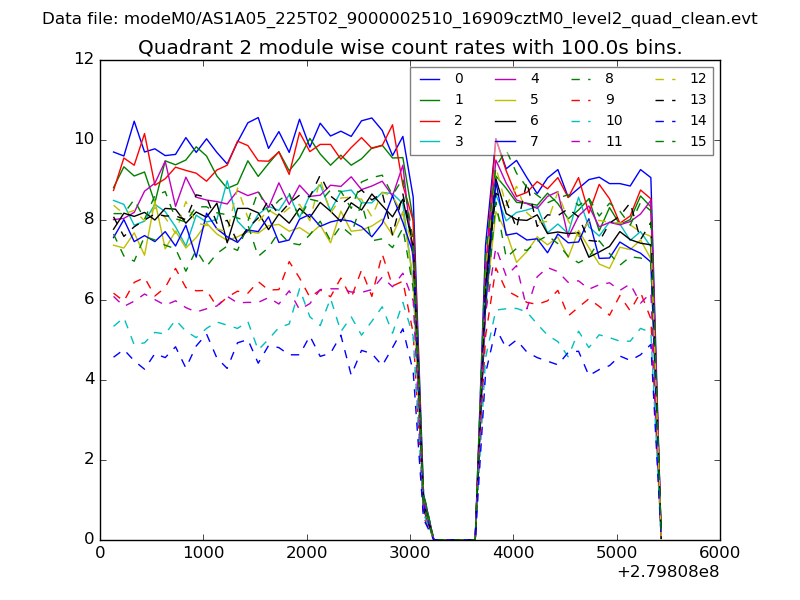
| Module-wise count rates for Quadrant B Data is divided into 100 sec bins |
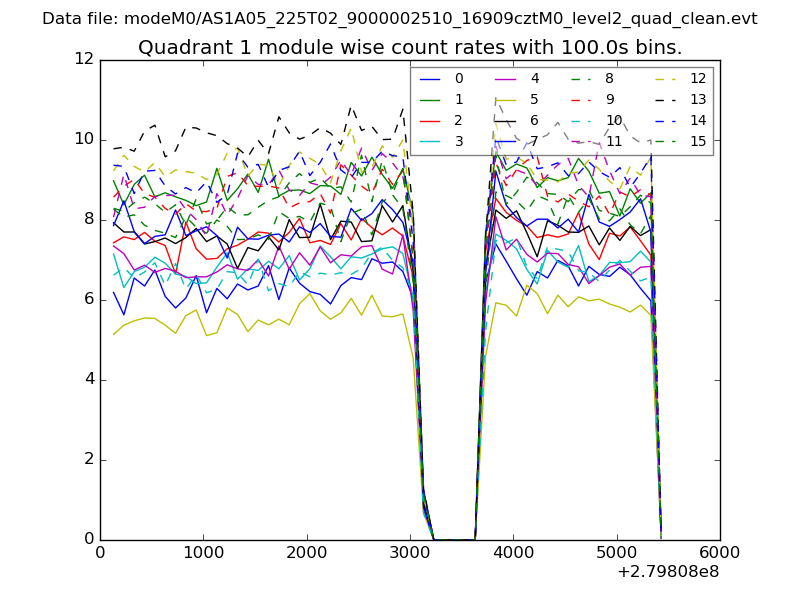 |
 |
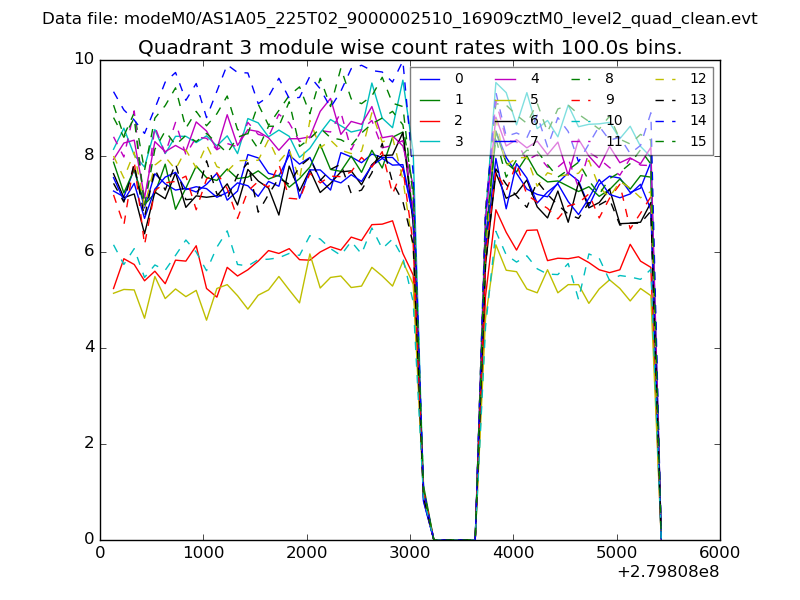
| Module-wise count rates for Quadrant C Data is divided into 100 sec bins |
 |
 |
| Module-wise count rates for Quadrant D Data is divided into 100 sec bins |
 |
 |
| Parameter | Plot |
|---|---|
| CZT HV Monitor | 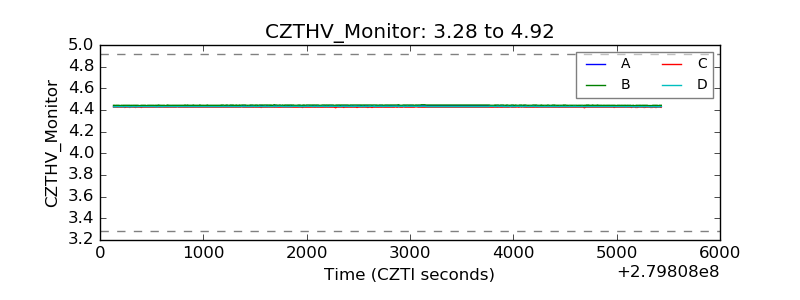 |
| D_VDD | 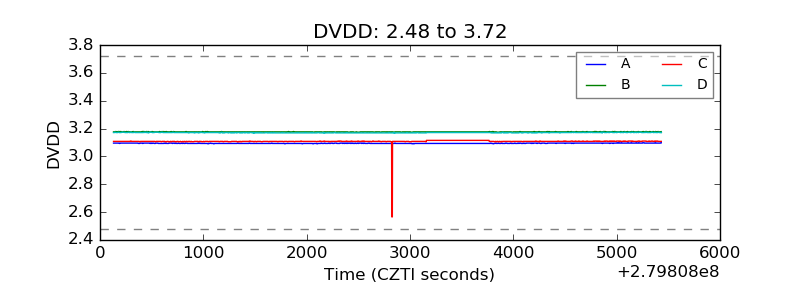 |
| Temperature 1 | 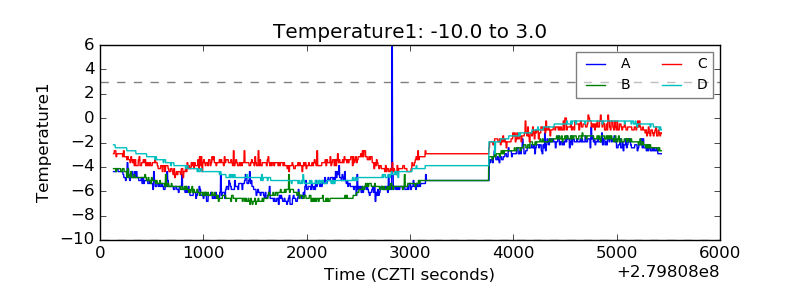 |
| Veto HV Monitor | 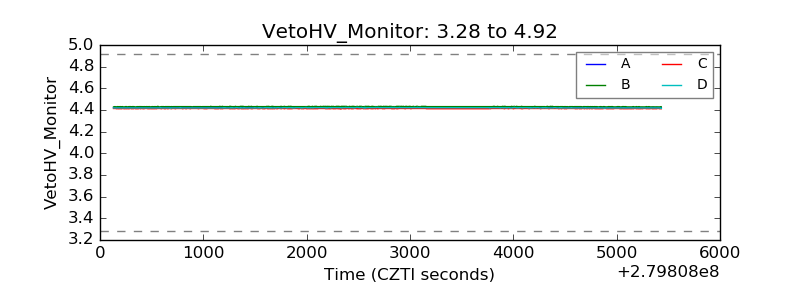 |
| Veto LLD | 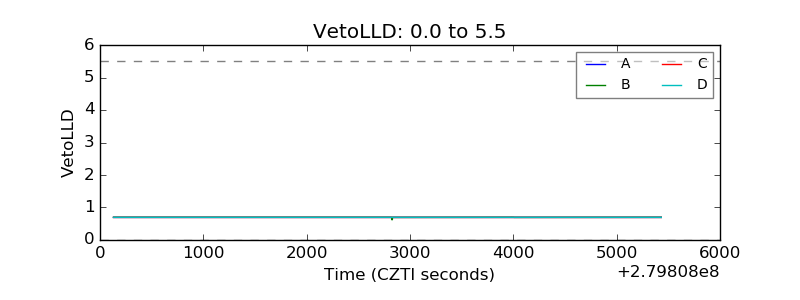 |
| Alpha Counter | 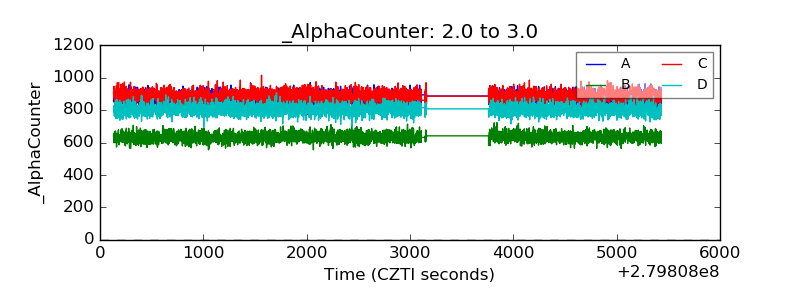 |
| _CPM_Rate | 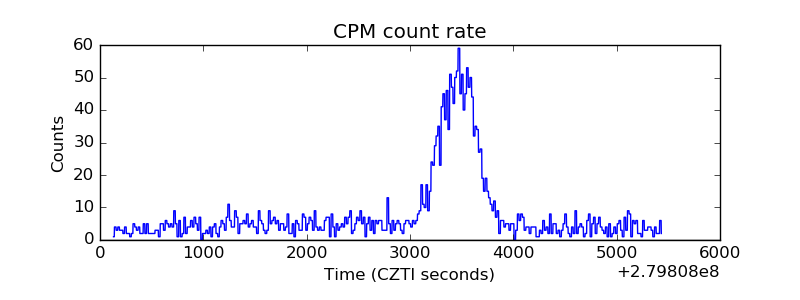 |
| CZT Counter |  |
| +2.5 Volts monitor |  |
| +5 Volts monitor |  |
| _ROLL_ROT | 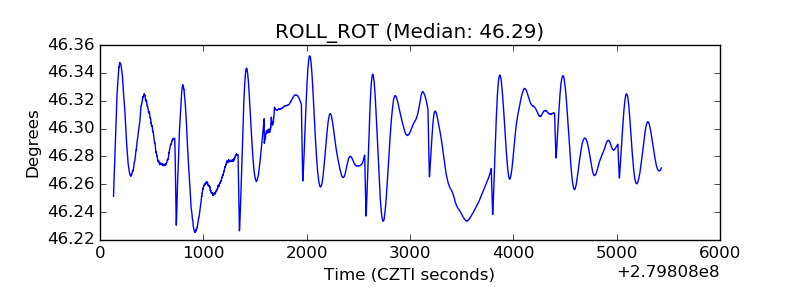 |
| _Roll_DEC | 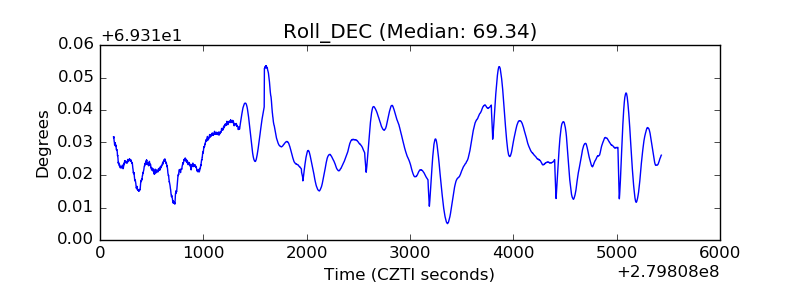 |
| _Roll_RA | 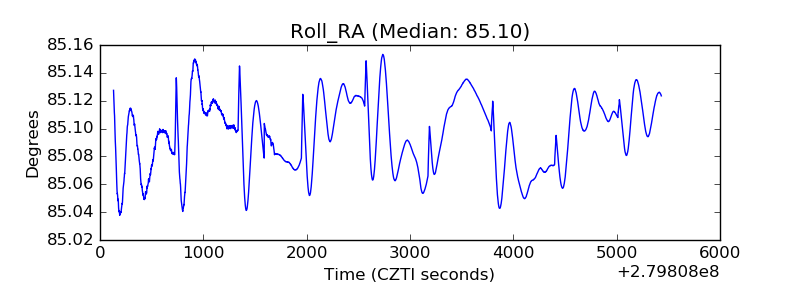 |
| Veto Counter | 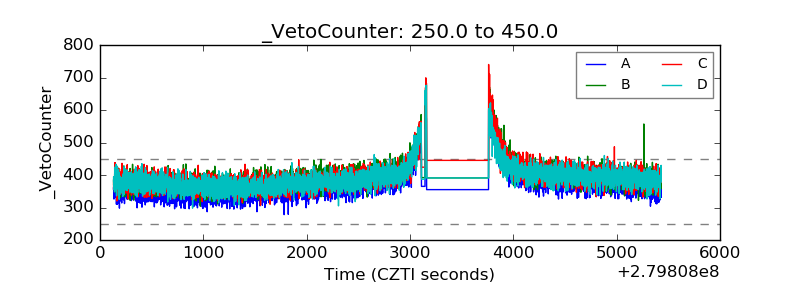 |