| Param | Original file | Final file |
|---|---|---|
| Filename | modeM0/AS1T03_030T01_9000002512cztM0_level2.fits | modeM0/AS1T03_030T01_9000002512cztM0_level2_quad_clean.evt |
| Size (bytes) | 788,238,720 | 768,974,400 |
| Size | 751.7 MB | 733.4 MB |
| Events in quadrant A | 4,454,970 | 3,948,497 |
| Events in quadrant B | 4,781,208 | 4,927,364 |
| Events in quadrant C | 4,796,536 | 4,659,933 |
| Events in quadrant D | 4,098,054 | 4,021,886 |
| Mode M9 | |||
|---|---|---|---|
| Quadrant | BADHDUFLAG | Total packets | Discarded packets |
| A | 0 | 118 | 0 |
| B | 0 | 118 | 0 |
| C | 0 | 118 | 0 |
| D | 0 | 118 | 0 |
| Mode M0 | |||
|---|---|---|---|
| Quadrant | BADHDUFLAG | Total packets | Discarded packets |
| A | 0 | 326680 | 0 |
| B | 0 | 182967 | 0 |
| C | 0 | 176855 | 0 |
| D | 0 | 226637 | 0 |
| Mode SS | |||
|---|---|---|---|
| Quadrant | BADHDUFLAG | Total packets | Discarded packets |
| A | 0 | 1706 | 0 |
| B | 0 | 1706 | 0 |
| C | 0 | 1706 | 0 |
| D | 0 | 1706 | 0 |
| Quadrant | Total seconds | Saturated seconds | Saturation percentage |
|---|---|---|---|
| A | 83573 | 19326 | 23.124693% |
| B | 83573 | 1826 | 2.184916% |
| C | 83574 | 1382 | 1.653624% |
| D | 83574 | 5555 | 6.646804% |
Noise dominated data is calculated using 1-second bins in cleaned event files. If a bin has >2000 counts, and if more than 50% of those come from <1% of pixels, then it is considered to be noise-dominated and hence unusable.
| Quadrant | # 1 sec bins | Bins with >0 counts | Bins with >2000 counts | High rate bins dominated by noise | Noise dominated (total time) | Noise dominated (detector-on time) | Marked lightcurve |
|---|---|---|---|---|---|---|---|
| A | 95463 | 83426 | 0 | 0 | 0.00% | 0.00% | 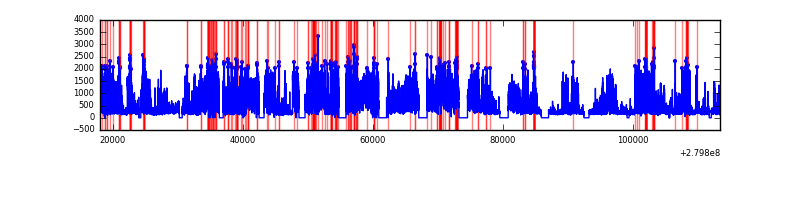 |
| B | 95463 | 83571 | 0 | 0 | 0.00% | 0.00% | 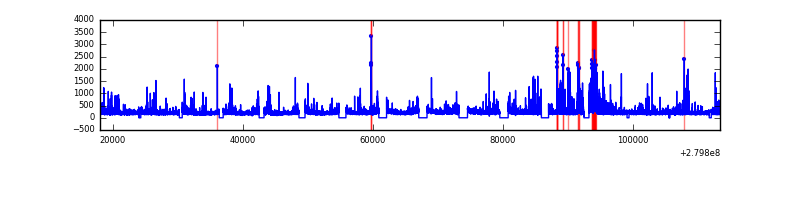 |
| C | 95464 | 83574 | 0 | 0 | 0.00% | 0.00% | 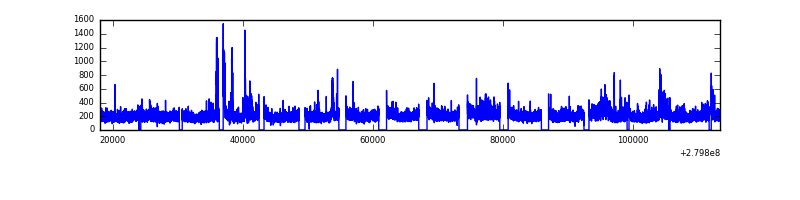 |
| D | 95463 | 83236 | 0 | 0 | 0.00% | 0.00% | 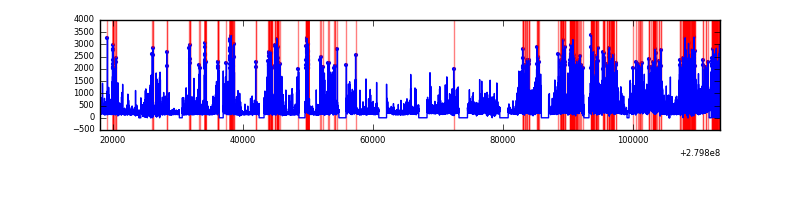 |
Top three noisy pixels from each quadrant. If the there are fewer than three noisy pixels in the level2.evt file, extra rows are filled as -1
| Pixel properties | Quadrant properties | ||||||
|---|---|---|---|---|---|---|---|
| Quadrant | DetID | PixID | Counts | Sigma | Mean | Median | Sigma |
| A | 0 | 29 | 4243 | 10.97 | 1159 | 1085 | 287.8 |
| A | 7 | 110 | 3639 | 8.87 | 1159 | 1085 | 287.8 |
| A | 9 | 19 | 3385 | 7.99 | 1159 | 1085 | 287.8 |
| B | 2 | 9 | 3793 | 10.43 | 1265 | 1207 | 248.0 |
| B | 3 | 17 | 3253 | 8.25 | 1265 | 1207 | 248.0 |
| B | 2 | 8 | 3219 | 8.11 | 1265 | 1207 | 248.0 |
| C | 12 | 241 | 3422 | 6.93 | 1267 | 1180 | 323.3 |
| C | 3 | 126 | 3298 | 6.55 | 1267 | 1180 | 323.3 |
| C | 3 | 158 | 3188 | 6.21 | 1267 | 1180 | 323.3 |
| D | 3 | 14 | 2966 | 6.1 | 1169 | 1063 | 312.1 |
| D | 6 | 231 | 2925 | 5.97 | 1169 | 1063 | 312.1 |
| D | 6 | 67 | 2868 | 5.78 | 1169 | 1063 | 312.1 |
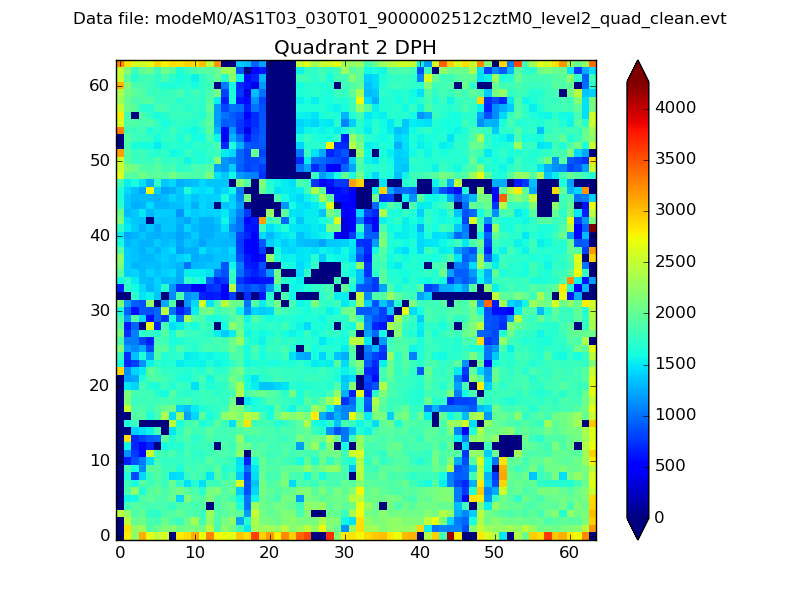
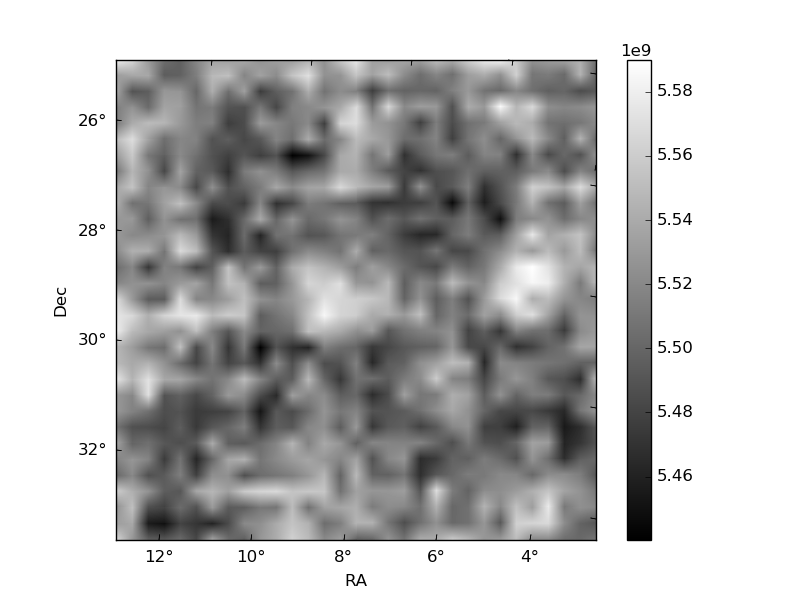
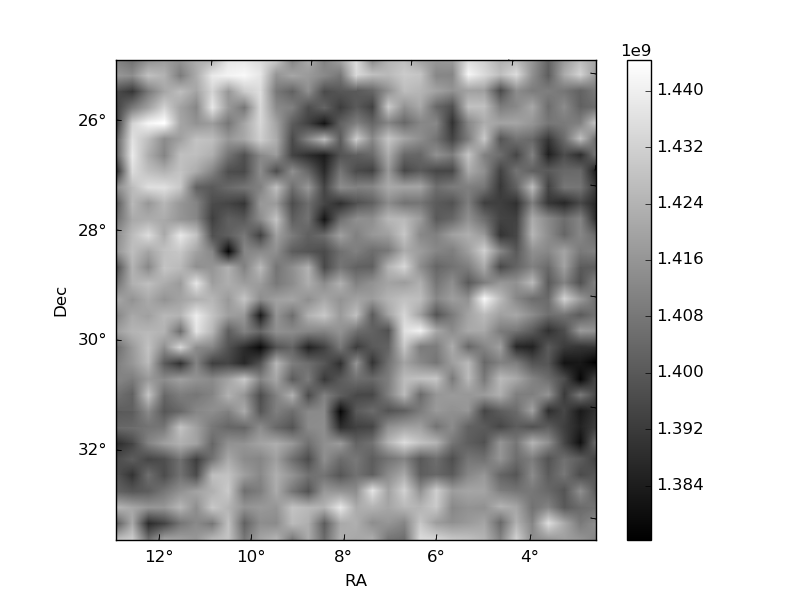
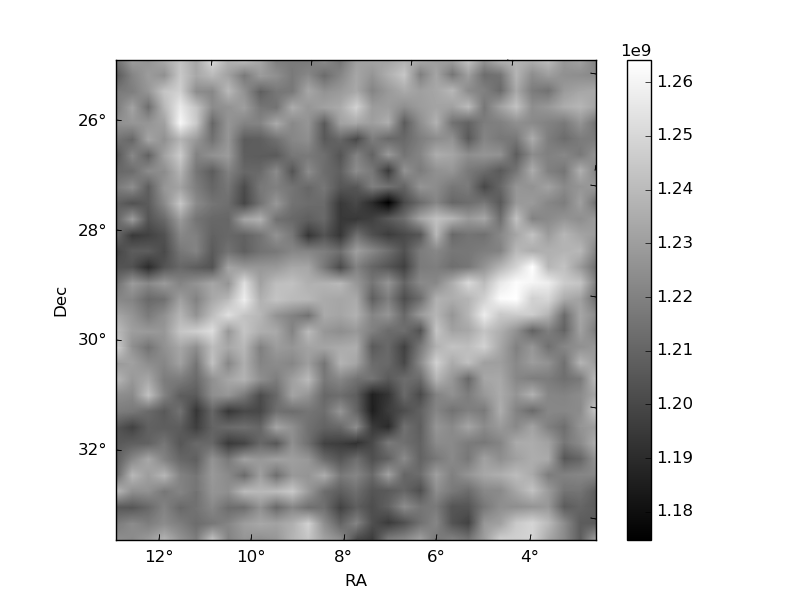
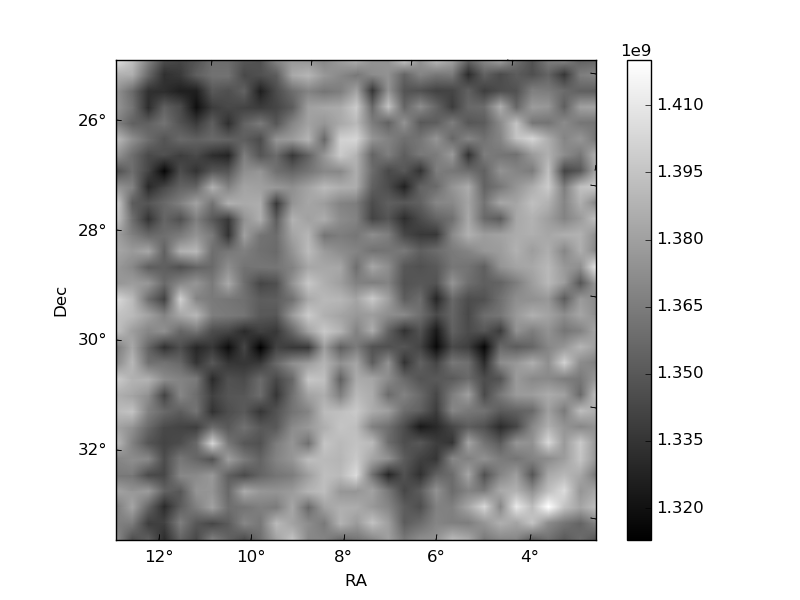
Histogram calculated using DETX and DETY for each event in the final _common_clean file
| Quadrant A | 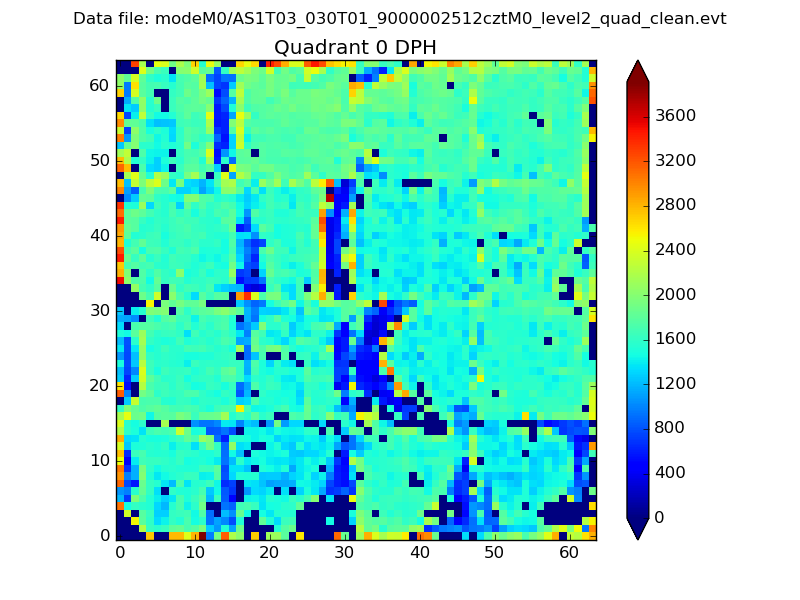 |
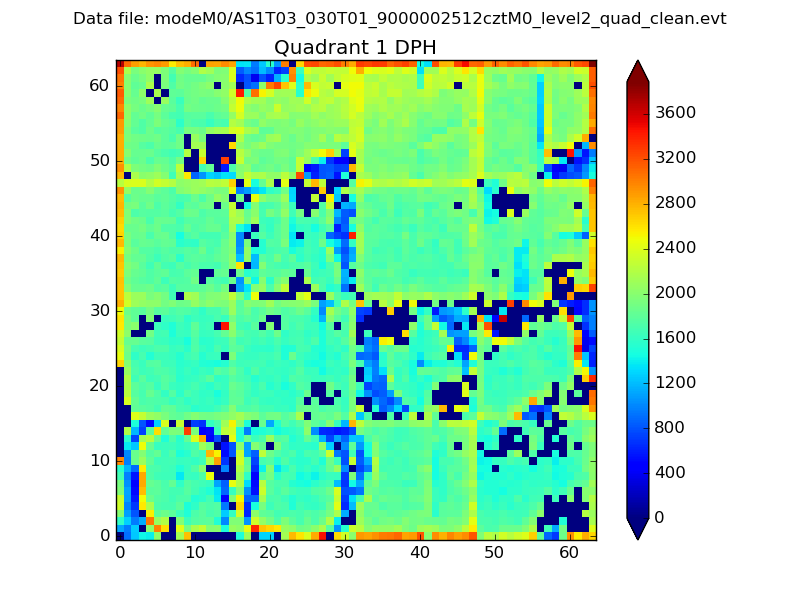 |
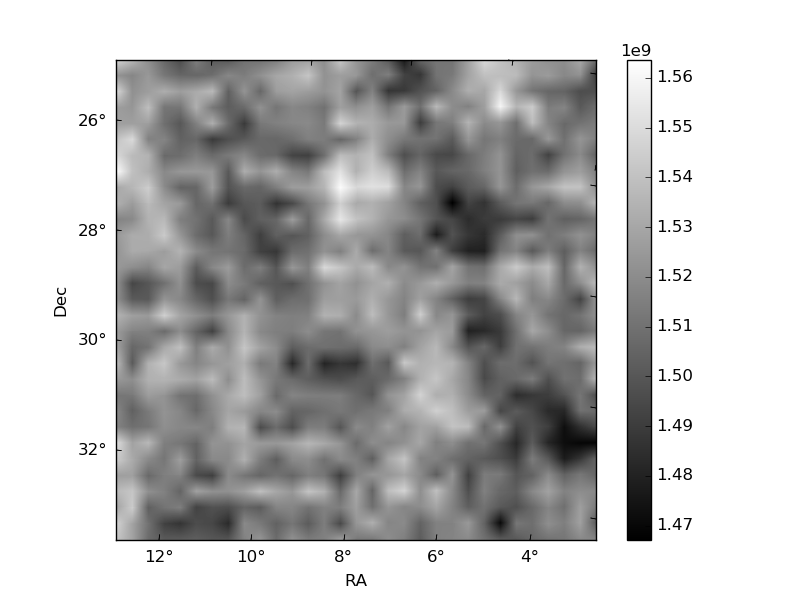
Quadrant B |
|---|---|---|---|
| Quadrant D | 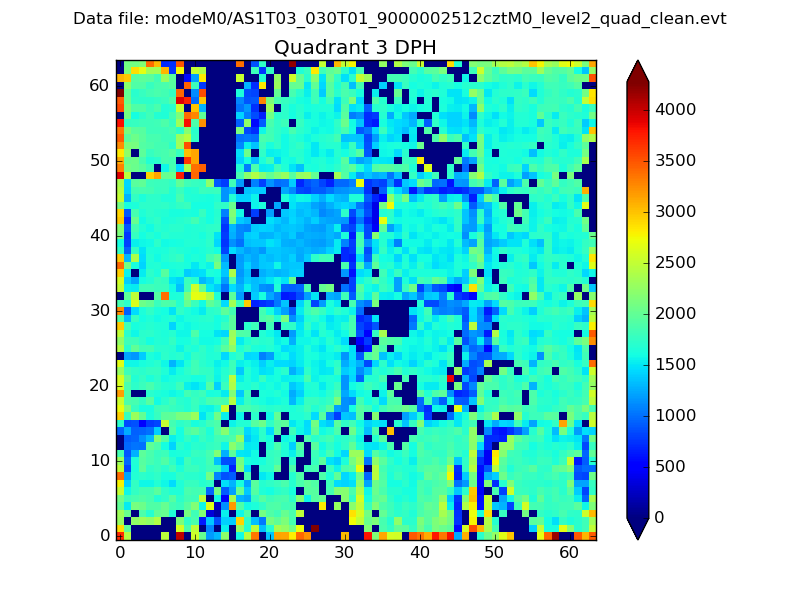 |
 |
Quadrant C |
| Plot type | Count rate plots | Images |
|---|---|---|
| Comparison with Poisson distribution Blue bars denote a histogram of data divided into 1 sec bins. Red curve is a Poisson curve with rate = median count rate of data. |
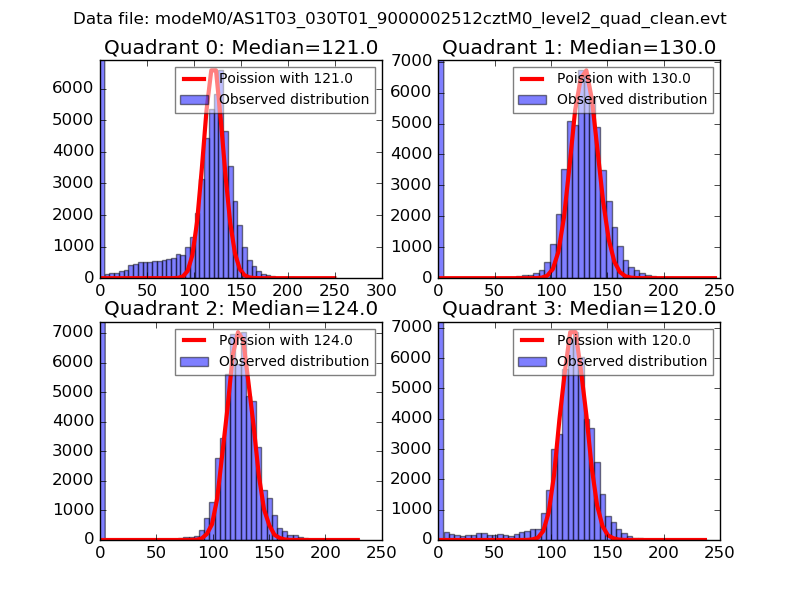 |
 |
| Quadrant-wise count rates Data is divided into 100 sec bins |
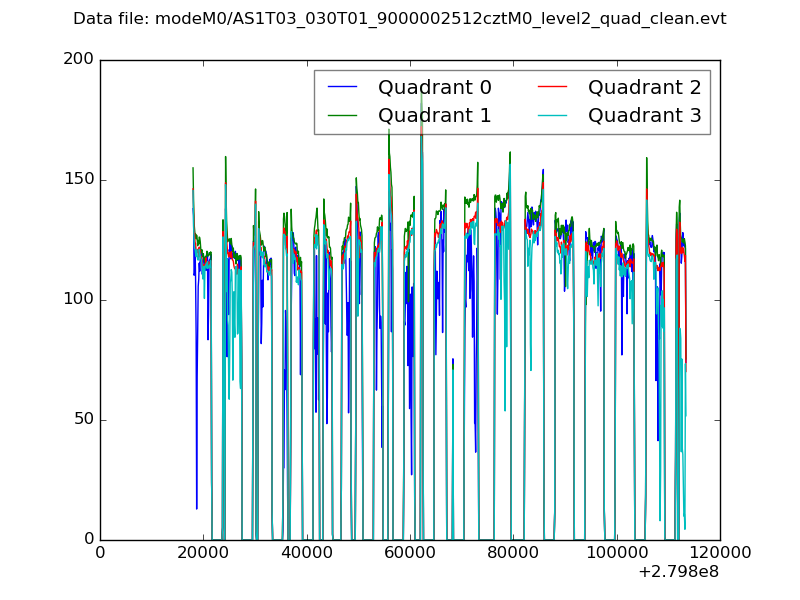 |
|
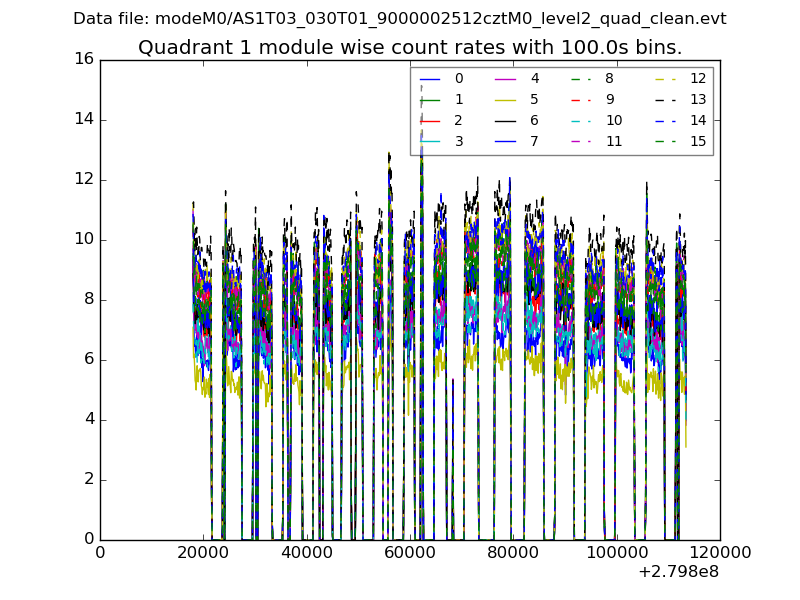
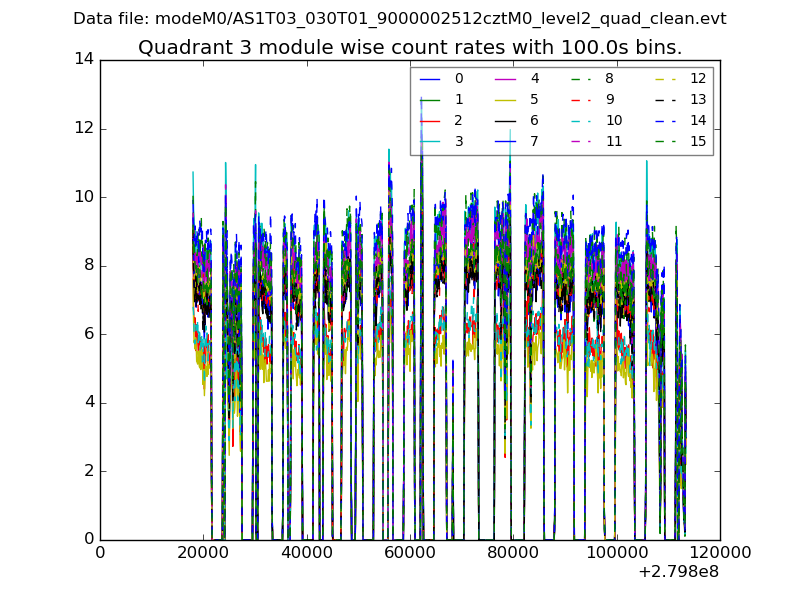
| Module-wise count rates for Quadrant A Data is divided into 100 sec bins |
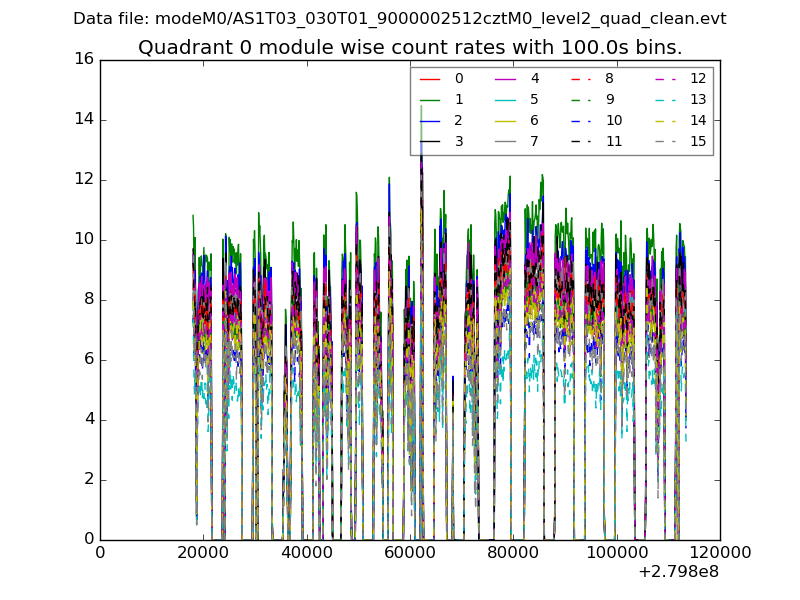 |
 |
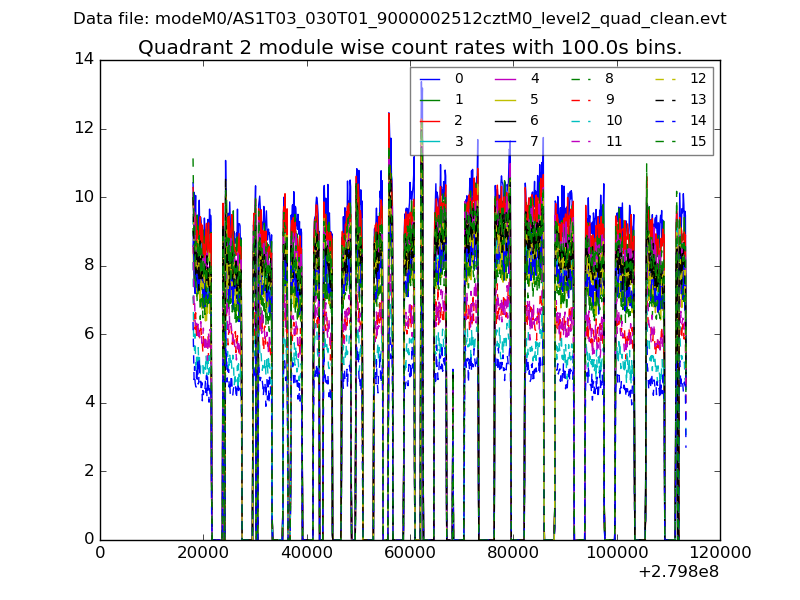
| Module-wise count rates for Quadrant B Data is divided into 100 sec bins |
 |
 |
| Module-wise count rates for Quadrant C Data is divided into 100 sec bins |
 |
 |
| Module-wise count rates for Quadrant D Data is divided into 100 sec bins |
 |
 |
| Parameter | Plot |
|---|---|
| CZT HV Monitor | 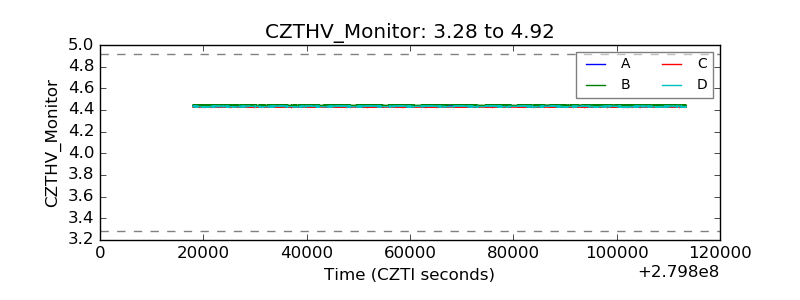 |
| D_VDD | 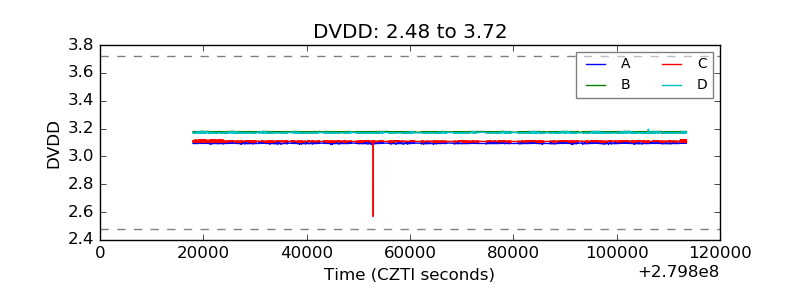 |
| Temperature 1 | 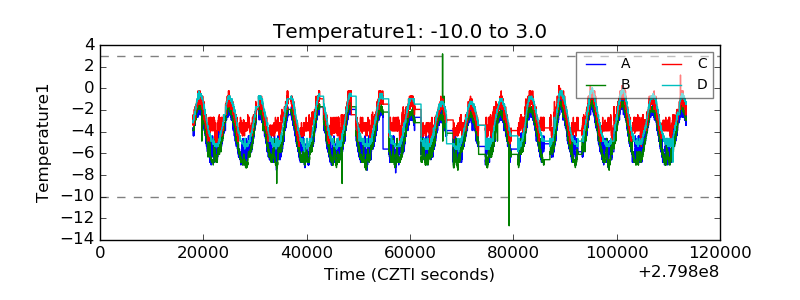 |
| Veto HV Monitor | 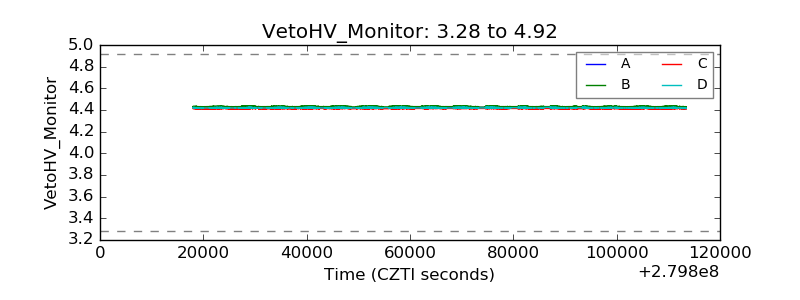 |
| Veto LLD | 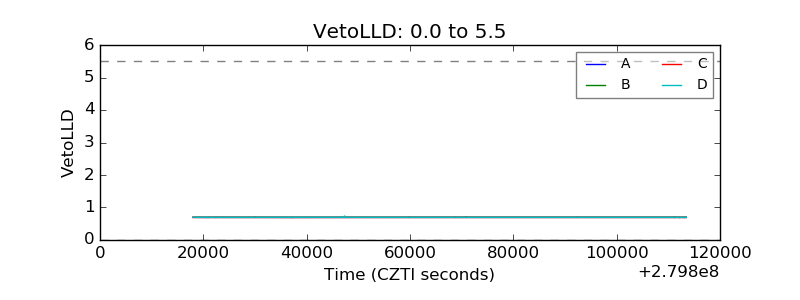 |
| Alpha Counter | 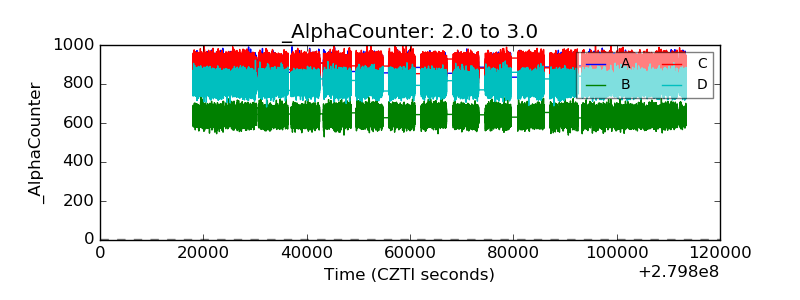 |
| _CPM_Rate | 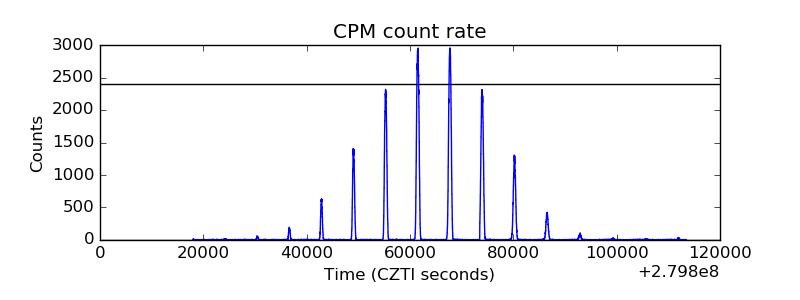 |
| CZT Counter | 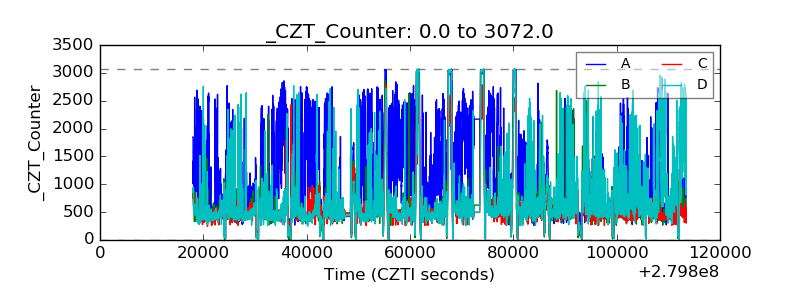 |
| +2.5 Volts monitor | 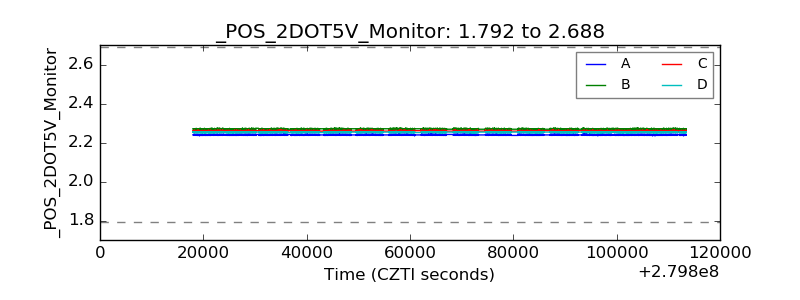 |
| +5 Volts monitor | 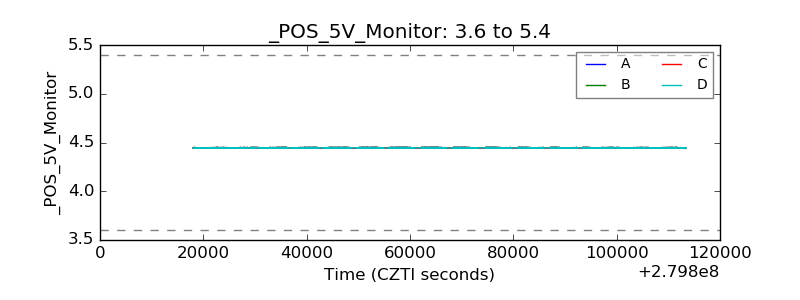 |
| _ROLL_ROT | 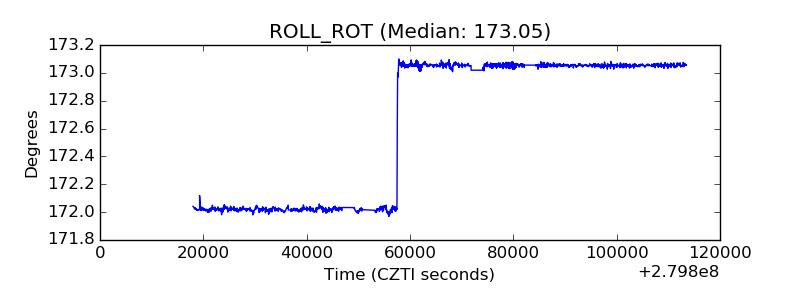 |
| _Roll_DEC | 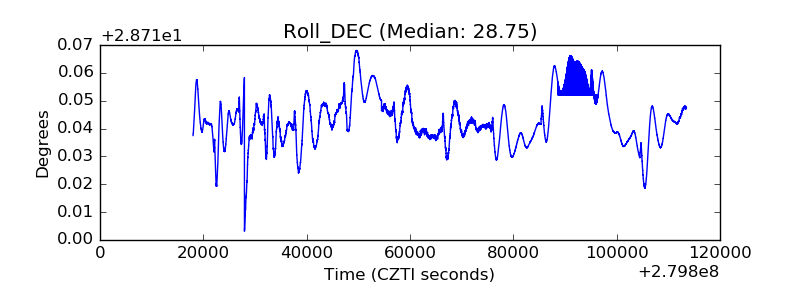 |
| _Roll_RA | 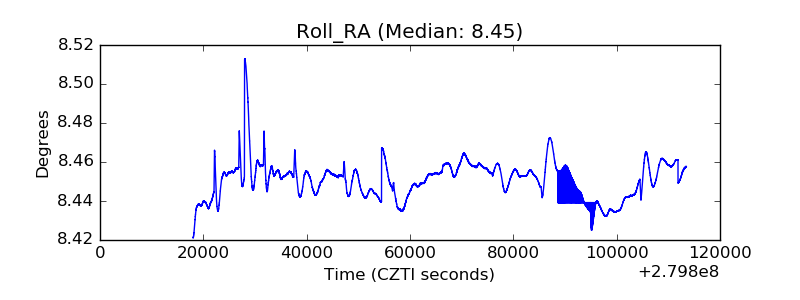 |
| Veto Counter | 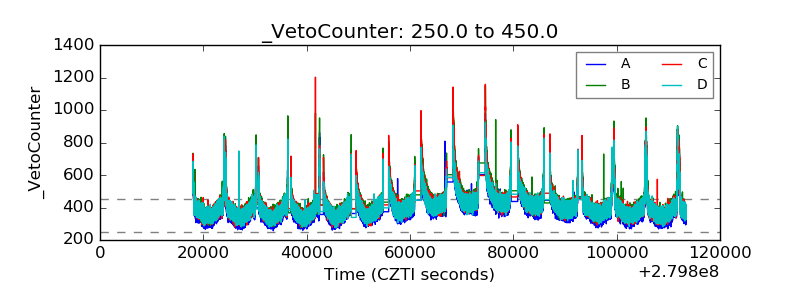 |