| Param | Original file | Final file |
|---|---|---|
| Filename | modeM0/AS1T03_030T01_9000002512_16914cztM0_level2.evt | modeM0/AS1T03_030T01_9000002512_16914cztM0_level2_quad_clean.evt |
| Size (bytes) | 1,763,029,440 | 230,639,040 |
| Size | 1.6 GB | 220.0 MB |
| Events in quadrant A | 22,577,501 | 1,309,689 |
| Events in quadrant B | 9,133,081 | 1,532,698 |
| Events in quadrant C | 9,376,027 | 1,465,032 |
| Events in quadrant D | 11,041,969 | 1,384,029 |
| Mode M9 | |||
|---|---|---|---|
| Quadrant | BADHDUFLAG | Total packets | Discarded packets |
| A | 0 | 17 | 0 |
| B | 0 | 18 | 0 |
| C | 0 | 18 | 0 |
| D | 0 | 18 | 0 |
| Mode M0 | |||
|---|---|---|---|
| Quadrant | BADHDUFLAG | Total packets | Discarded packets |
| A | 0 | 80177 | 4 |
| B | 0 | 39557 | 4 |
| C | 0 | 40016 | 4 |
| D | 0 | 45745 | 4 |
| Mode SS | |||
|---|---|---|---|
| Quadrant | BADHDUFLAG | Total packets | Discarded packets |
| A | 0 | 384 | 0 |
| B | 0 | 384 | 0 |
| C | 0 | 384 | 0 |
| D | 0 | 384 | 0 |
| Quadrant | Total seconds | Saturated seconds | Saturation percentage |
|---|---|---|---|
| A | 18739 | 5613 | 29.953573% |
| B | 18739 | 219 | 1.168686% |
| C | 18739 | 239 | 1.275415% |
| D | 18739 | 1070 | 5.710017% |
Noise dominated data is calculated using 1-second bins in cleaned event files. If a bin has >2000 counts, and if more than 50% of those come from <1% of pixels, then it is considered to be noise-dominated and hence unusable.
| Quadrant | # 1 sec bins | Bins with >0 counts | Bins with >2000 counts | High rate bins dominated by noise | Noise dominated (total time) | Noise dominated (detector-on time) | Marked lightcurve |
|---|---|---|---|---|---|---|---|
| A | 20570 | 18742 | 3794 | 3794 | 18.44% | 20.24% | 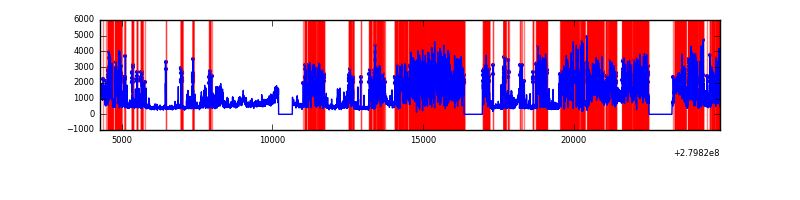 |
| B | 20570 | 18743 | 5 | 5 | 0.02% | 0.03% |  |
| C | 20570 | 18743 | 4 | 4 | 0.02% | 0.02% | 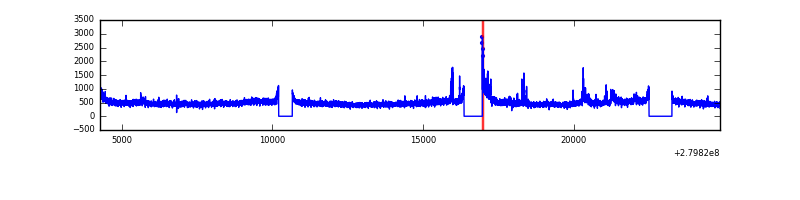 |
| D | 20570 | 18743 | 423 | 423 | 2.06% | 2.26% | 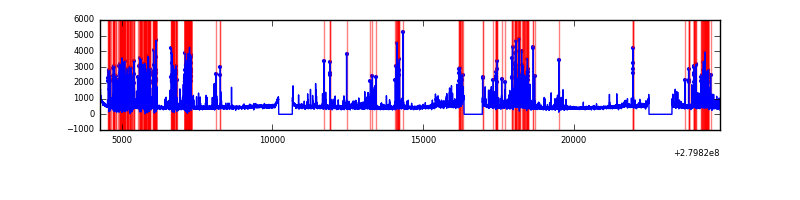 |
Top three noisy pixels from each quadrant. If the there are fewer than three noisy pixels in the level2.evt file, extra rows are filled as -1
| Pixel properties | Quadrant properties | ||||||
|---|---|---|---|---|---|---|---|
| Quadrant | DetID | PixID | Counts | Sigma | Mean | Median | Sigma |
| A | 15 | 174 | 15023055 | 38337.14 | 1931 | 1887 | 391.8 |
| A | 12 | 189 | 95731 | 239.51 | 1931 | 1887 | 391.8 |
| A | 13 | 228 | 27600 | 65.62 | 1931 | 1887 | 391.8 |
| B | 15 | 35 | 228975 | 533.25 | 2222 | 2161 | 425.3 |
| B | 0 | 197 | 58041 | 131.38 | 2222 | 2161 | 425.3 |
| B | 12 | 111 | 50943 | 114.69 | 2222 | 2161 | 425.3 |
| C | 3 | 233 | 735896 | 1467.86 | 2130 | 2142 | 499.9 |
| C | 14 | 238 | 325350 | 646.57 | 2130 | 2142 | 499.9 |
| C | 13 | 61 | 15145 | 26.01 | 2130 | 2142 | 499.9 |
| D | 1 | 52 | 2561279 | 4980.35 | 2110 | 2053 | 513.9 |
| D | 12 | 235 | 181753 | 349.7 | 2110 | 2053 | 513.9 |
| D | 10 | 199 | 108739 | 207.61 | 2110 | 2053 | 513.9 |
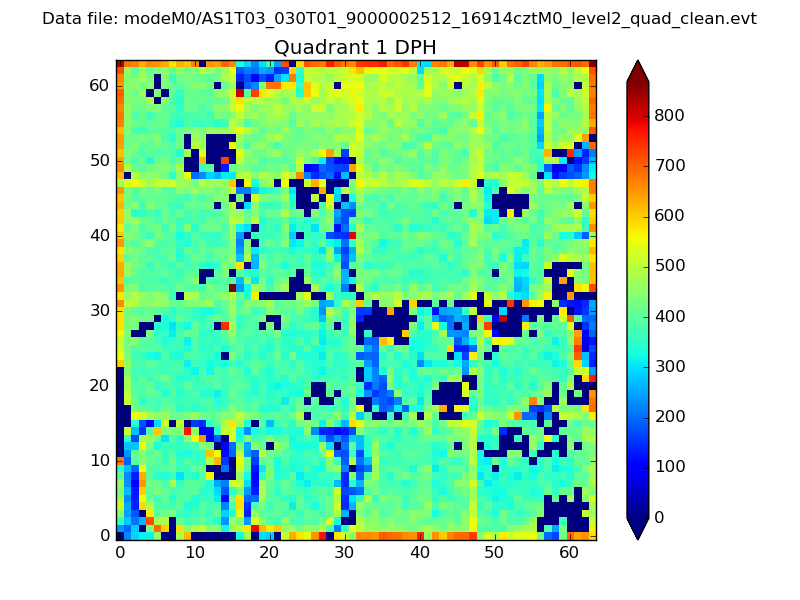
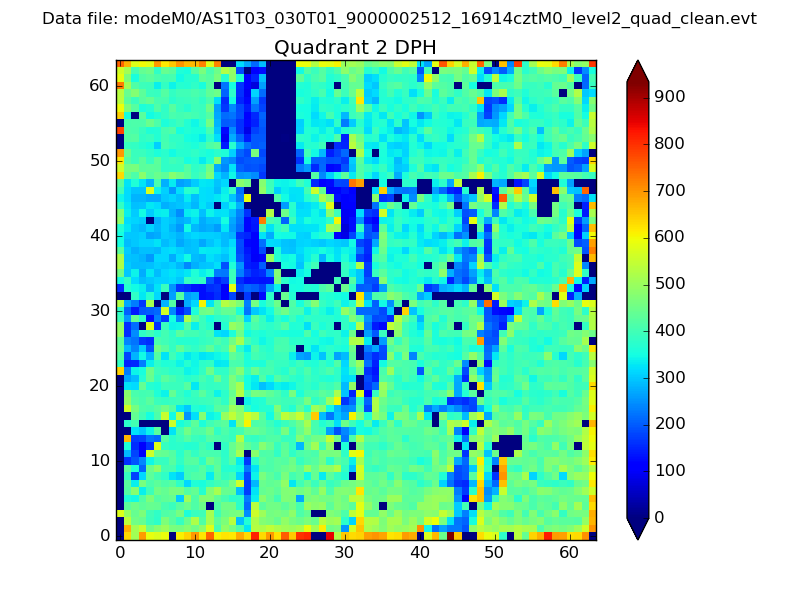
Histogram calculated using DETX and DETY for each event in the final _common_clean file
| Quadrant A | 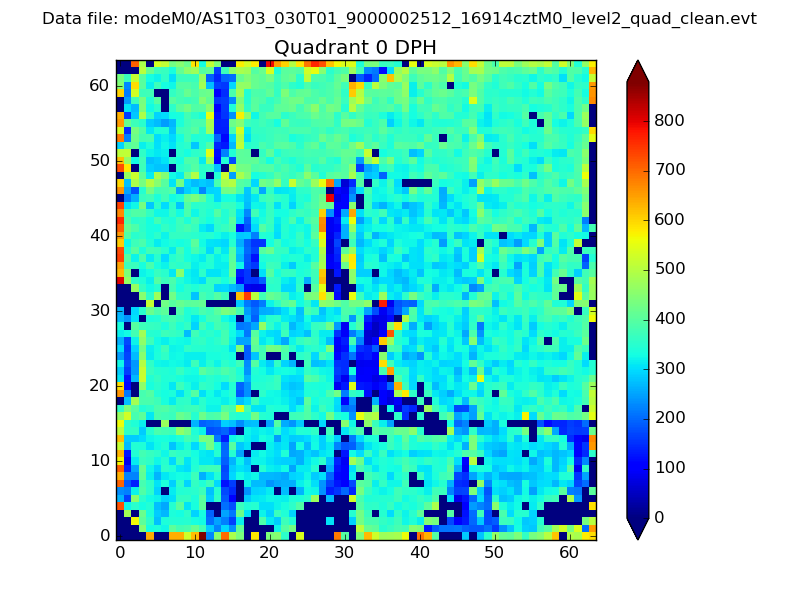 |
 |
Quadrant B |
|---|---|---|---|
| Quadrant D |  |
 |
Quadrant C |
| Plot type | Count rate plots | Images |
|---|---|---|
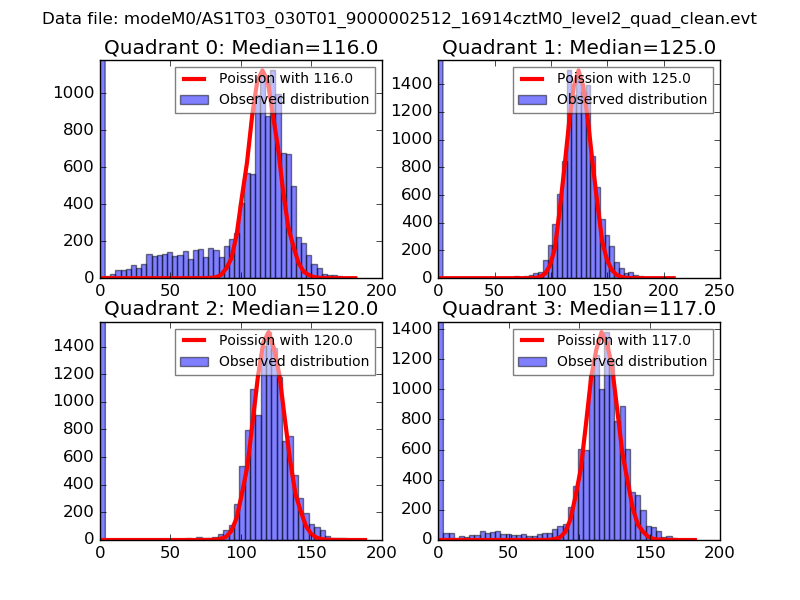
| Comparison with Poisson distribution Blue bars denote a histogram of data divided into 1 sec bins. Red curve is a Poisson curve with rate = median count rate of data. |
 |
 |
| Quadrant-wise count rates Data is divided into 100 sec bins |
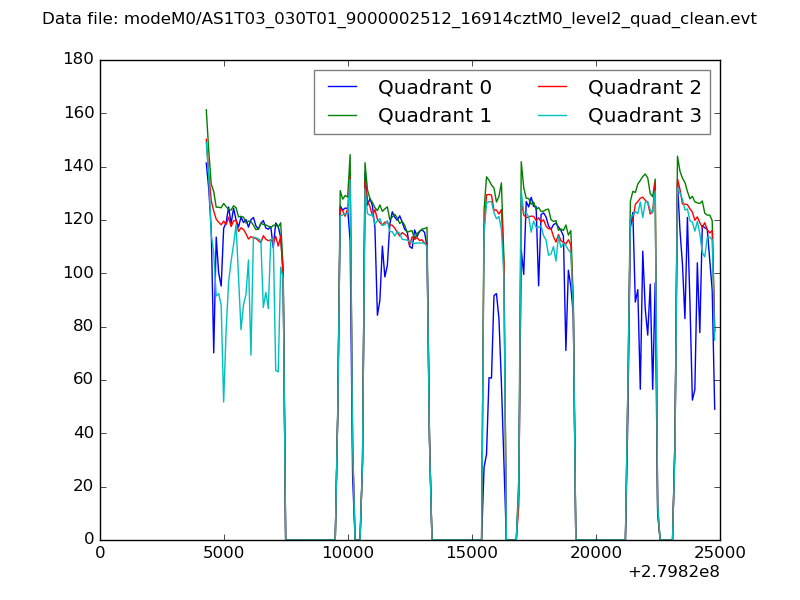 |
|
| Module-wise count rates for Quadrant A Data is divided into 100 sec bins |
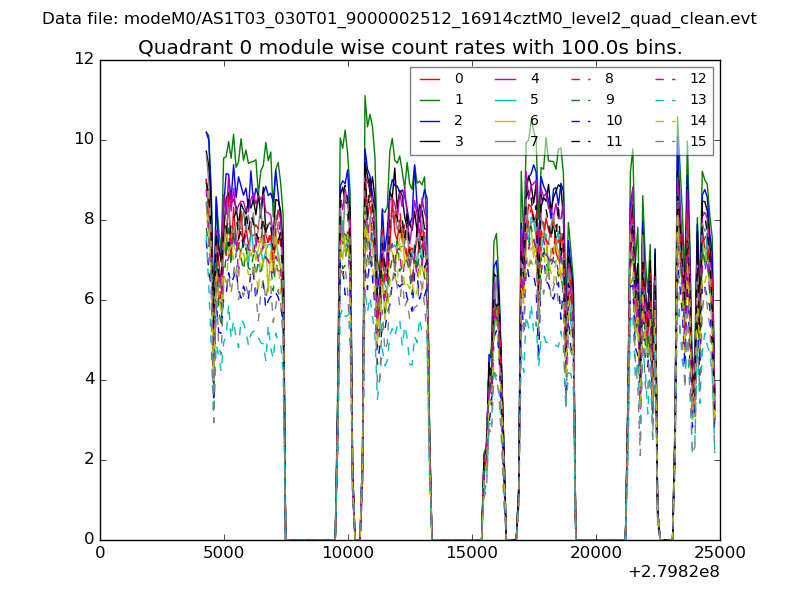 |
 |
| Module-wise count rates for Quadrant B Data is divided into 100 sec bins |
 |
 |
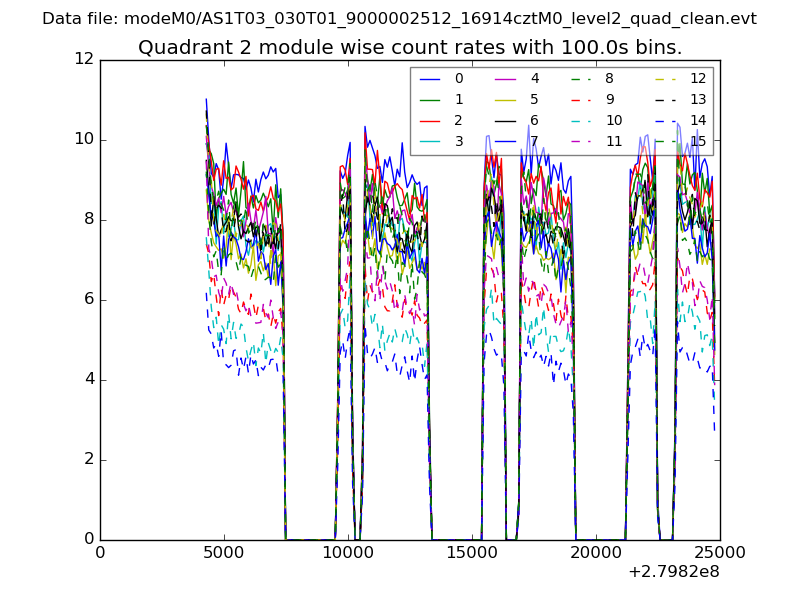
| Module-wise count rates for Quadrant C Data is divided into 100 sec bins |
 |
 |
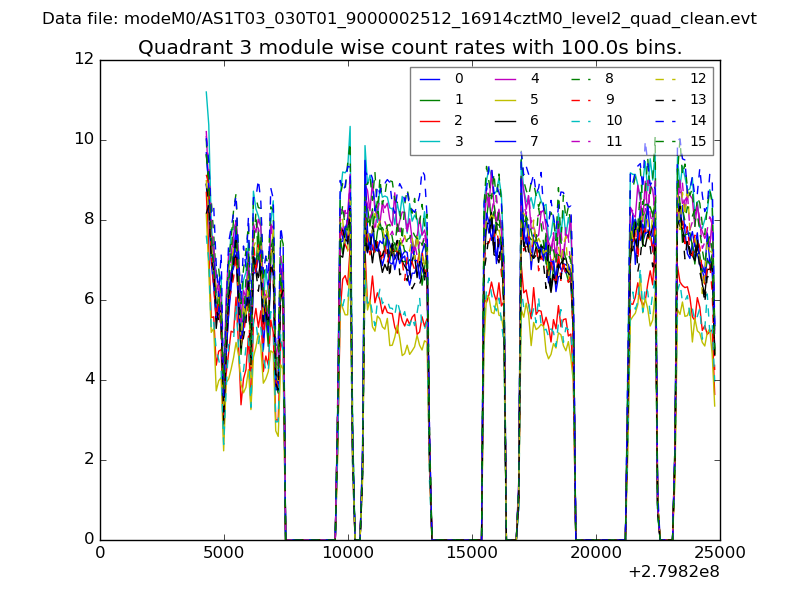
| Module-wise count rates for Quadrant D Data is divided into 100 sec bins |
 |
 |
| Parameter | Plot |
|---|---|
| CZT HV Monitor | 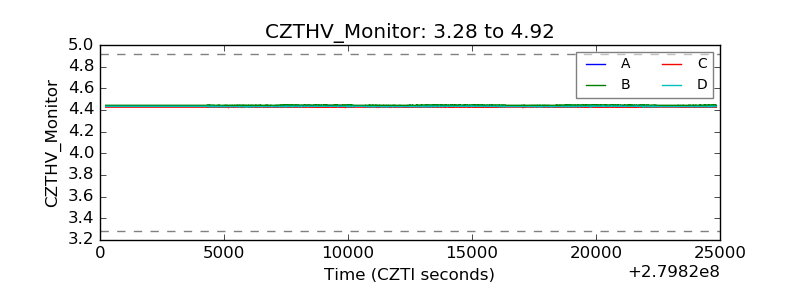 |
| D_VDD | 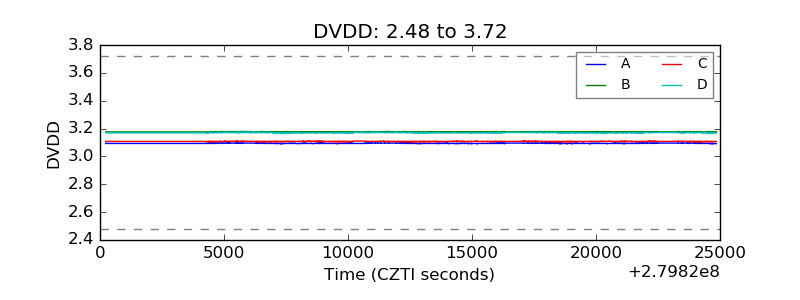 |
| Temperature 1 | 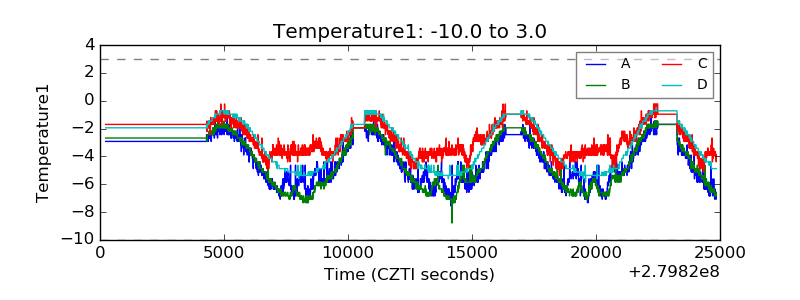 |
| Veto HV Monitor | 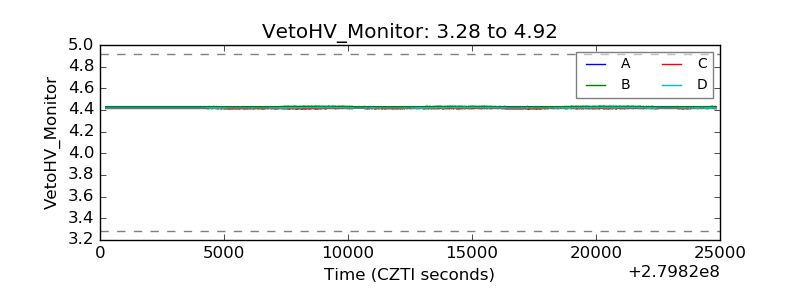 |
| Veto LLD |  |
| Alpha Counter | 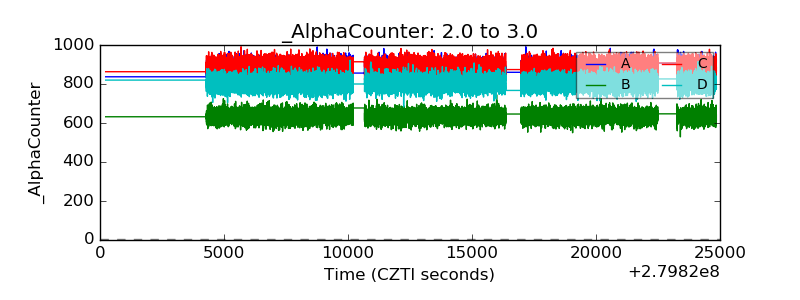 |
| _CPM_Rate | 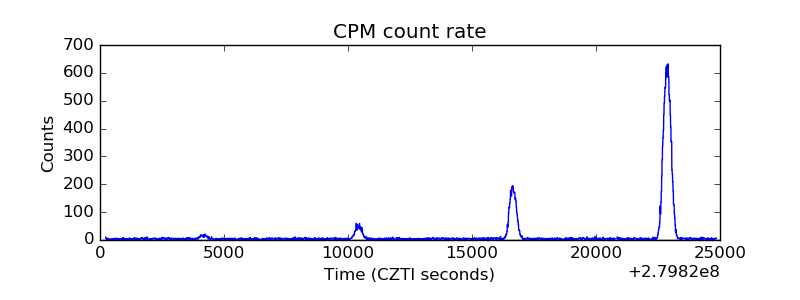 |
| CZT Counter | 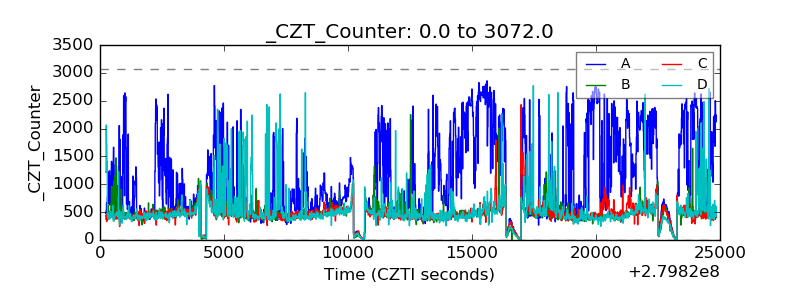 |
| +2.5 Volts monitor |  |
| +5 Volts monitor | 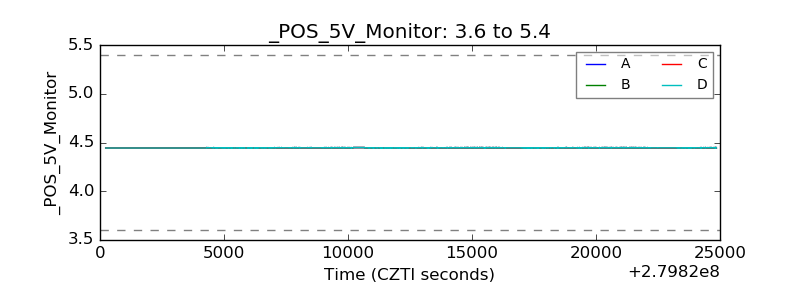 |
| _ROLL_ROT | 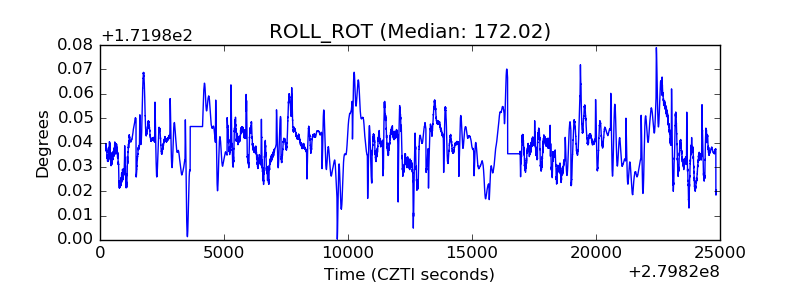 |
| _Roll_DEC | 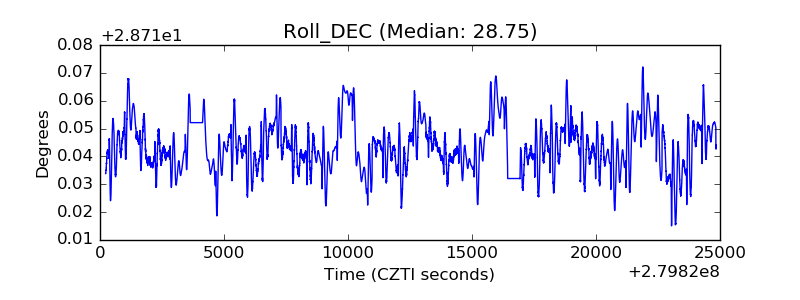 |
| _Roll_RA | 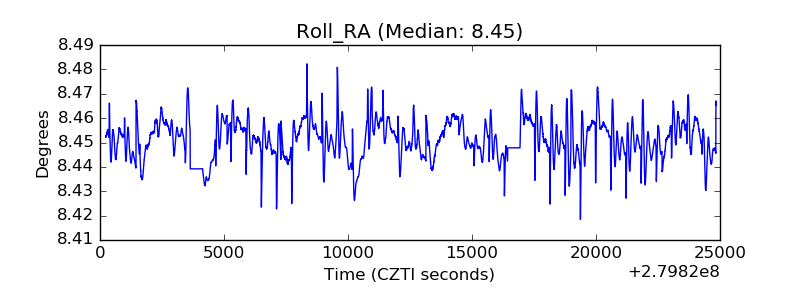 |
| Veto Counter | 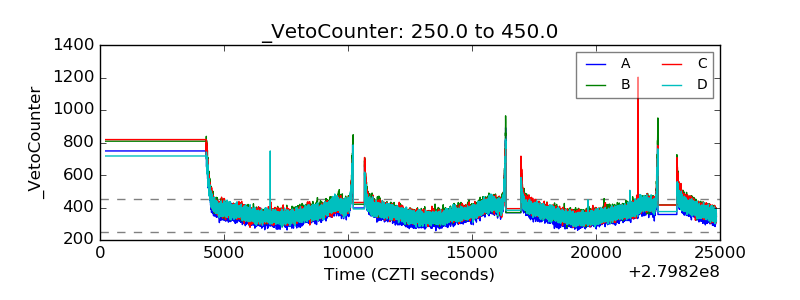 |