| Param | Original file | Final file |
|---|---|---|
| Filename | modeM0/AS1T03_030T01_9000002512_16915cztM0_level2.evt | modeM0/AS1T03_030T01_9000002512_16915cztM0_level2_quad_clean.evt |
| Size (bytes) | 623,586,240 | 42,442,560 |
| Size | 594.7 MB | 40.5 MB |
| Events in quadrant A | 7,839,480 | 171,484 |
| Events in quadrant B | 3,256,979 | 223,716 |
| Events in quadrant C | 3,159,116 | 212,701 |
| Events in quadrant D | 4,173,901 | 207,394 |
| Mode M9 | |||
|---|---|---|---|
| Quadrant | BADHDUFLAG | Total packets | Discarded packets |
| A | 0 | 15 | 0 |
| B | 0 | 16 | 0 |
| C | 0 | 16 | 0 |
| D | 0 | 16 | 0 |
| Mode M0 | |||
|---|---|---|---|
| Quadrant | BADHDUFLAG | Total packets | Discarded packets |
| A | 0 | 27970 | 2 |
| B | 0 | 14078 | 2 |
| C | 0 | 13703 | 2 |
| D | 0 | 17053 | 2 |
| Mode SS | |||
|---|---|---|---|
| Quadrant | BADHDUFLAG | Total packets | Discarded packets |
| A | 0 | 140 | 0 |
| B | 0 | 140 | 0 |
| C | 0 | 140 | 0 |
| D | 0 | 140 | 0 |
| Quadrant | Total seconds | Saturated seconds | Saturation percentage |
|---|---|---|---|
| A | 6719 | 1930 | 28.724513% |
| B | 6719 | 55 | 0.818574% |
| C | 6719 | 56 | 0.833457% |
| D | 6718 | 244 | 3.632033% |
Noise dominated data is calculated using 1-second bins in cleaned event files. If a bin has >2000 counts, and if more than 50% of those come from <1% of pixels, then it is considered to be noise-dominated and hence unusable.
| Quadrant | # 1 sec bins | Bins with >0 counts | Bins with >2000 counts | High rate bins dominated by noise | Noise dominated (total time) | Noise dominated (detector-on time) | Marked lightcurve |
|---|---|---|---|---|---|---|---|
| A | 7660 | 6721 | 1313 | 1313 | 17.14% | 19.54% | 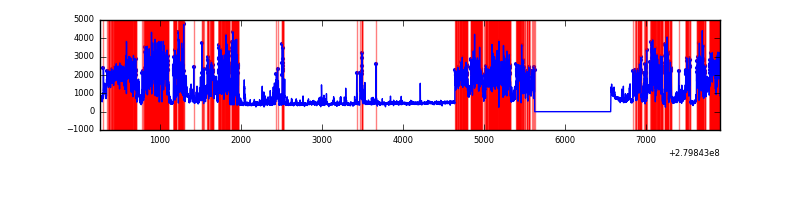 |
| B | 7660 | 6721 | 5 | 5 | 0.07% | 0.07% | 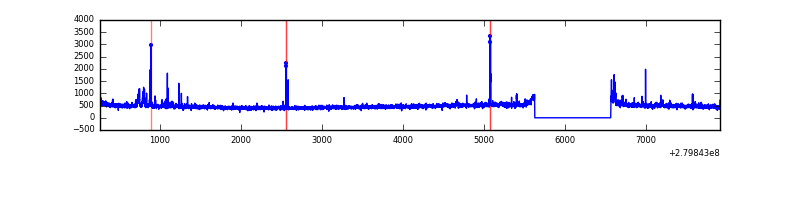 |
| C | 7660 | 6721 | 0 | 0 | 0.00% | 0.00% | 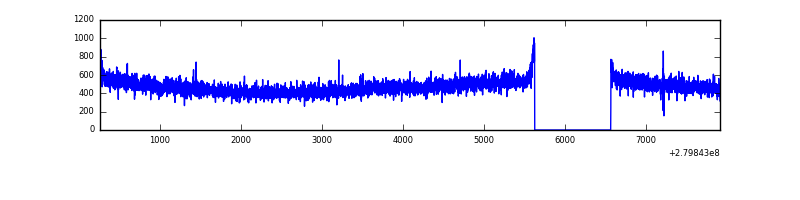 |
| D | 7659 | 6720 | 196 | 196 | 2.56% | 2.92% | 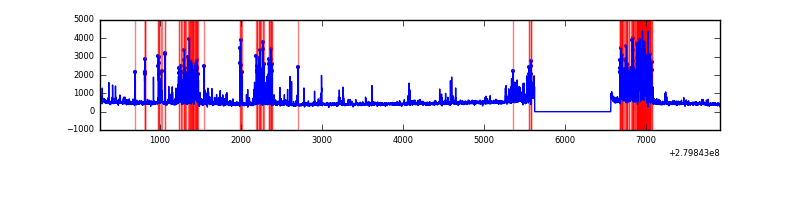 |
Top three noisy pixels from each quadrant. If the there are fewer than three noisy pixels in the level2.evt file, extra rows are filled as -1
| Pixel properties | Quadrant properties | ||||||
|---|---|---|---|---|---|---|---|
| Quadrant | DetID | PixID | Counts | Sigma | Mean | Median | Sigma |
| A | 15 | 174 | 5072054 | 35404.47 | 706 | 691 | 143.2 |
| A | 12 | 189 | 36479 | 249.85 | 706 | 691 | 143.2 |
| A | 15 | 190 | 9705 | 62.93 | 706 | 691 | 143.2 |
| B | 15 | 35 | 98104 | 640.71 | 796 | 775 | 151.9 |
| B | 0 | 197 | 24467 | 155.96 | 796 | 775 | 151.9 |
| B | 12 | 111 | 18156 | 114.42 | 796 | 775 | 151.9 |
| C | 14 | 238 | 119532 | 663.27 | 765 | 769 | 179.1 |
| C | 3 | 233 | 48406 | 266.04 | 765 | 769 | 179.1 |
| C | 0 | 207 | 6690 | 33.07 | 765 | 769 | 179.1 |
| D | 1 | 52 | 1205273 | 6448.85 | 765 | 745 | 186.8 |
| D | 2 | 234 | 27482 | 143.15 | 765 | 745 | 186.8 |
| D | 2 | 152 | 27029 | 140.72 | 765 | 745 | 186.8 |
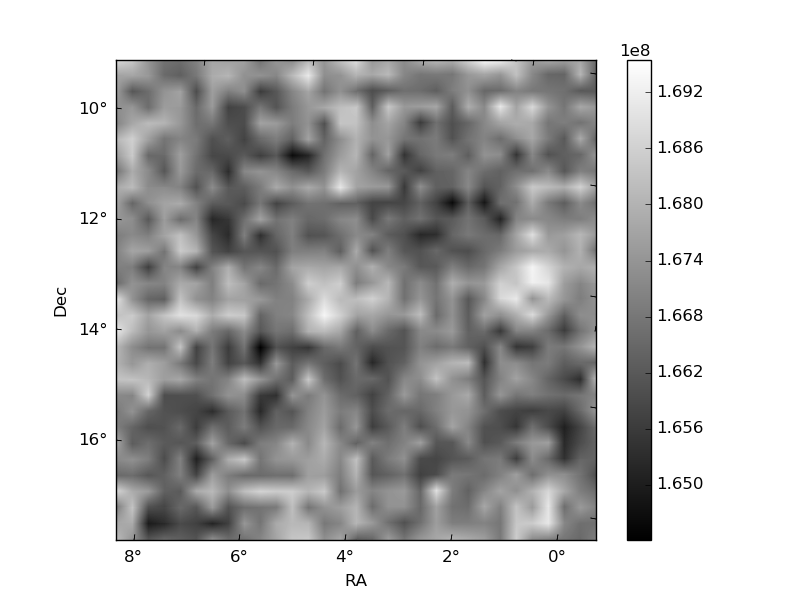
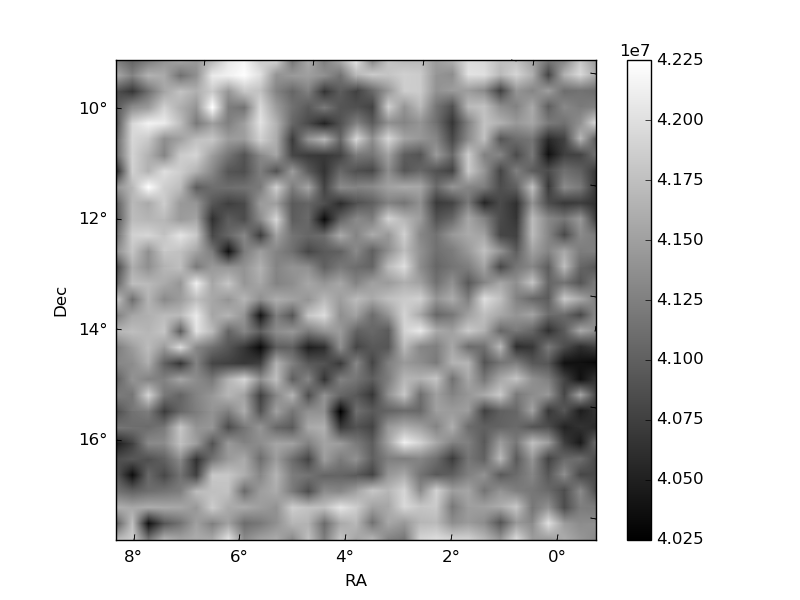
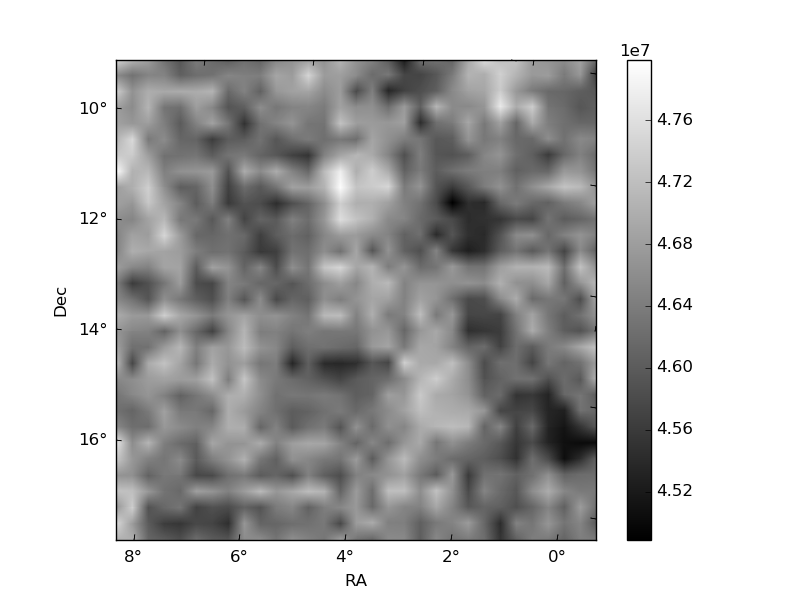
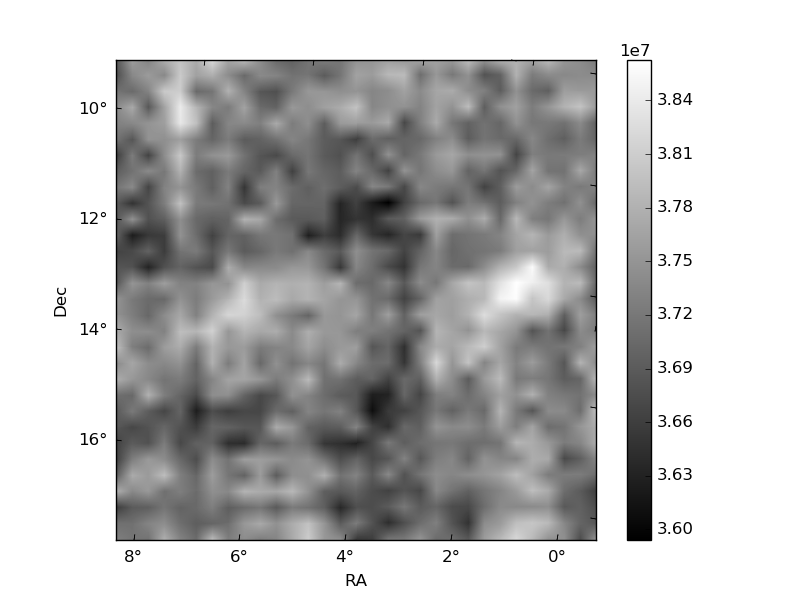
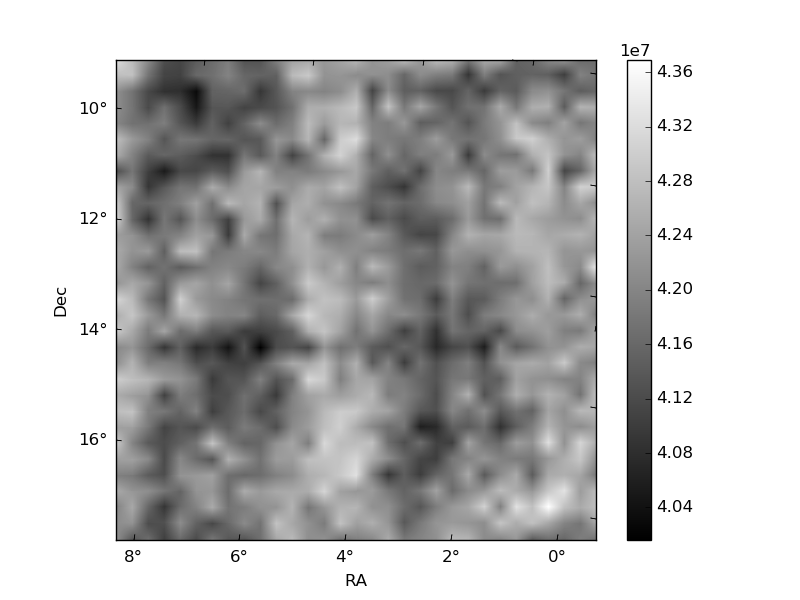
Histogram calculated using DETX and DETY for each event in the final _common_clean file
| Quadrant A | 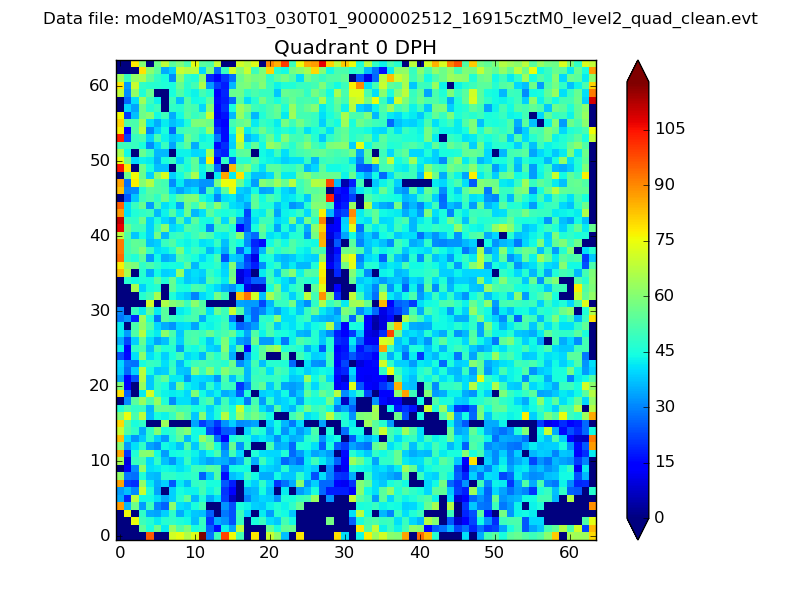 |
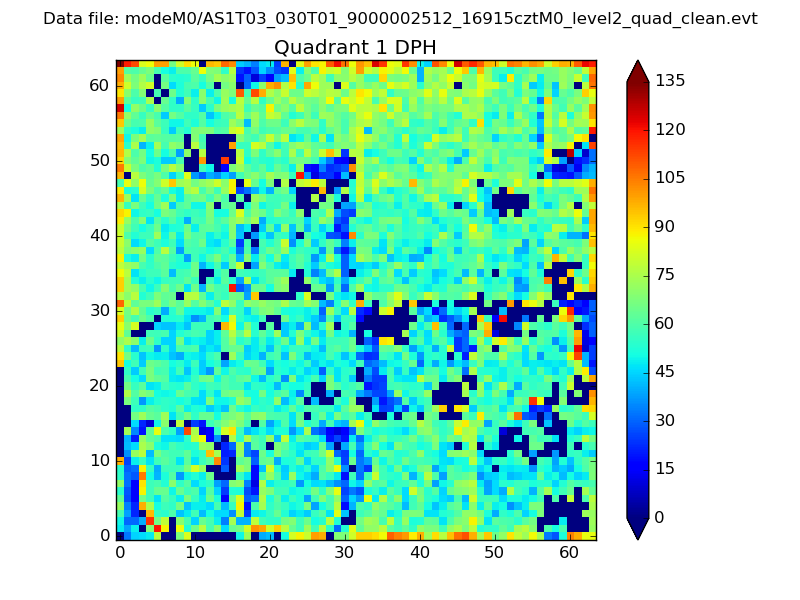 |
Quadrant B |
|---|---|---|---|
| Quadrant D |  |
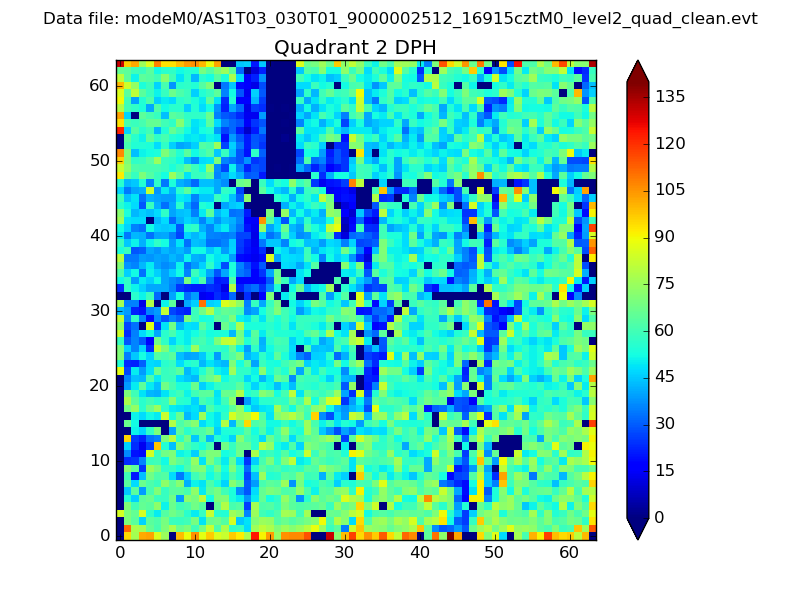 |
Quadrant C |
| Plot type | Count rate plots | Images |
|---|---|---|
| Comparison with Poisson distribution Blue bars denote a histogram of data divided into 1 sec bins. Red curve is a Poisson curve with rate = median count rate of data. |
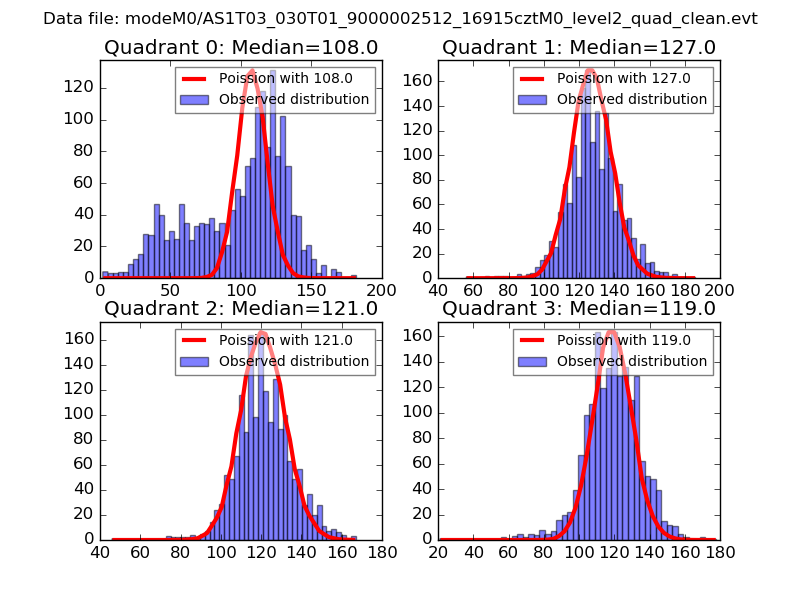 |
 |
| Quadrant-wise count rates Data is divided into 100 sec bins |
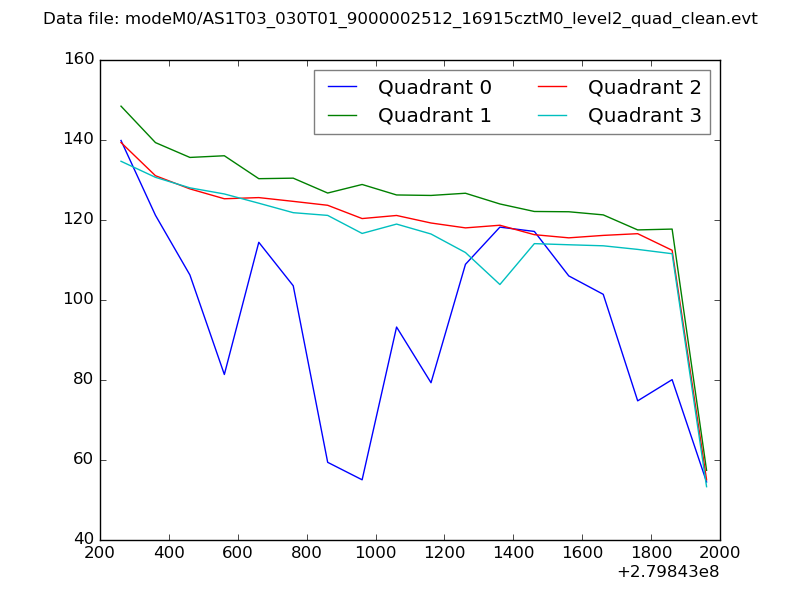 |
|
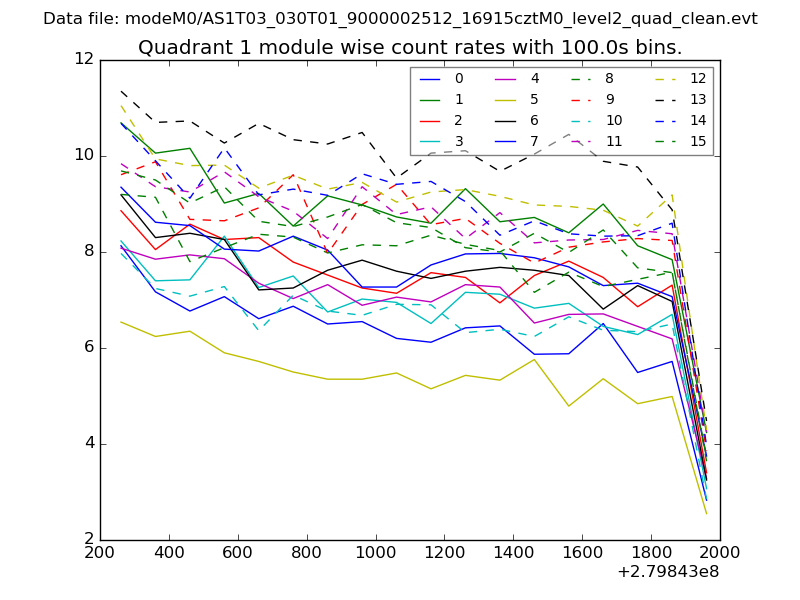
| Module-wise count rates for Quadrant A Data is divided into 100 sec bins |
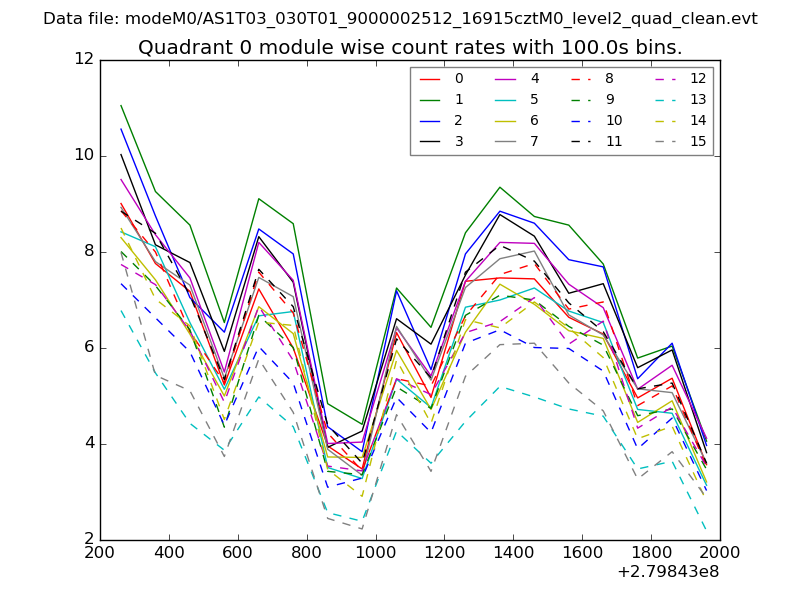 |
 |
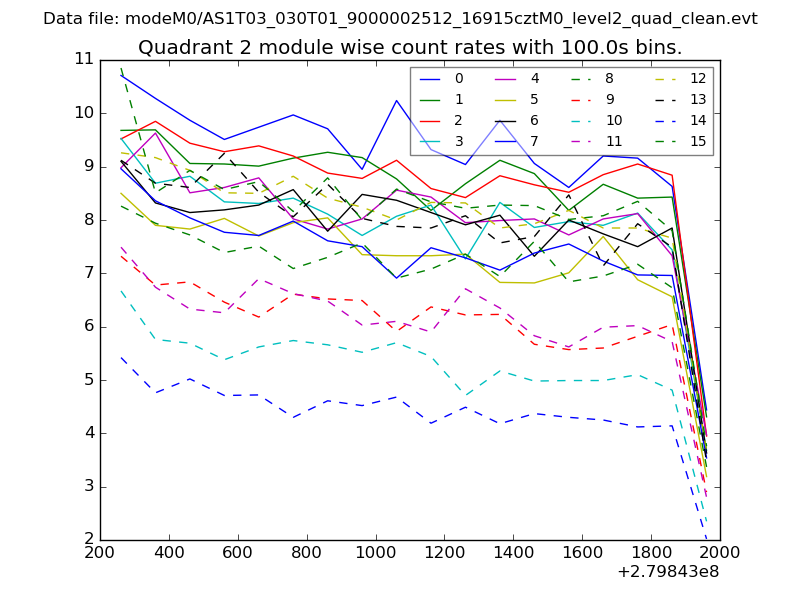
| Module-wise count rates for Quadrant B Data is divided into 100 sec bins |
 |
 |
| Module-wise count rates for Quadrant C Data is divided into 100 sec bins |
 |
 |
| Module-wise count rates for Quadrant D Data is divided into 100 sec bins |
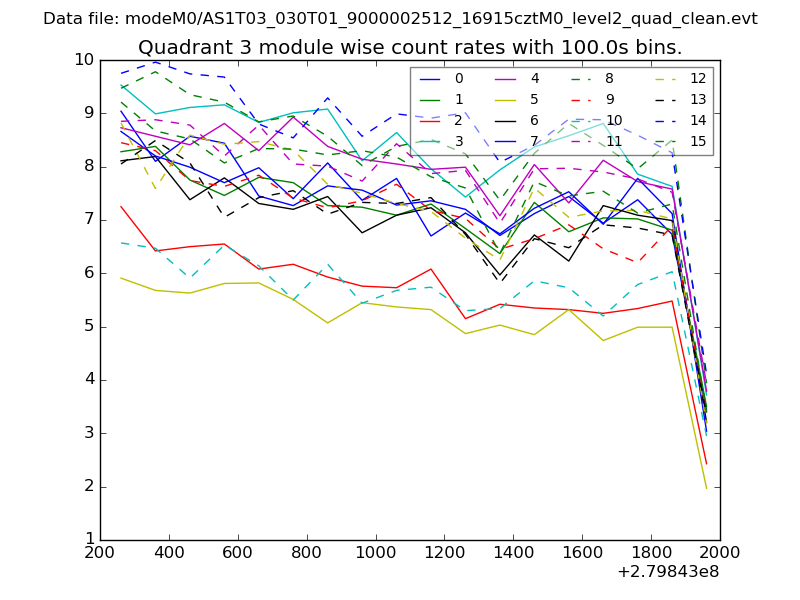 |
 |
| Parameter | Plot |
|---|---|
| CZT HV Monitor | 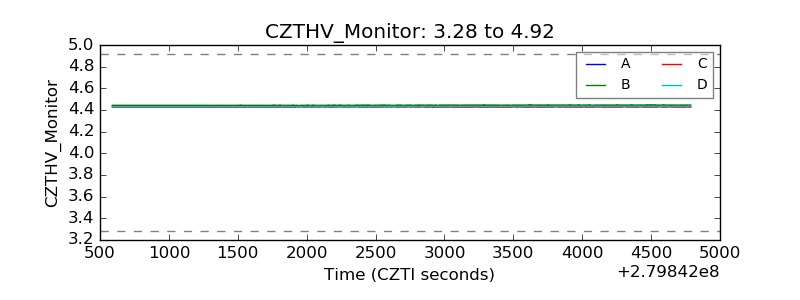 |
| D_VDD | 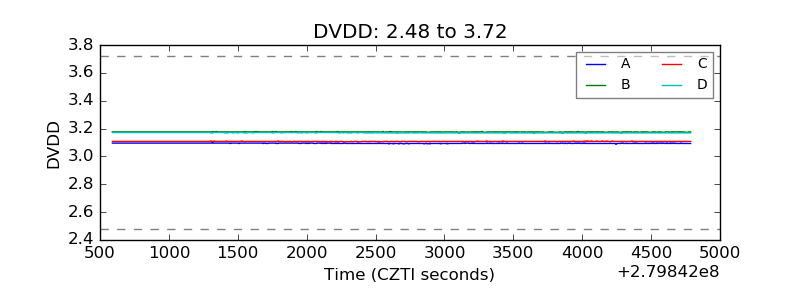 |
| Temperature 1 | 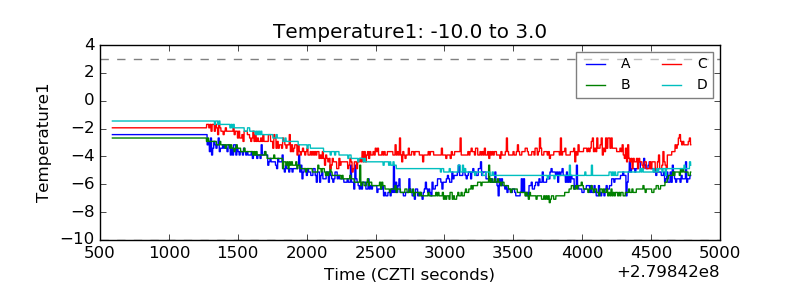 |
| Veto HV Monitor | 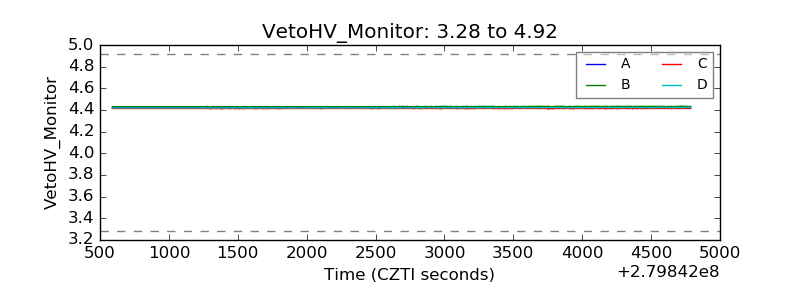 |
| Veto LLD | 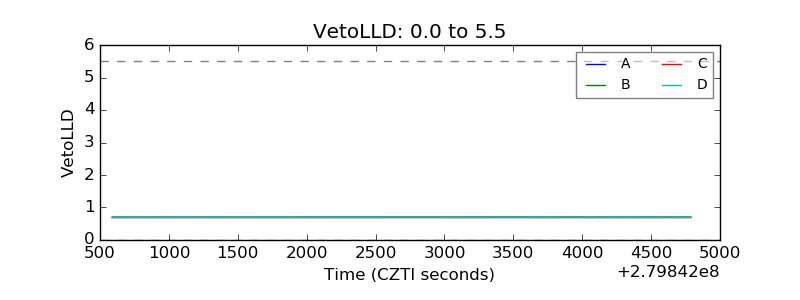 |
| Alpha Counter | 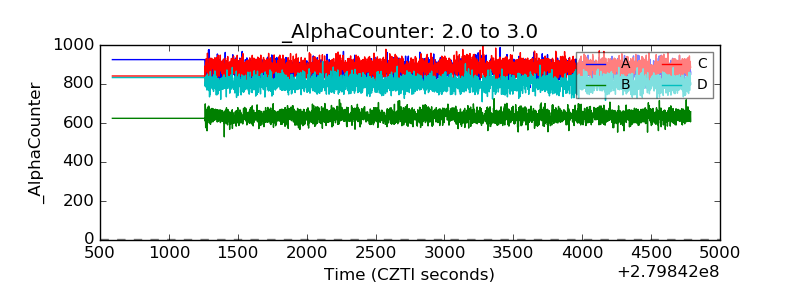 |
| _CPM_Rate | 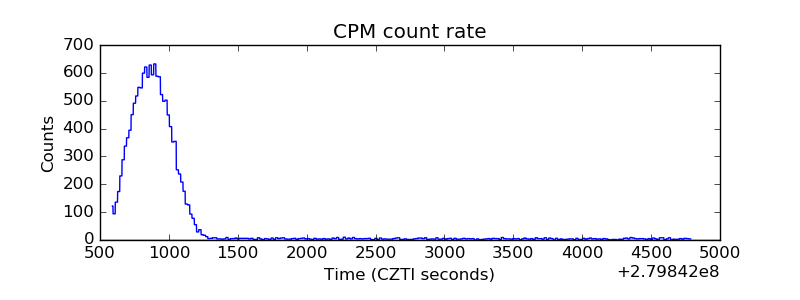 |
| CZT Counter | 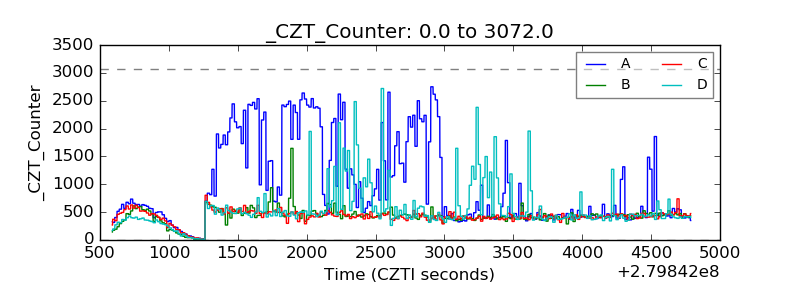 |
| +2.5 Volts monitor |  |
| +5 Volts monitor |  |
| _ROLL_ROT | 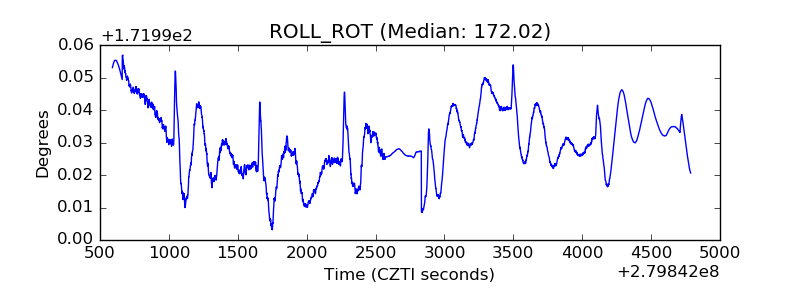 |
| _Roll_DEC | 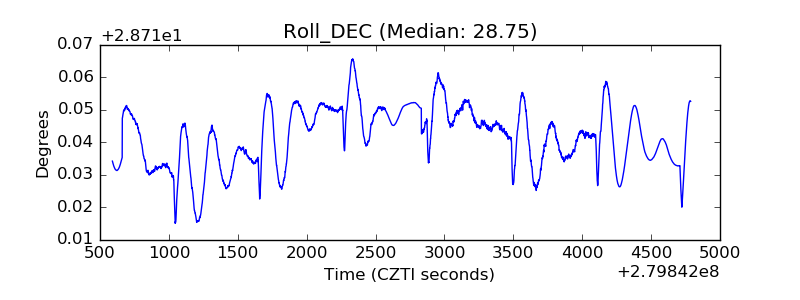 |
| _Roll_RA | 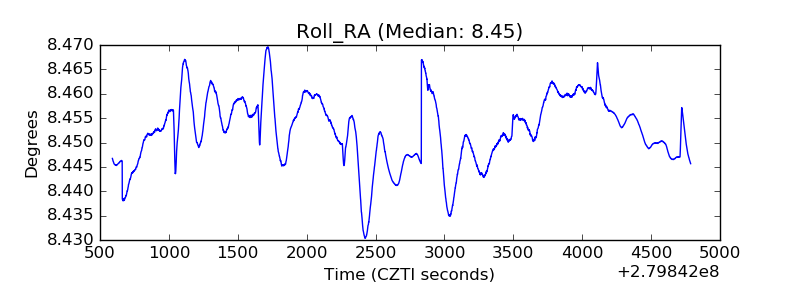 |
| Veto Counter |  |