| Param | Original file | Final file |
|---|---|---|
| Filename | modeM0/AS1T03_030T01_9000002512_16916cztM0_level2.evt | modeM0/AS1T03_030T01_9000002512_16916cztM0_level2_quad_clean.evt |
| Size (bytes) | 668,980,800 | 79,560,000 |
| Size | 638.0 MB | 75.9 MB |
| Events in quadrant A | 9,357,616 | 431,997 |
| Events in quadrant B | 3,187,602 | 534,099 |
| Events in quadrant C | 3,214,968 | 502,622 |
| Events in quadrant D | 4,059,005 | 485,628 |
| Mode M9 | |||
|---|---|---|---|
| Quadrant | BADHDUFLAG | Total packets | Discarded packets |
| A | 0 | 15 | 0 |
| B | 0 | 16 | 0 |
| C | 0 | 16 | 0 |
| D | 0 | 16 | 0 |
| Mode M0 | |||
|---|---|---|---|
| Quadrant | BADHDUFLAG | Total packets | Discarded packets |
| A | 0 | 32248 | 2 |
| B | 0 | 13606 | 2 |
| C | 0 | 13642 | 2 |
| D | 0 | 16523 | 2 |
| Mode SS | |||
|---|---|---|---|
| Quadrant | BADHDUFLAG | Total packets | Discarded packets |
| A | 0 | 132 | 0 |
| B | 0 | 132 | 0 |
| C | 0 | 132 | 0 |
| D | 0 | 132 | 0 |
| Quadrant | Total seconds | Saturated seconds | Saturation percentage |
|---|---|---|---|
| A | 6512 | 2458 | 37.745700% |
| B | 6512 | 42 | 0.644963% |
| C | 6512 | 65 | 0.998157% |
| D | 6512 | 189 | 2.902334% |
Noise dominated data is calculated using 1-second bins in cleaned event files. If a bin has >2000 counts, and if more than 50% of those come from <1% of pixels, then it is considered to be noise-dominated and hence unusable.
| Quadrant | # 1 sec bins | Bins with >0 counts | Bins with >2000 counts | High rate bins dominated by noise | Noise dominated (total time) | Noise dominated (detector-on time) | Marked lightcurve |
|---|---|---|---|---|---|---|---|
| A | 7608 | 6514 | 1884 | 1884 | 24.76% | 28.92% | 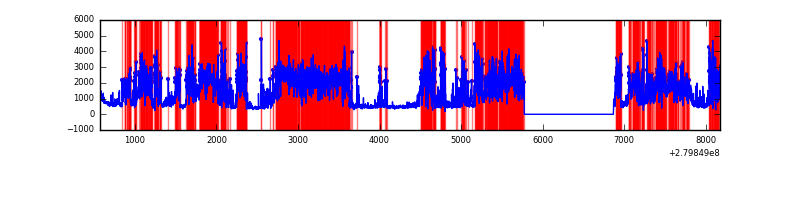 |
| B | 7608 | 6514 | 0 | 0 | 0.00% | 0.00% | 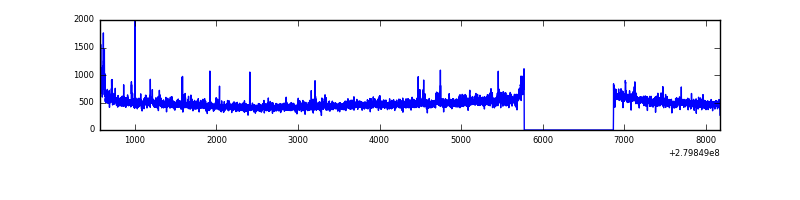 |
| C | 7608 | 6514 | 0 | 0 | 0.00% | 0.00% | 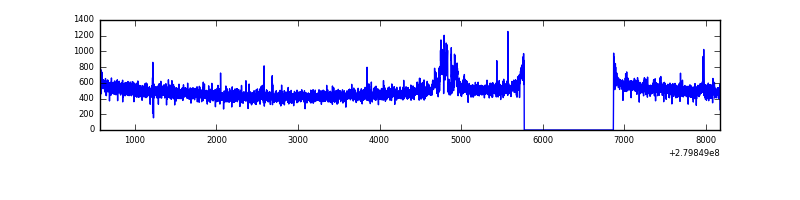 |
| D | 7608 | 6514 | 141 | 141 | 1.85% | 2.16% | 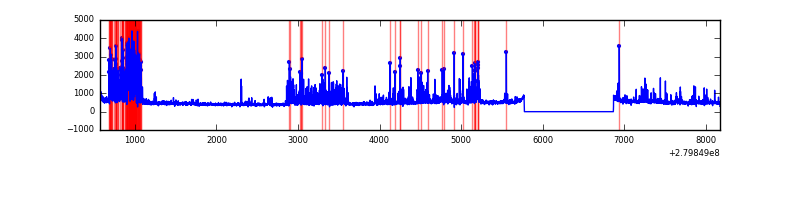 |
Top three noisy pixels from each quadrant. If the there are fewer than three noisy pixels in the level2.evt file, extra rows are filled as -1
| Pixel properties | Quadrant properties | ||||||
|---|---|---|---|---|---|---|---|
| Quadrant | DetID | PixID | Counts | Sigma | Mean | Median | Sigma |
| A | 15 | 174 | 6749960 | 50098.03 | 668 | 656 | 134.7 |
| A | 12 | 189 | 35743 | 260.44 | 668 | 656 | 134.7 |
| A | 0 | 226 | 5695 | 37.4 | 668 | 656 | 134.7 |
| B | 15 | 35 | 55012 | 360.05 | 790 | 771 | 150.6 |
| B | 12 | 111 | 17671 | 112.18 | 790 | 771 | 150.6 |
| B | 4 | 216 | 17091 | 108.33 | 790 | 771 | 150.6 |
| C | 3 | 233 | 135571 | 764.41 | 753 | 760 | 176.4 |
| C | 14 | 238 | 119059 | 670.79 | 753 | 760 | 176.4 |
| C | 0 | 207 | 10736 | 56.57 | 753 | 760 | 176.4 |
| D | 1 | 52 | 1137641 | 6208.03 | 752 | 731 | 183.1 |
| D | 2 | 152 | 33813 | 180.64 | 752 | 731 | 183.1 |
| D | 2 | 234 | 25065 | 132.87 | 752 | 731 | 183.1 |
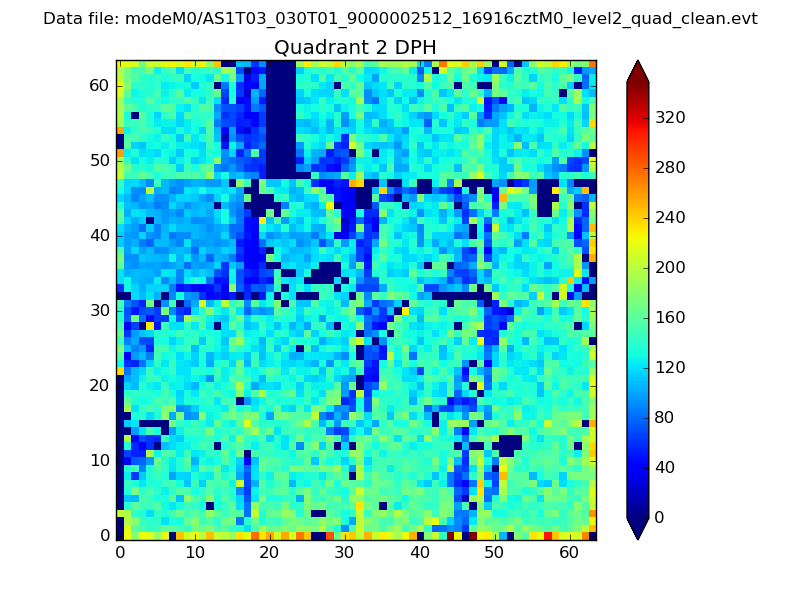
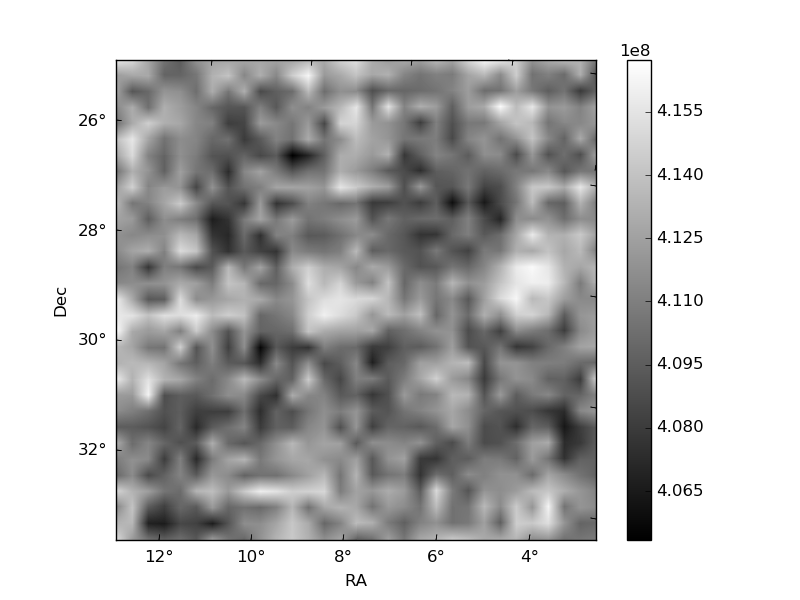
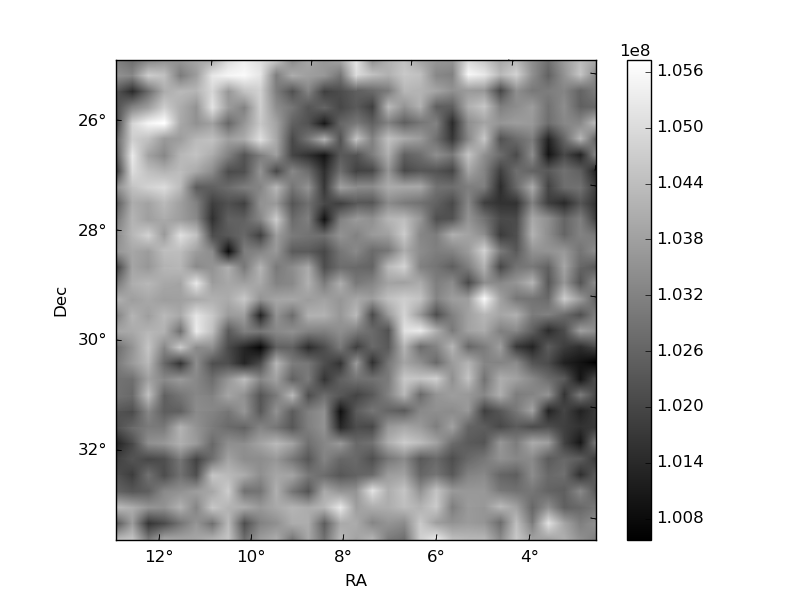
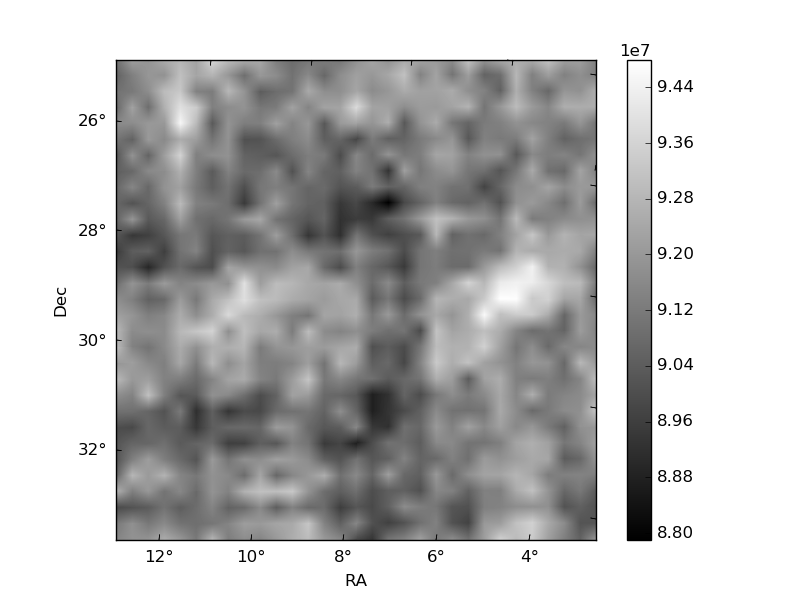
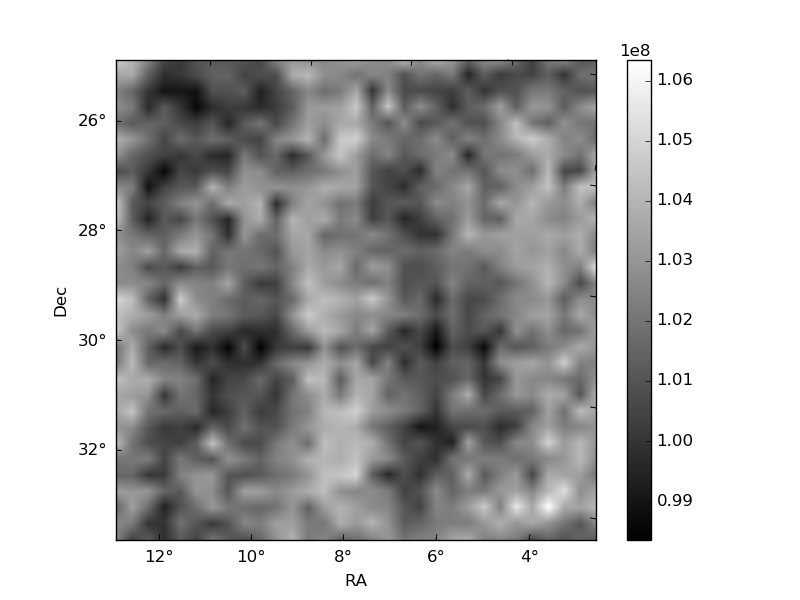
Histogram calculated using DETX and DETY for each event in the final _common_clean file
| Quadrant A | 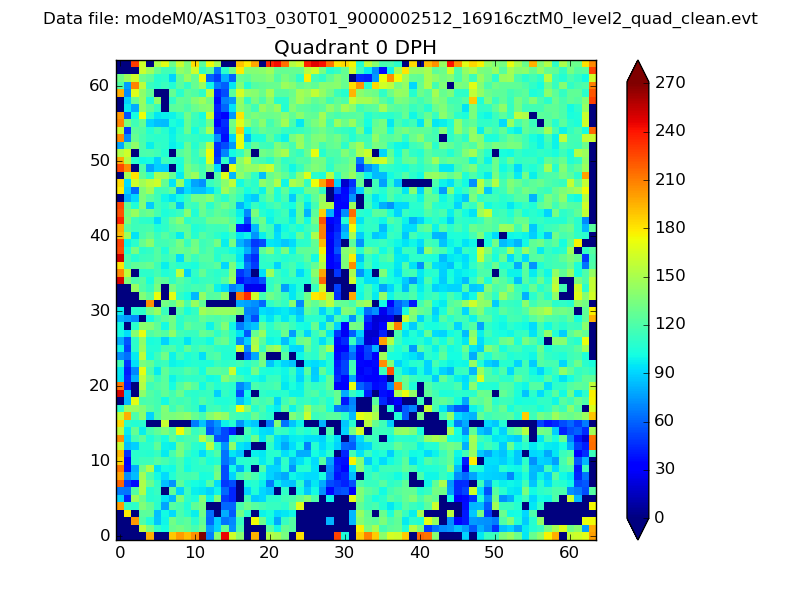 |
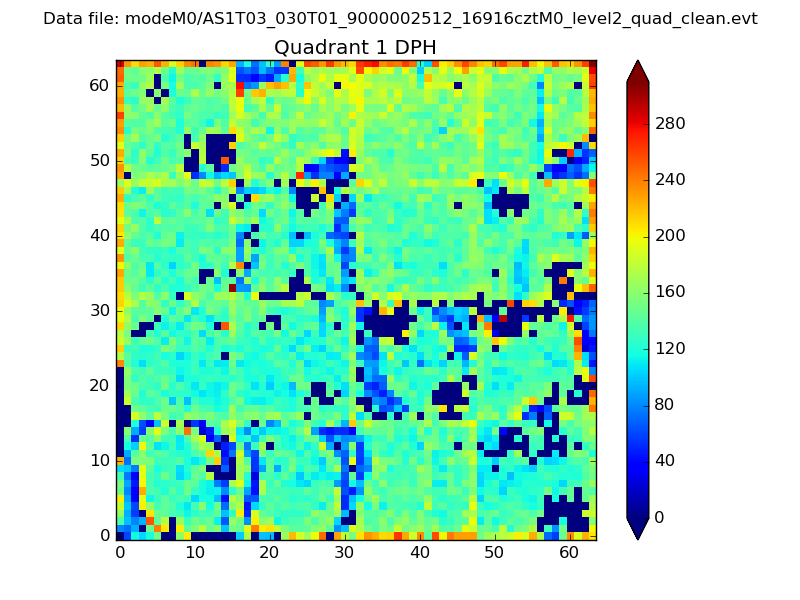 |
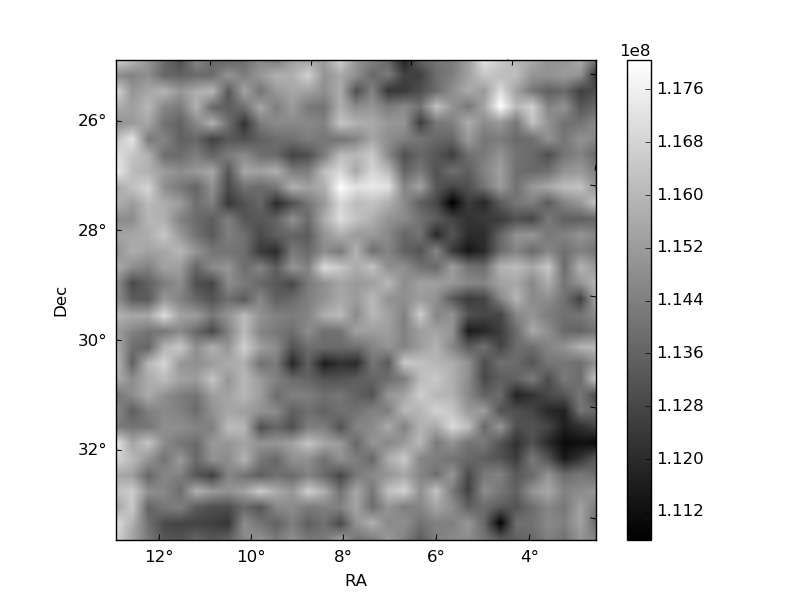
Quadrant B |
|---|---|---|---|
| Quadrant D | 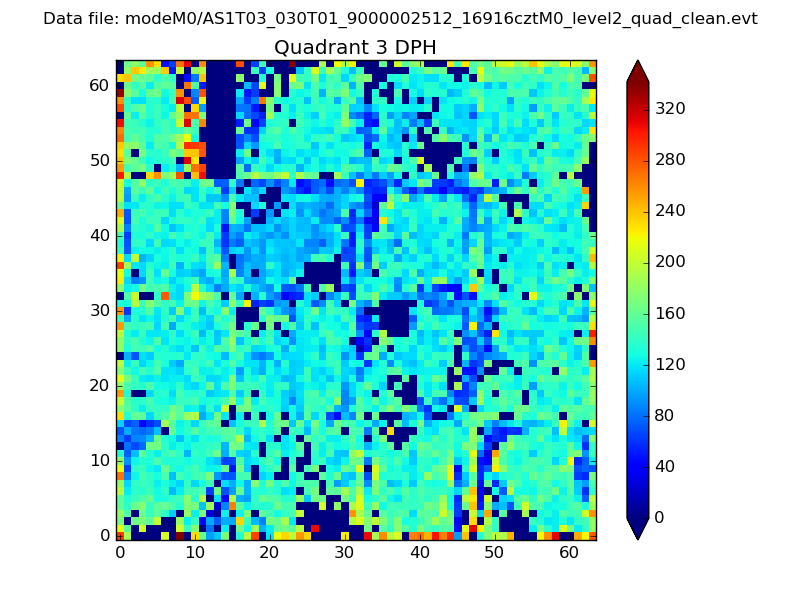 |
 |
Quadrant C |
| Plot type | Count rate plots | Images |
|---|---|---|
| Comparison with Poisson distribution Blue bars denote a histogram of data divided into 1 sec bins. Red curve is a Poisson curve with rate = median count rate of data. |
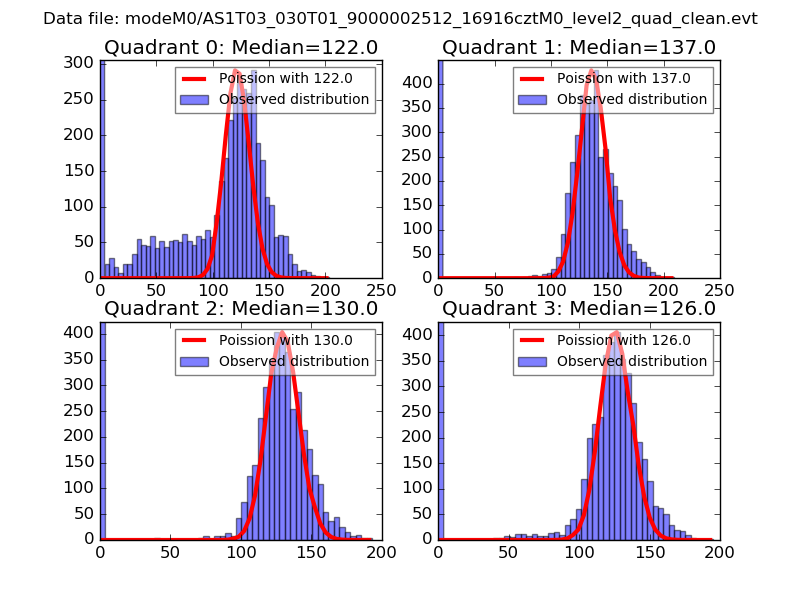 |
 |
| Quadrant-wise count rates Data is divided into 100 sec bins |
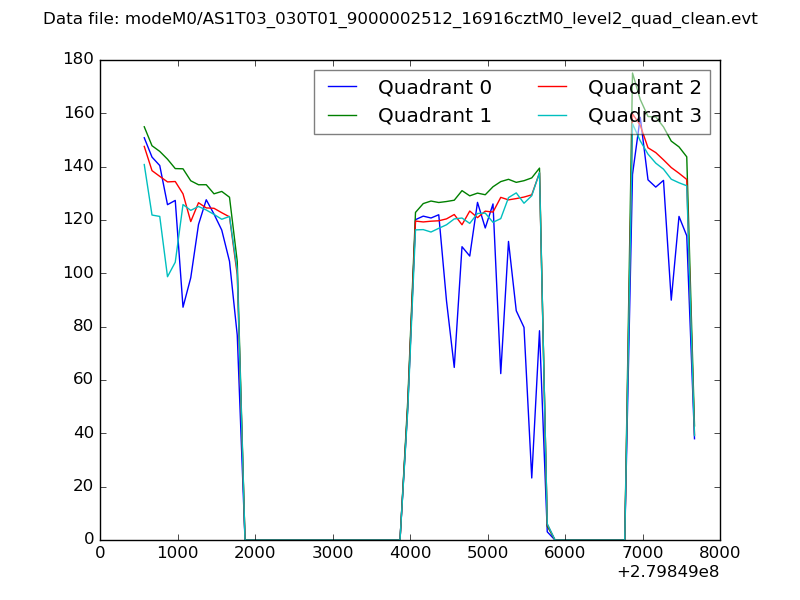 |
|
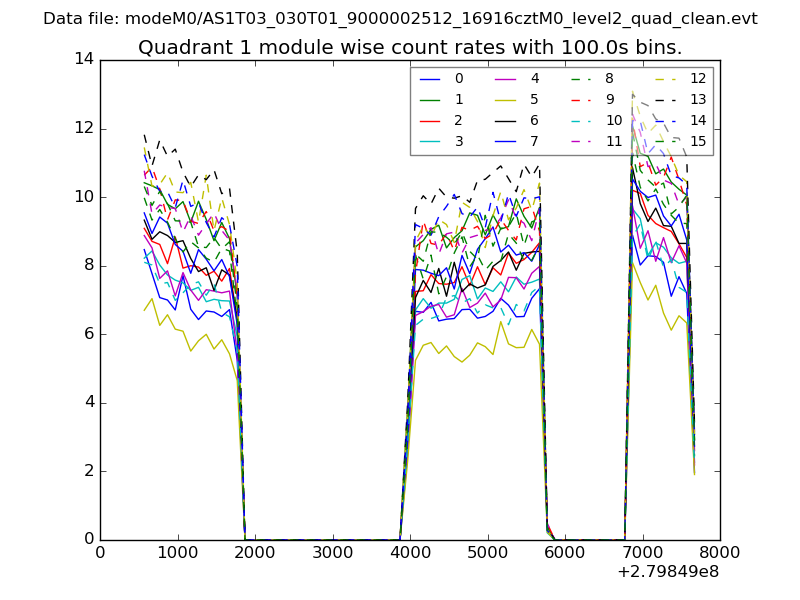
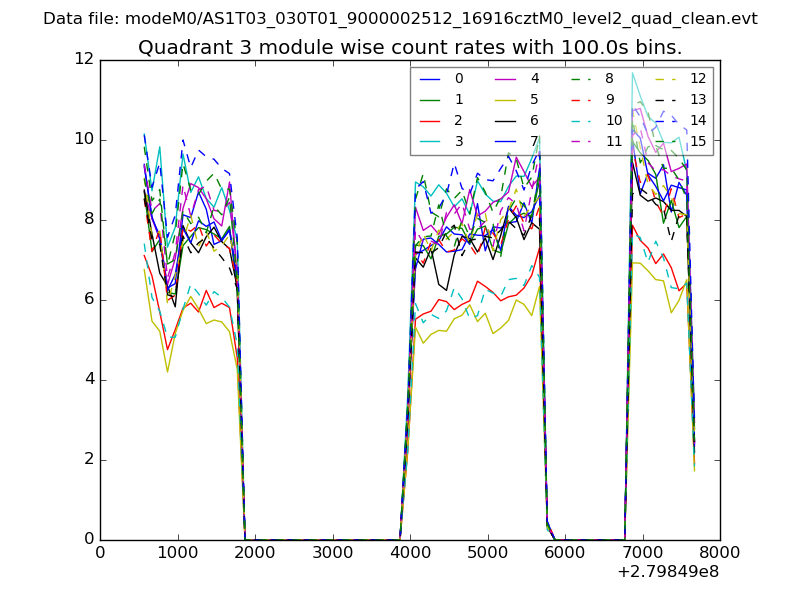
| Module-wise count rates for Quadrant A Data is divided into 100 sec bins |
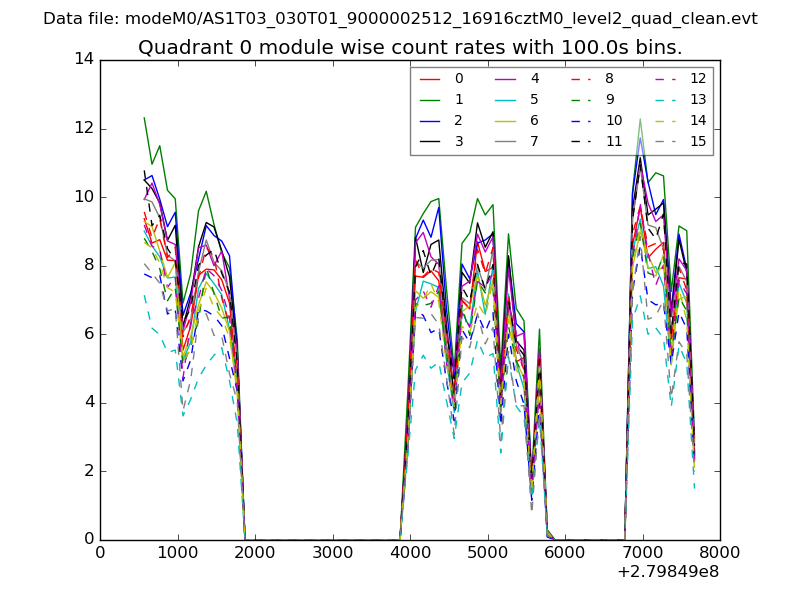 |
 |
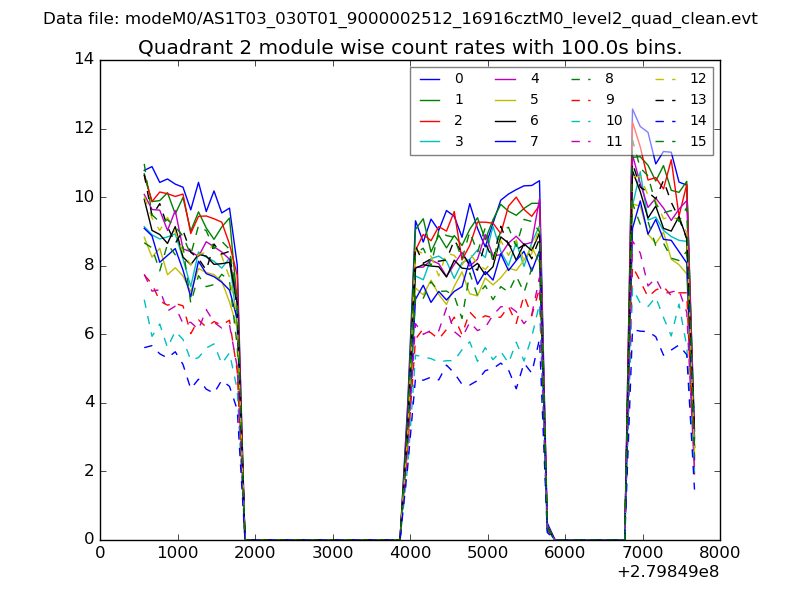
| Module-wise count rates for Quadrant B Data is divided into 100 sec bins |
 |
 |
| Module-wise count rates for Quadrant C Data is divided into 100 sec bins |
 |
 |
| Module-wise count rates for Quadrant D Data is divided into 100 sec bins |
 |
 |
| Parameter | Plot |
|---|---|
| CZT HV Monitor | 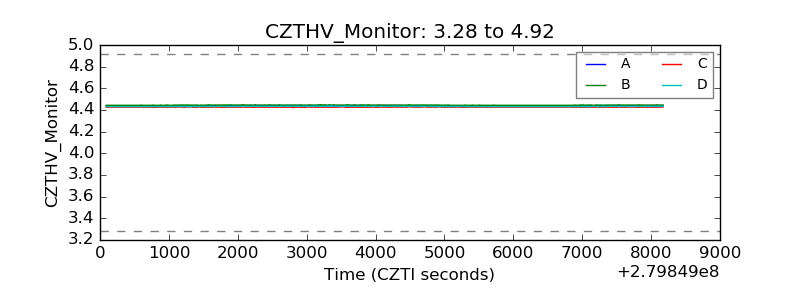 |
| D_VDD | 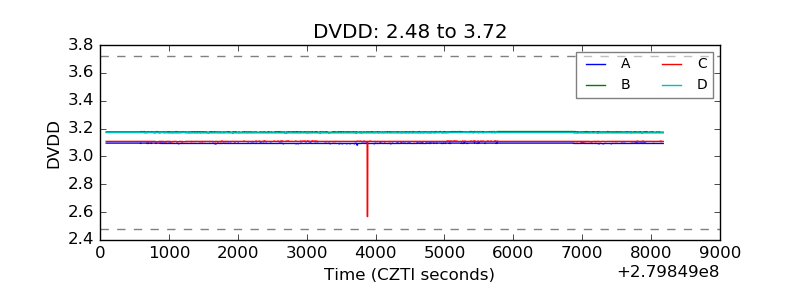 |
| Temperature 1 | 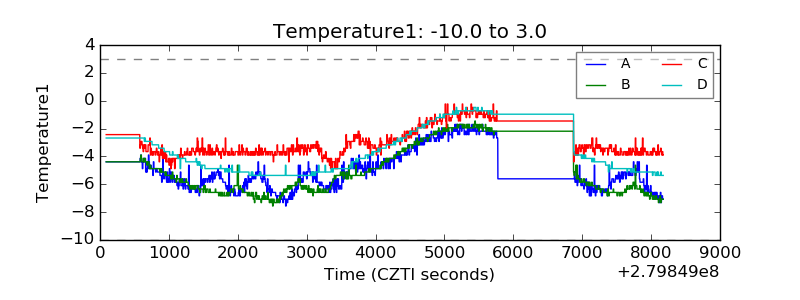 |
| Veto HV Monitor | 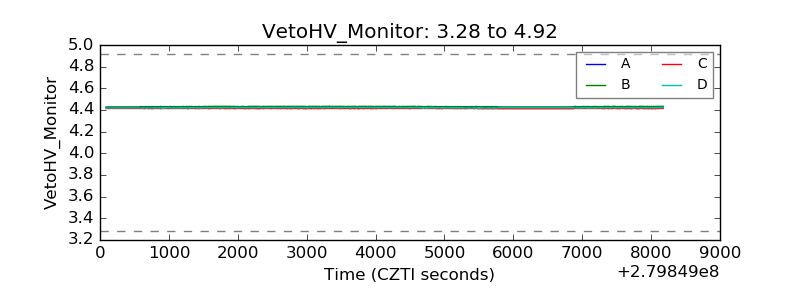 |
| Veto LLD | 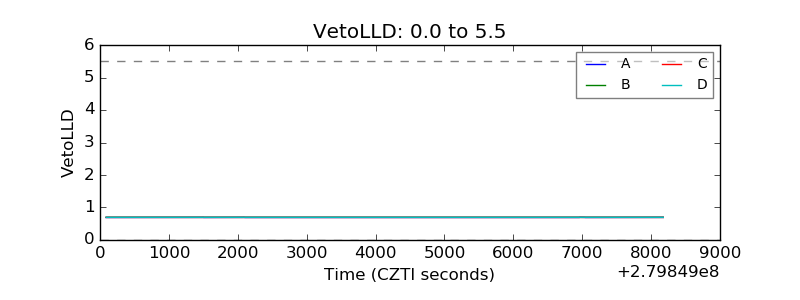 |
| Alpha Counter | 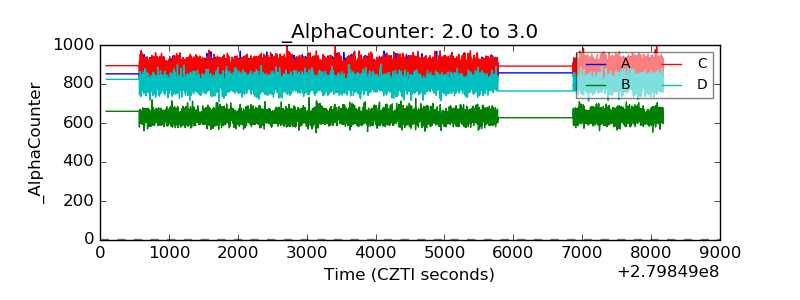 |
| _CPM_Rate | 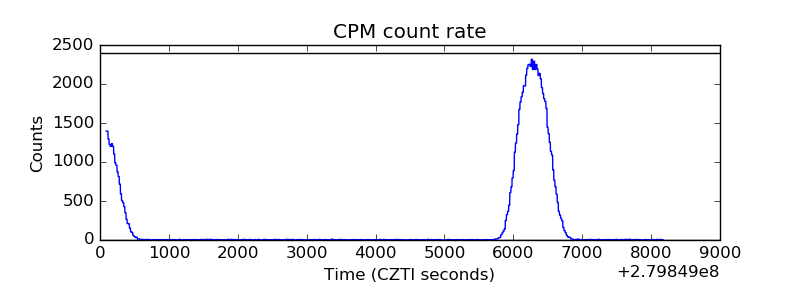 |
| CZT Counter | 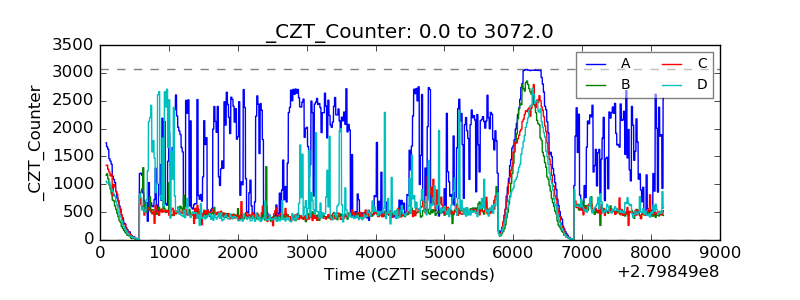 |
| +2.5 Volts monitor |  |
| +5 Volts monitor | 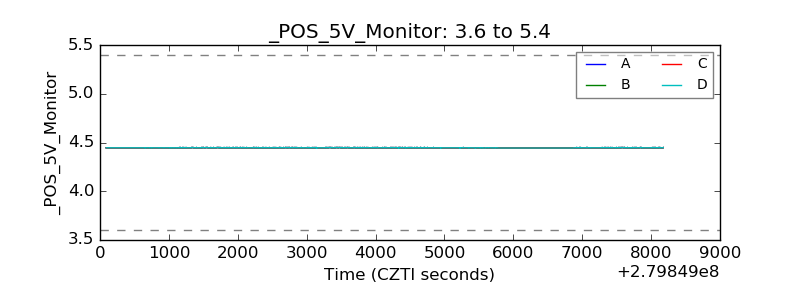 |
| _ROLL_ROT | 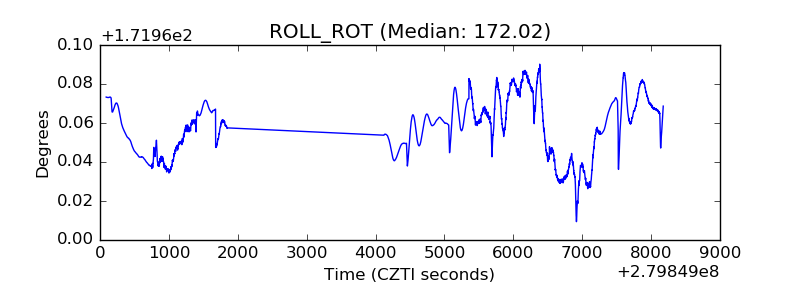 |
| _Roll_DEC | 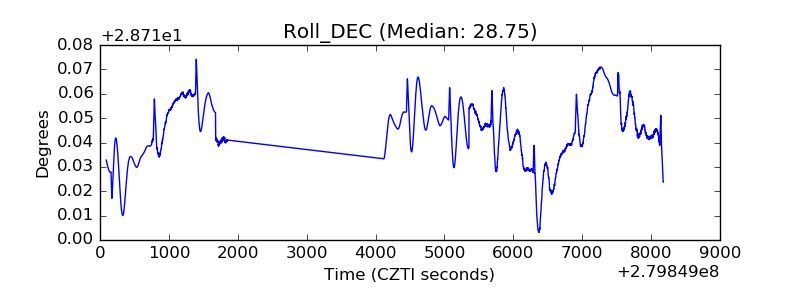 |
| _Roll_RA | 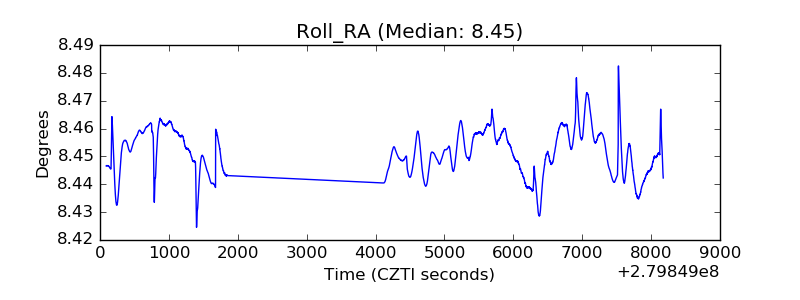 |
| Veto Counter | 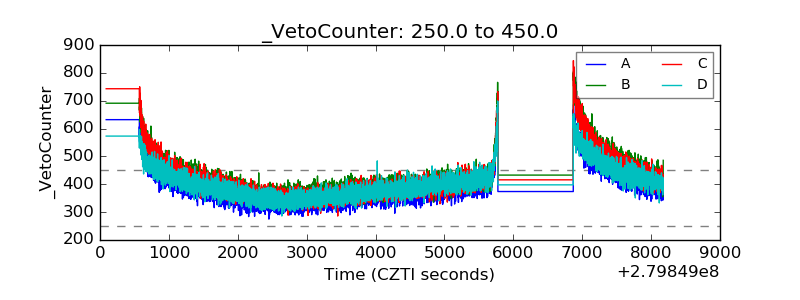 |