| Param | Original file | Final file |
|---|---|---|
| Filename | modeM0/AS1T03_030T01_9000002512_16918cztM0_level2.evt | modeM0/AS1T03_030T01_9000002512_16918cztM0_level2_quad_clean.evt |
| Size (bytes) | 677,378,880 | 72,224,640 |
| Size | 646.0 MB | 68.9 MB |
| Events in quadrant A | 10,064,620 | 367,200 |
| Events in quadrant B | 3,441,335 | 475,476 |
| Events in quadrant C | 3,235,376 | 449,637 |
| Events in quadrant D | 3,333,136 | 440,573 |
| Mode M9 | |||
|---|---|---|---|
| Quadrant | BADHDUFLAG | Total packets | Discarded packets |
| A | 0 | 18 | 0 |
| B | 0 | 19 | 0 |
| C | 0 | 19 | 0 |
| D | 0 | 19 | 0 |
| Mode M0 | |||
|---|---|---|---|
| Quadrant | BADHDUFLAG | Total packets | Discarded packets |
| A | 0 | 34446 | 2 |
| B | 0 | 14244 | 3 |
| C | 0 | 13565 | 2 |
| D | 0 | 14080 | 2 |
| Mode SS | |||
|---|---|---|---|
| Quadrant | BADHDUFLAG | Total packets | Discarded packets |
| A | 0 | 132 | 0 |
| B | 0 | 132 | 0 |
| C | 0 | 132 | 0 |
| D | 0 | 132 | 0 |
| Quadrant | Total seconds | Saturated seconds | Saturation percentage |
|---|---|---|---|
| A | 6497 | 2781 | 42.804371% |
| B | 6496 | 78 | 1.200739% |
| C | 6496 | 43 | 0.661946% |
| D | 6496 | 16 | 0.246305% |
Noise dominated data is calculated using 1-second bins in cleaned event files. If a bin has >2000 counts, and if more than 50% of those come from <1% of pixels, then it is considered to be noise-dominated and hence unusable.
| Quadrant | # 1 sec bins | Bins with >0 counts | Bins with >2000 counts | High rate bins dominated by noise | Noise dominated (total time) | Noise dominated (detector-on time) | Marked lightcurve |
|---|---|---|---|---|---|---|---|
| A | 7703 | 6499 | 1985 | 1985 | 25.77% | 30.54% | 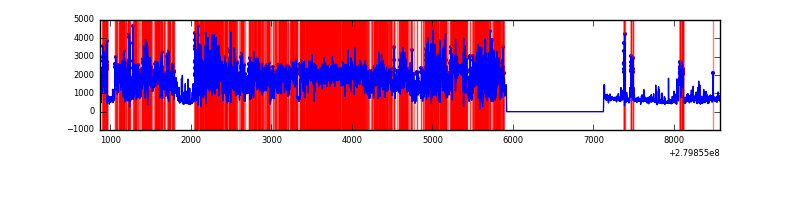 |
| B | 7702 | 6498 | 31 | 31 | 0.40% | 0.48% | 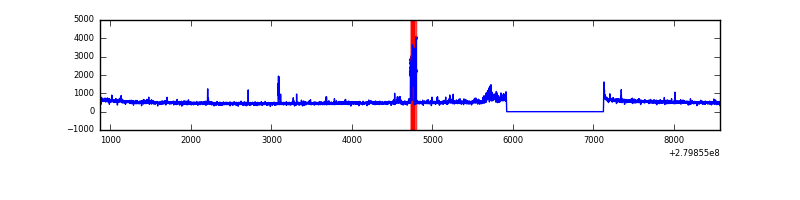 |
| C | 7702 | 6498 | 0 | 0 | 0.00% | 0.00% | 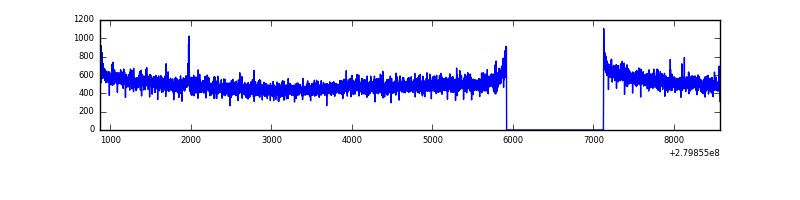 |
| D | 7702 | 6498 | 6 | 6 | 0.08% | 0.09% | 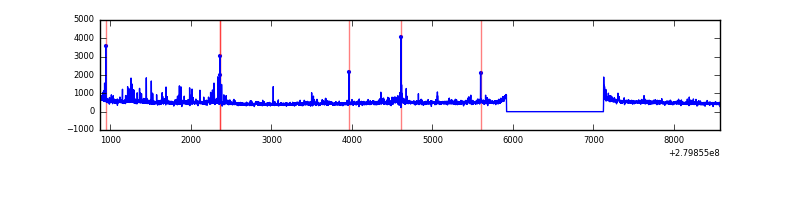 |
Top three noisy pixels from each quadrant. If the there are fewer than three noisy pixels in the level2.evt file, extra rows are filled as -1
| Pixel properties | Quadrant properties | ||||||
|---|---|---|---|---|---|---|---|
| Quadrant | DetID | PixID | Counts | Sigma | Mean | Median | Sigma |
| A | 15 | 174 | 7389910 | 53019.75 | 695 | 681 | 139.4 |
| A | 0 | 226 | 6055 | 38.56 | 695 | 681 | 139.4 |
| A | 12 | 194 | 5051 | 31.36 | 695 | 681 | 139.4 |
| B | 15 | 35 | 146072 | 931.88 | 817 | 796 | 155.9 |
| B | 4 | 216 | 66844 | 423.67 | 817 | 796 | 155.9 |
| B | 12 | 111 | 18053 | 110.7 | 817 | 796 | 155.9 |
| C | 14 | 238 | 121331 | 664.66 | 778 | 788 | 181.4 |
| C | 3 | 233 | 73202 | 399.28 | 778 | 788 | 181.4 |
| C | 13 | 61 | 5465 | 25.79 | 778 | 788 | 181.4 |
| D | 1 | 52 | 240247 | 1259.8 | 782 | 761 | 190.1 |
| D | 2 | 152 | 98854 | 516.01 | 782 | 761 | 190.1 |
| D | 15 | 145 | 26646 | 136.17 | 782 | 761 | 190.1 |
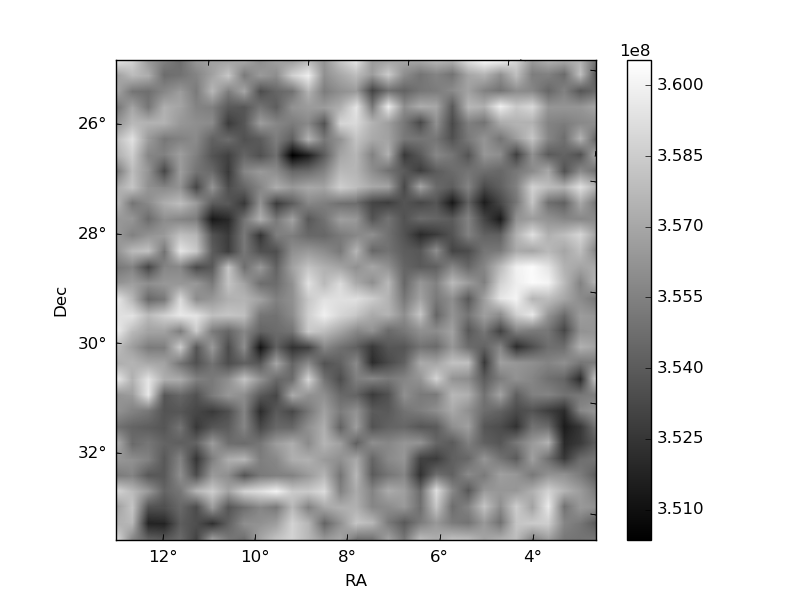
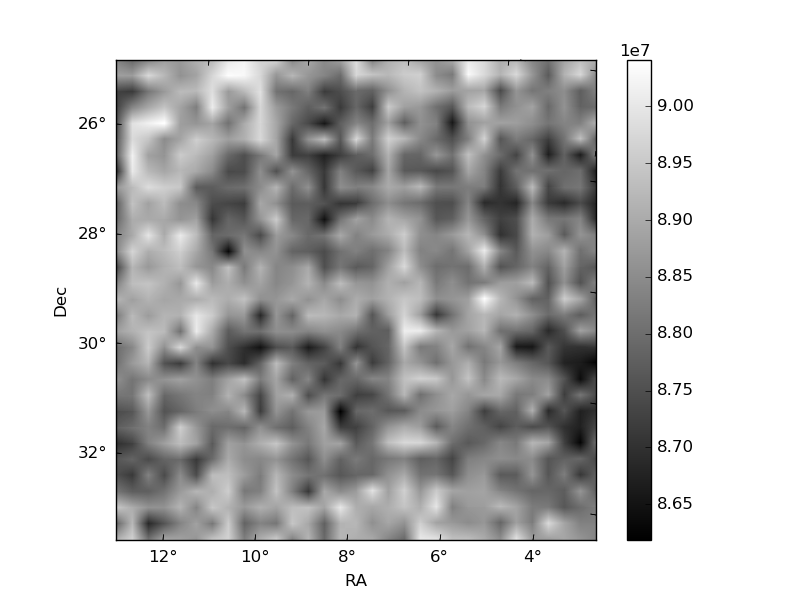
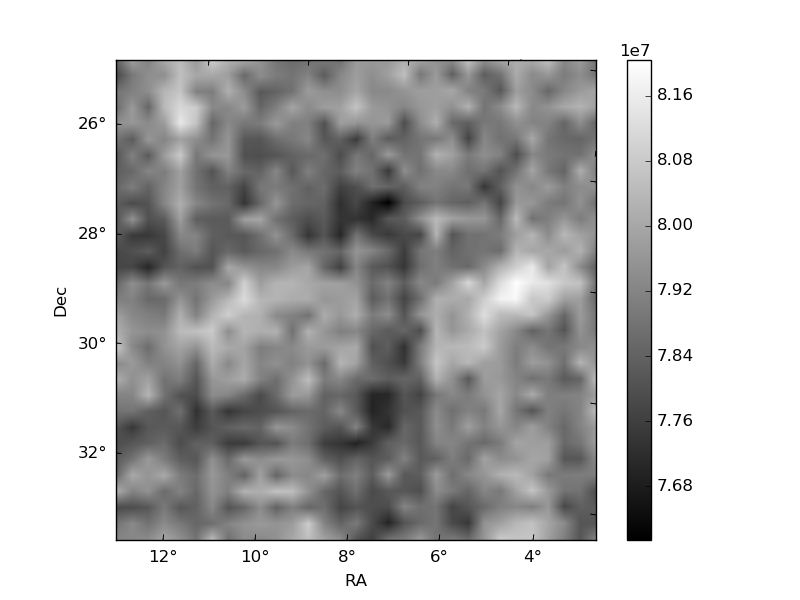
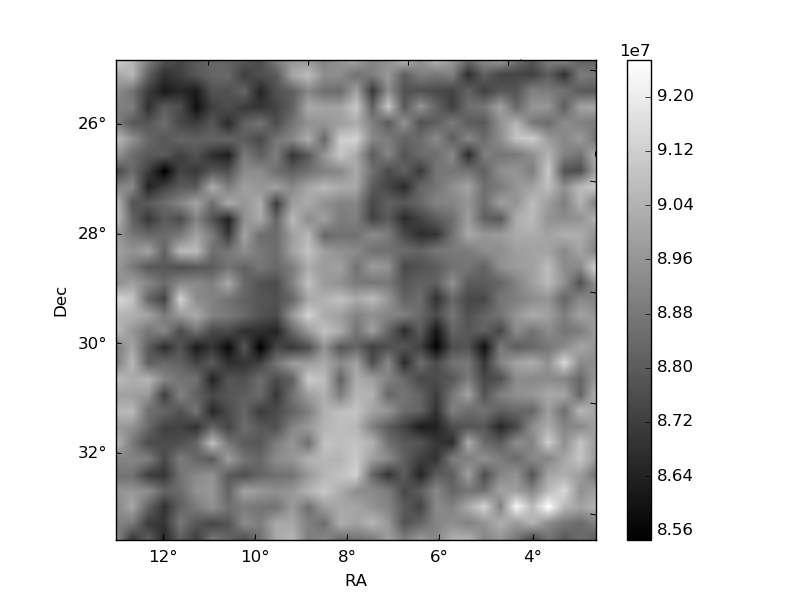
Histogram calculated using DETX and DETY for each event in the final _common_clean file
| Quadrant A | 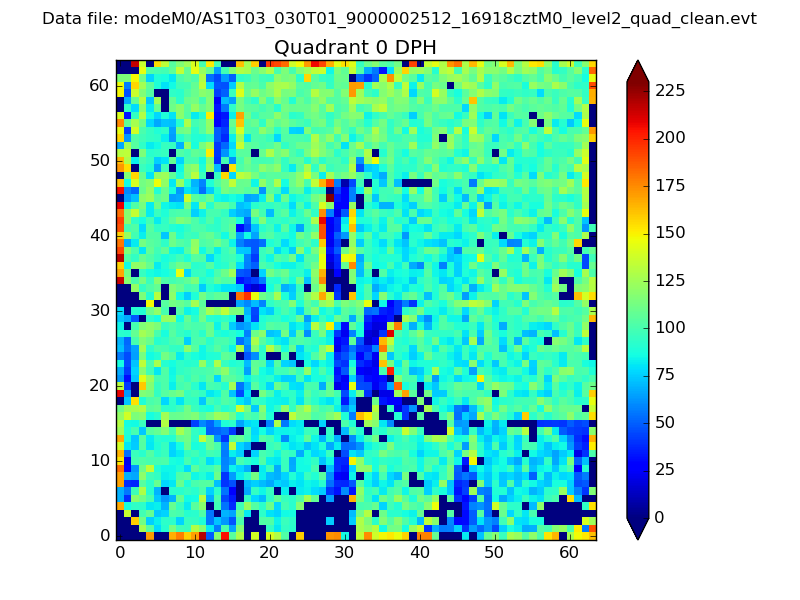 |
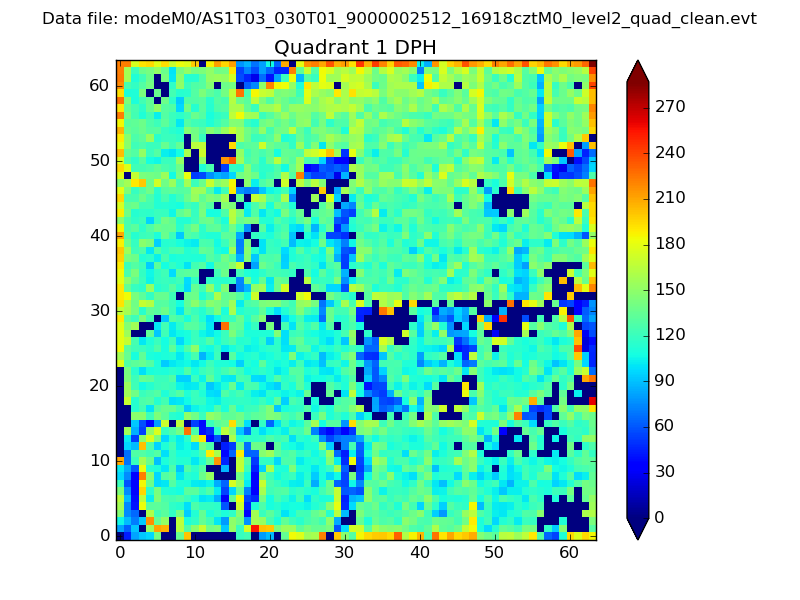 |
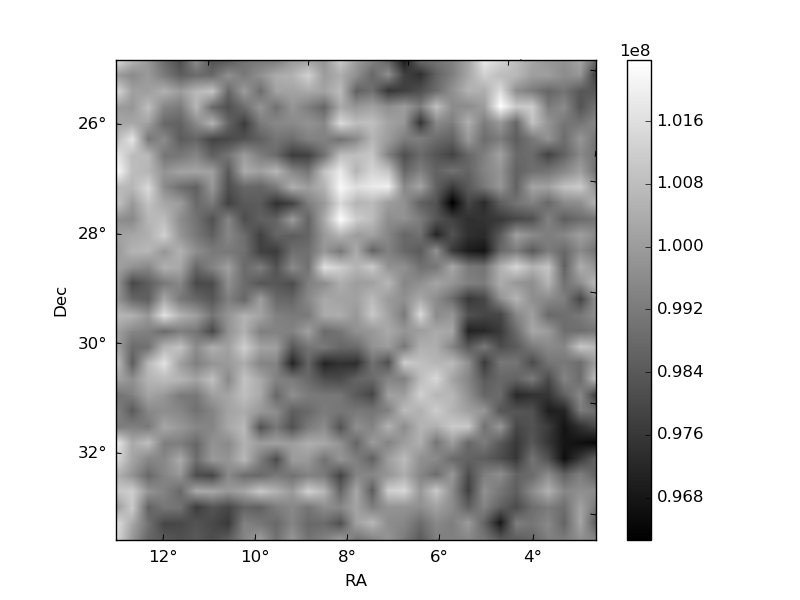
Quadrant B |
|---|---|---|---|
| Quadrant D | 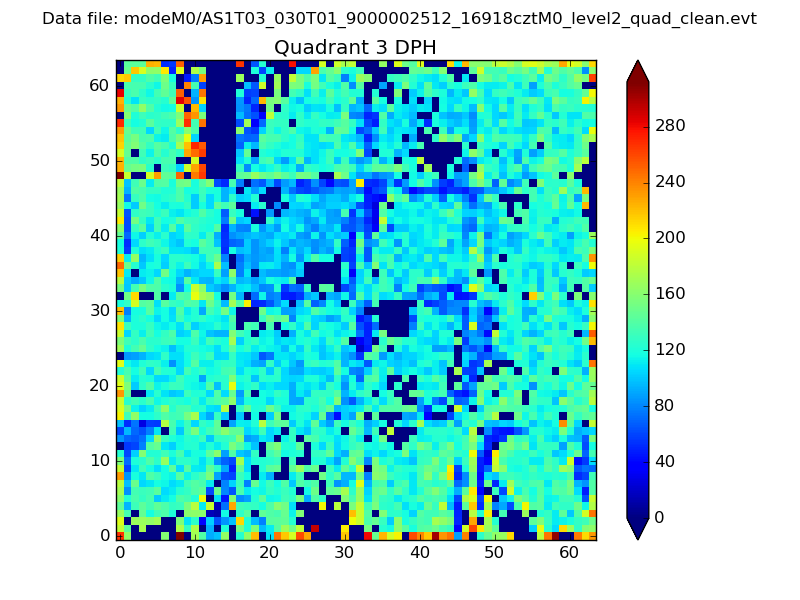 |
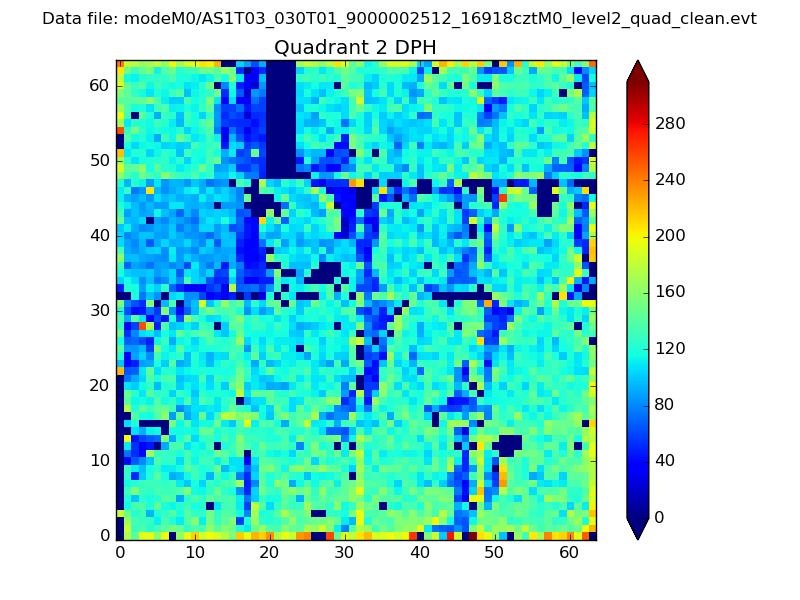 |
Quadrant C |
| Plot type | Count rate plots | Images |
|---|---|---|
| Comparison with Poisson distribution Blue bars denote a histogram of data divided into 1 sec bins. Red curve is a Poisson curve with rate = median count rate of data. |
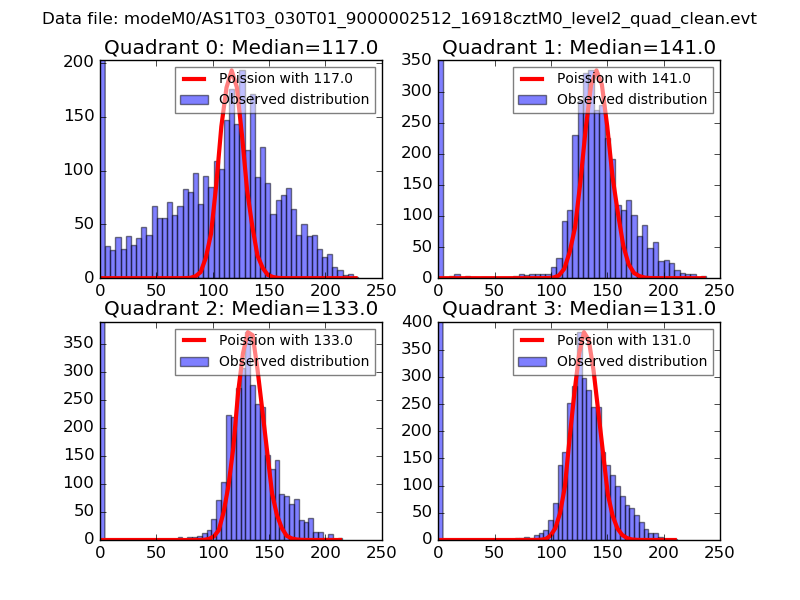 |
 |
| Quadrant-wise count rates Data is divided into 100 sec bins |
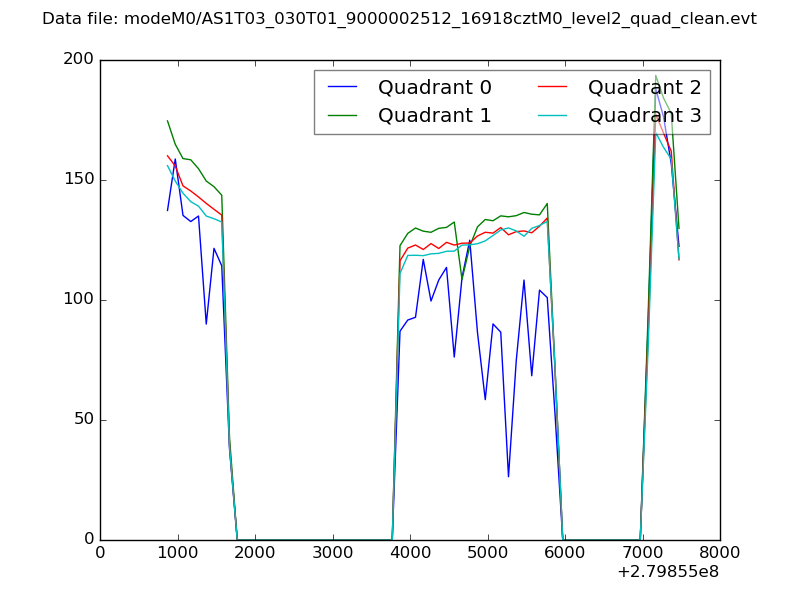 |
|
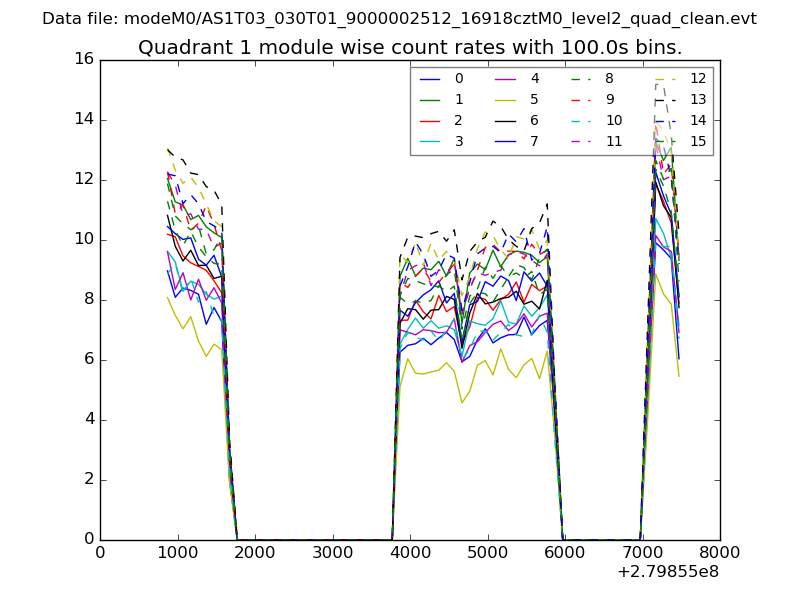
| Module-wise count rates for Quadrant A Data is divided into 100 sec bins |
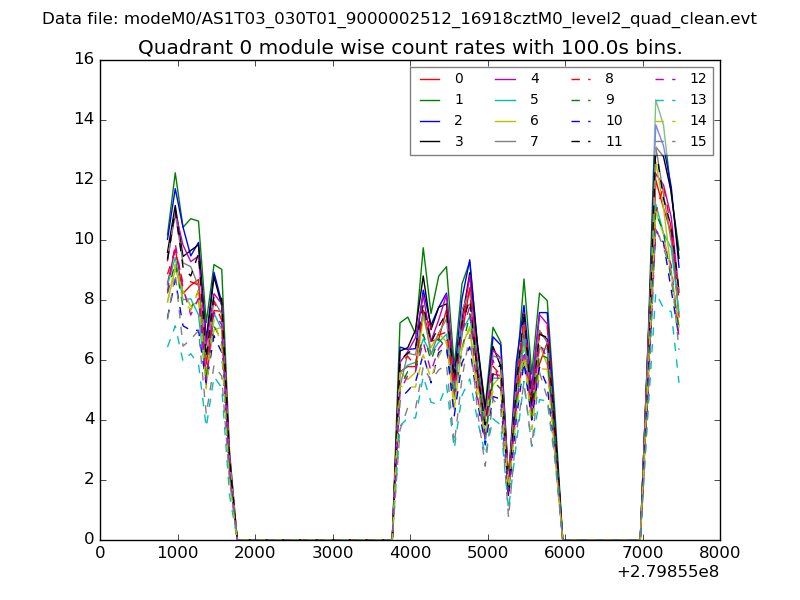 |
 |
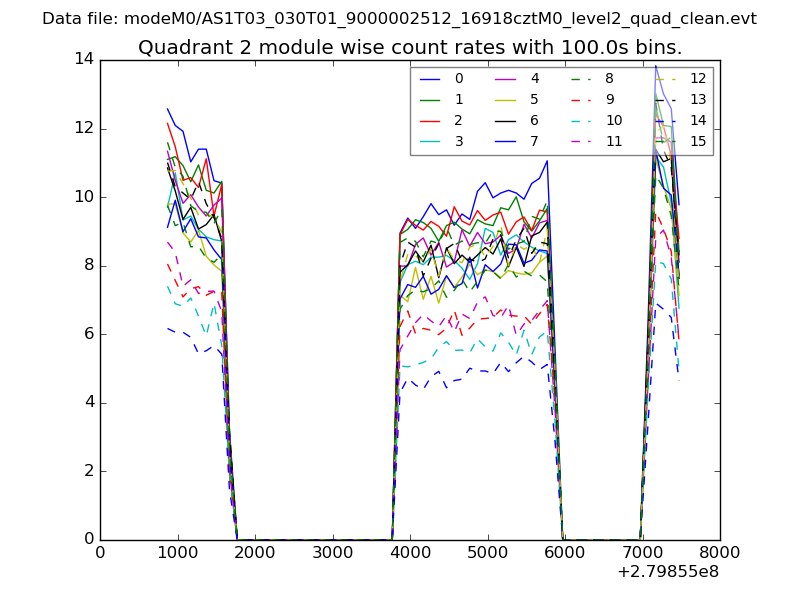
| Module-wise count rates for Quadrant B Data is divided into 100 sec bins |
 |
 |
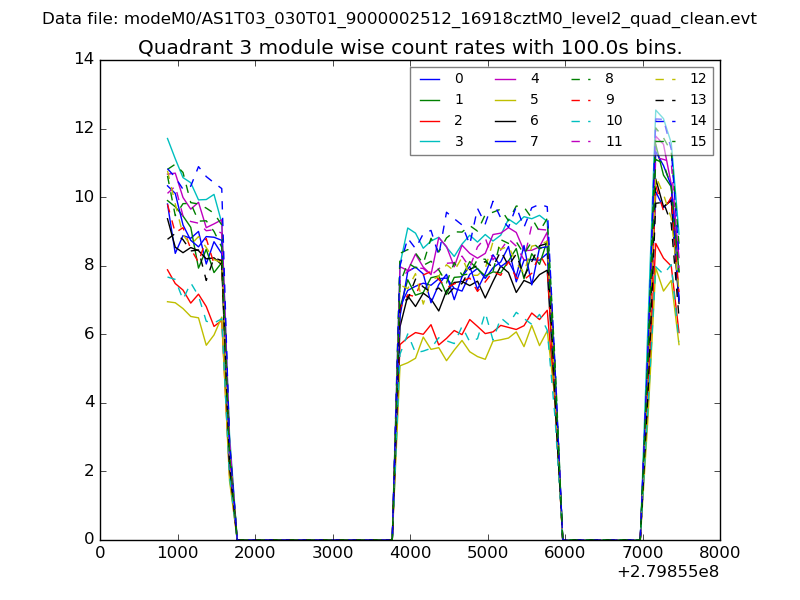
| Module-wise count rates for Quadrant C Data is divided into 100 sec bins |
 |
 |
| Module-wise count rates for Quadrant D Data is divided into 100 sec bins |
 |
 |
| Parameter | Plot |
|---|---|
| CZT HV Monitor | 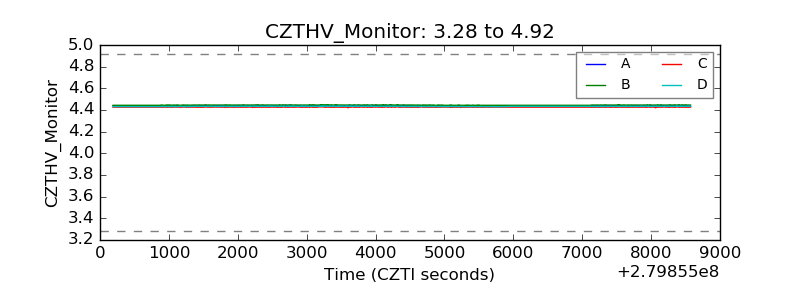 |
| D_VDD | 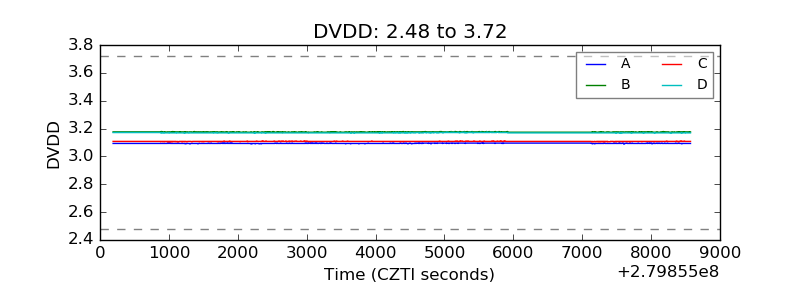 |
| Temperature 1 | 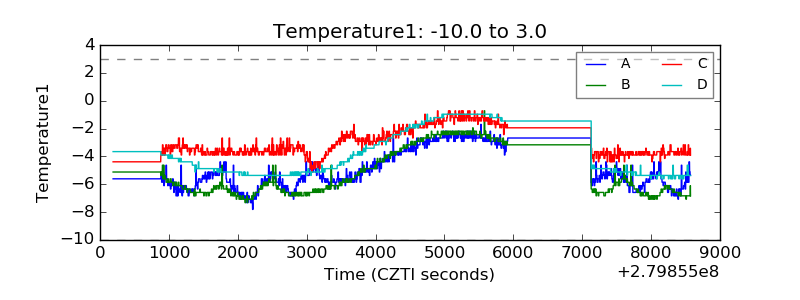 |
| Veto HV Monitor | 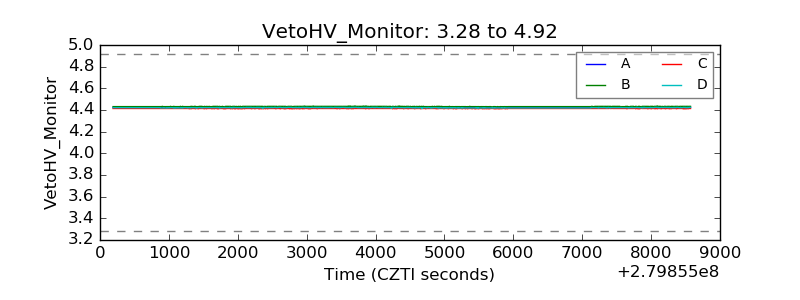 |
| Veto LLD | 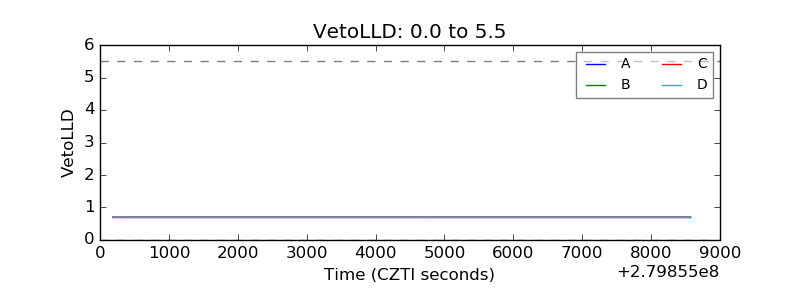 |
| Alpha Counter | 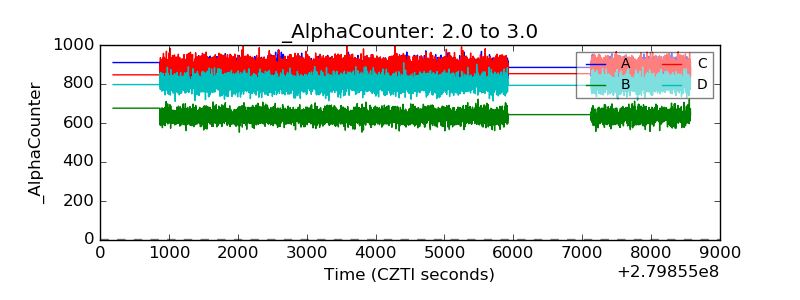 |
| _CPM_Rate | 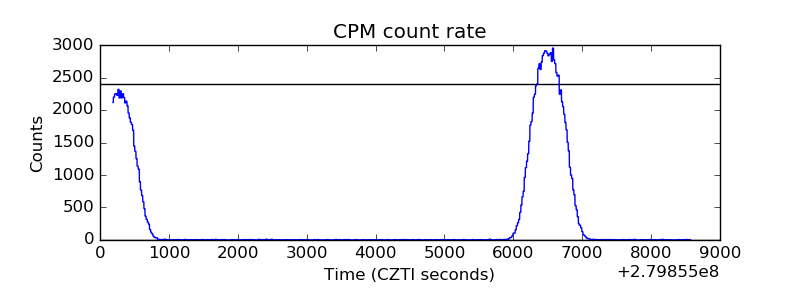 |
| CZT Counter | 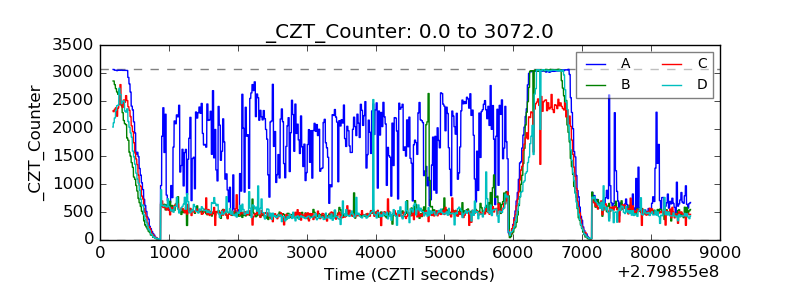 |
| +2.5 Volts monitor |  |
| +5 Volts monitor |  |
| _ROLL_ROT | 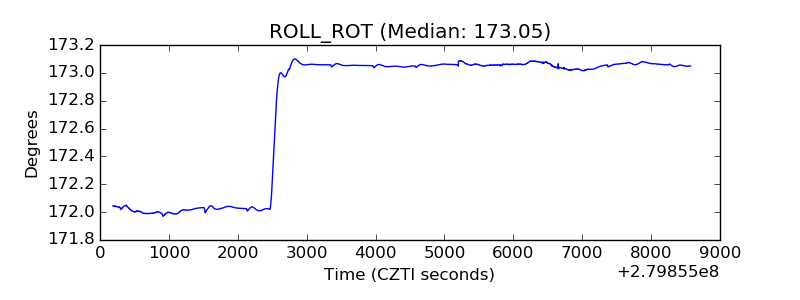 |
| _Roll_DEC | 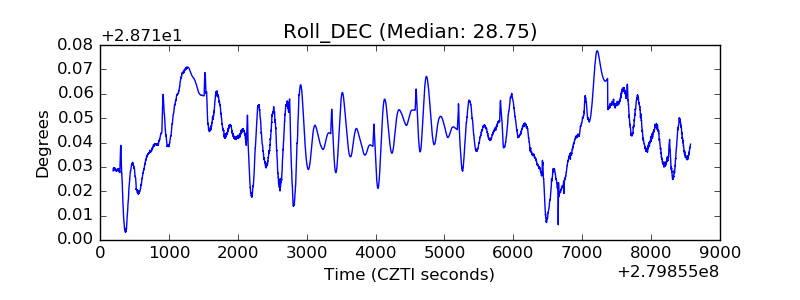 |
| _Roll_RA | 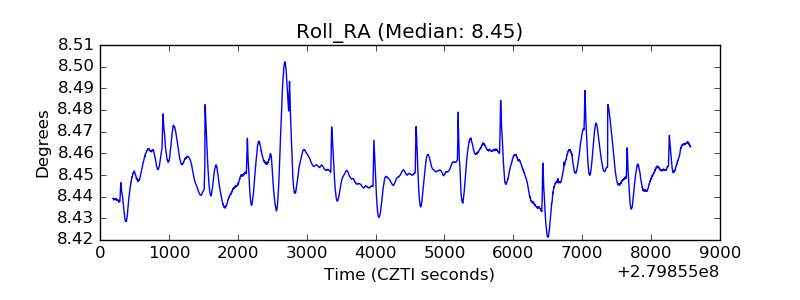 |
| Veto Counter | 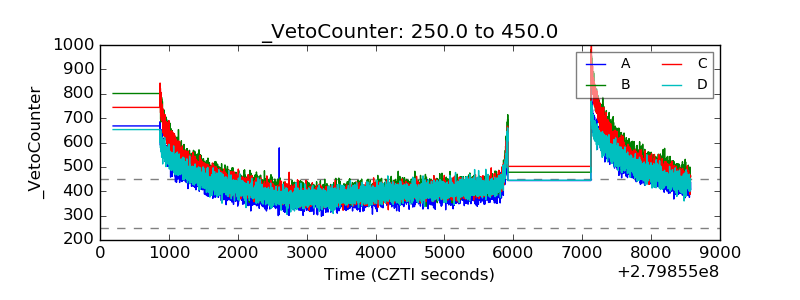 |