| Param | Original file | Final file |
|---|---|---|
| Filename | modeM0/AS1T03_030T01_9000002512_16919cztM0_level2.evt | modeM0/AS1T03_030T01_9000002512_16919cztM0_level2_quad_clean.evt |
| Size (bytes) | 591,963,840 | 61,424,640 |
| Size | 564.5 MB | 58.6 MB |
| Events in quadrant A | 7,617,464 | 327,625 |
| Events in quadrant B | 3,397,954 | 380,100 |
| Events in quadrant C | 3,244,474 | 357,408 |
| Events in quadrant D | 3,236,692 | 349,897 |
| Mode M9 | |||
|---|---|---|---|
| Quadrant | BADHDUFLAG | Total packets | Discarded packets |
| A | 0 | 13 | 0 |
| B | 0 | 13 | 0 |
| C | 0 | 13 | 0 |
| D | 0 | 13 | 0 |
| Mode M0 | |||
|---|---|---|---|
| Quadrant | BADHDUFLAG | Total packets | Discarded packets |
| A | 0 | 27165 | 1 |
| B | 0 | 13899 | 1 |
| C | 0 | 13392 | 1 |
| D | 0 | 13631 | 2 |
| Mode SS | |||
|---|---|---|---|
| Quadrant | BADHDUFLAG | Total packets | Discarded packets |
| A | 0 | 130 | 0 |
| B | 0 | 130 | 0 |
| C | 0 | 130 | 0 |
| D | 0 | 130 | 0 |
| Quadrant | Total seconds | Saturated seconds | Saturation percentage |
|---|---|---|---|
| A | 6362 | 1231 | 19.349261% |
| B | 6362 | 36 | 0.565860% |
| C | 6363 | 50 | 0.785793% |
| D | 6362 | 14 | 0.220057% |
Noise dominated data is calculated using 1-second bins in cleaned event files. If a bin has >2000 counts, and if more than 50% of those come from <1% of pixels, then it is considered to be noise-dominated and hence unusable.
| Quadrant | # 1 sec bins | Bins with >0 counts | Bins with >2000 counts | High rate bins dominated by noise | Noise dominated (total time) | Noise dominated (detector-on time) | Marked lightcurve |
|---|---|---|---|---|---|---|---|
| A | 7648 | 6364 | 814 | 814 | 10.64% | 12.79% | 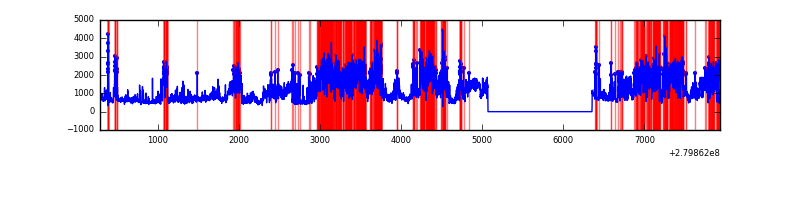 |
| B | 7648 | 6364 | 1 | 1 | 0.01% | 0.02% | 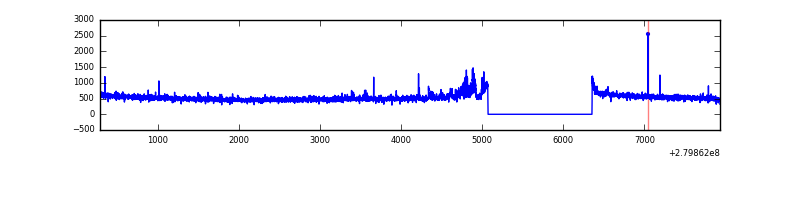 |
| C | 7649 | 6365 | 0 | 0 | 0.00% | 0.00% | 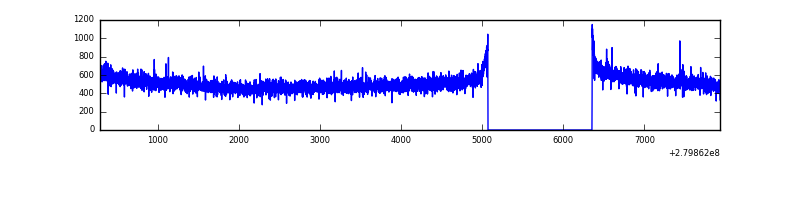 |
| D | 7648 | 6364 | 7 | 7 | 0.09% | 0.11% | 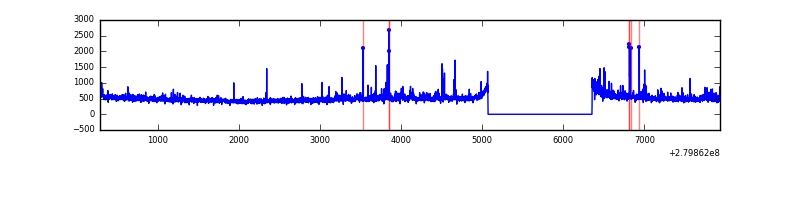 |
Top three noisy pixels from each quadrant. If the there are fewer than three noisy pixels in the level2.evt file, extra rows are filled as -1
| Pixel properties | Quadrant properties | ||||||
|---|---|---|---|---|---|---|---|
| Quadrant | DetID | PixID | Counts | Sigma | Mean | Median | Sigma |
| A | 15 | 174 | 4597259 | 29106.58 | 786 | 771 | 157.9 |
| A | 0 | 226 | 6957 | 39.17 | 786 | 771 | 157.9 |
| A | 12 | 194 | 5604 | 30.6 | 786 | 771 | 157.9 |
| B | 15 | 35 | 99087 | 628.61 | 836 | 819 | 156.3 |
| B | 4 | 216 | 18469 | 112.9 | 836 | 819 | 156.3 |
| B | 12 | 111 | 18051 | 110.23 | 836 | 819 | 156.3 |
| C | 14 | 238 | 125854 | 689.42 | 788 | 793 | 181.4 |
| C | 3 | 233 | 45279 | 245.24 | 788 | 793 | 181.4 |
| C | 13 | 61 | 5618 | 26.6 | 788 | 793 | 181.4 |
| D | 1 | 52 | 146377 | 762.68 | 794 | 773 | 190.9 |
| D | 2 | 152 | 59810 | 309.24 | 794 | 773 | 190.9 |
| D | 15 | 145 | 27949 | 142.35 | 794 | 773 | 190.9 |
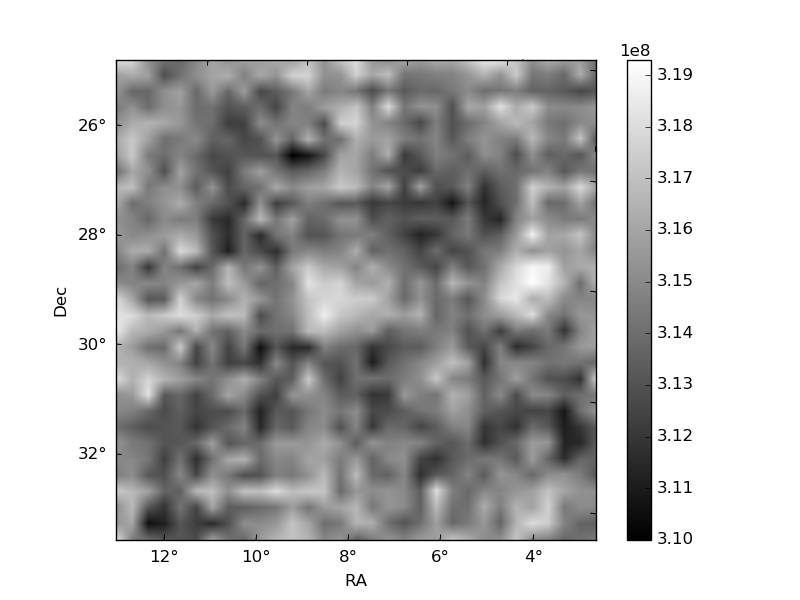
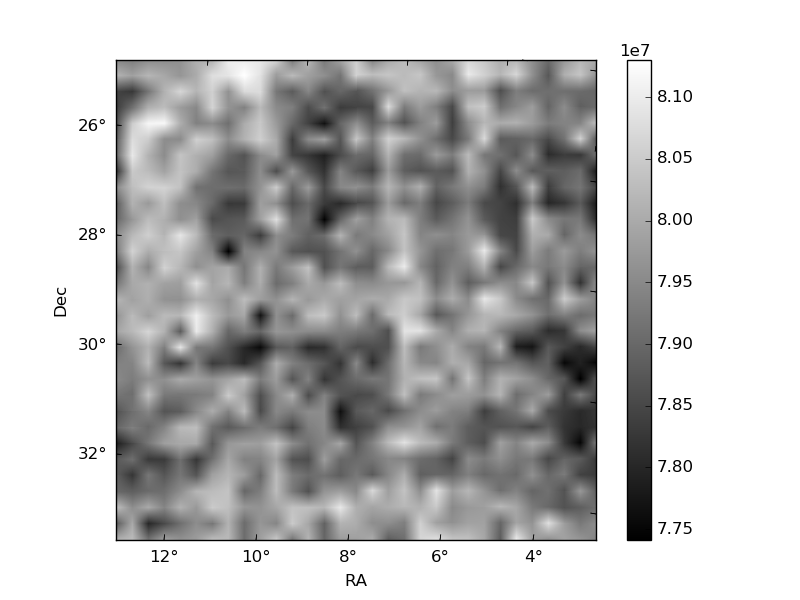
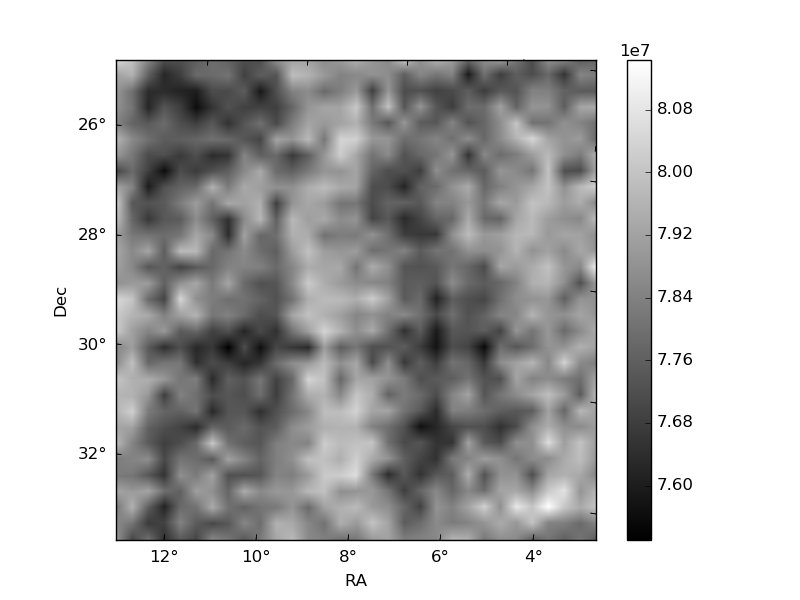
Histogram calculated using DETX and DETY for each event in the final _common_clean file
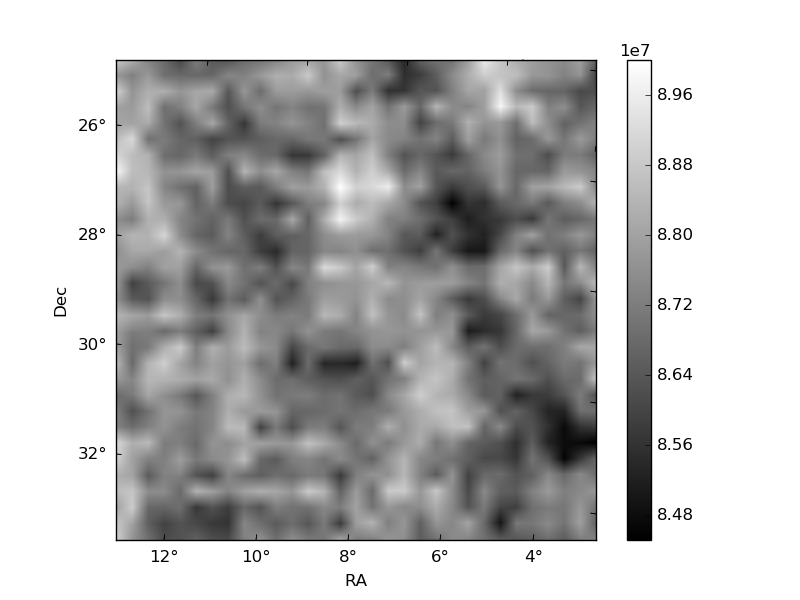
| Quadrant A | 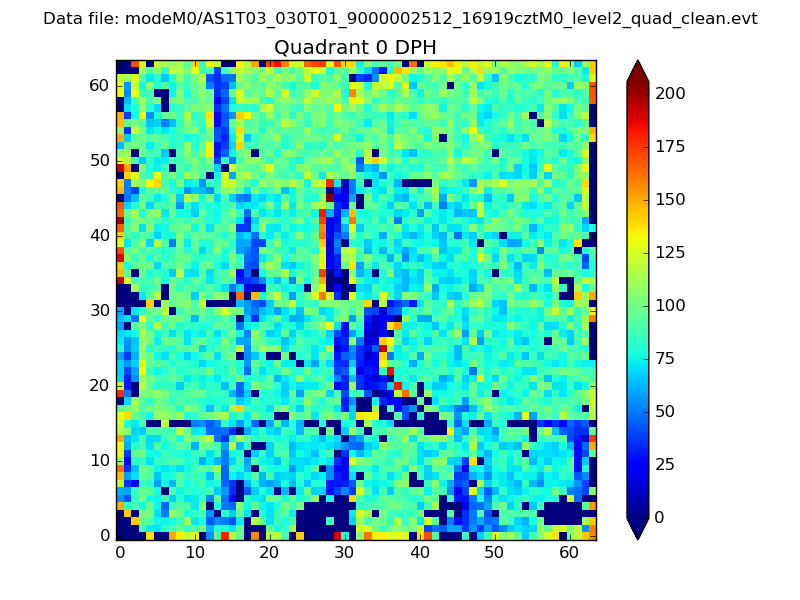 |
 |
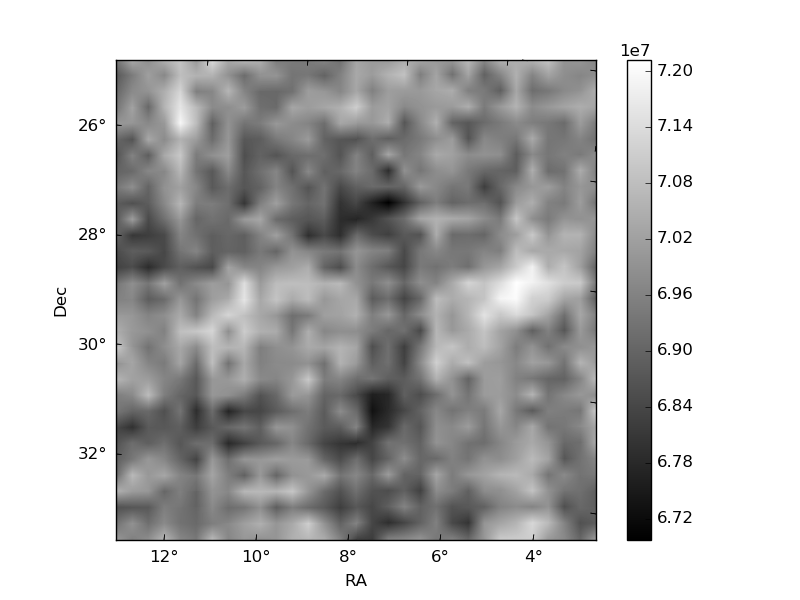
Quadrant B |
|---|---|---|---|
| Quadrant D | 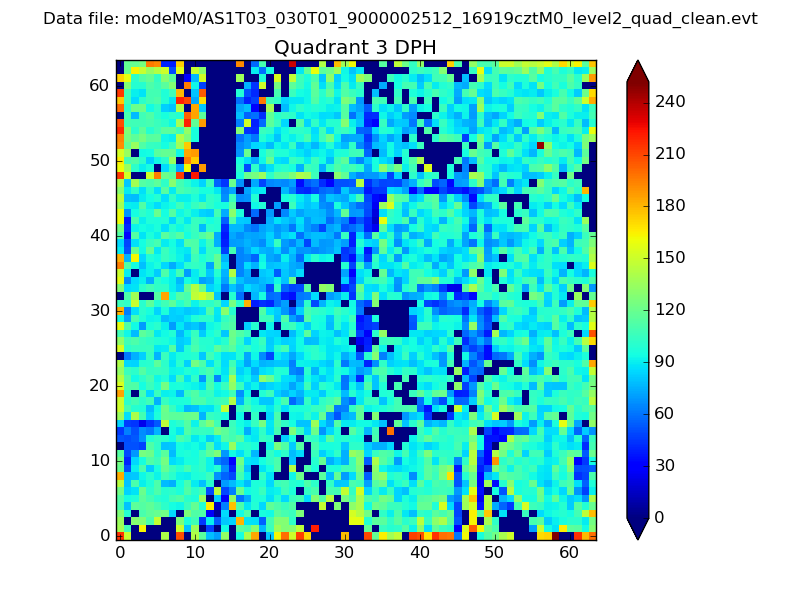 |
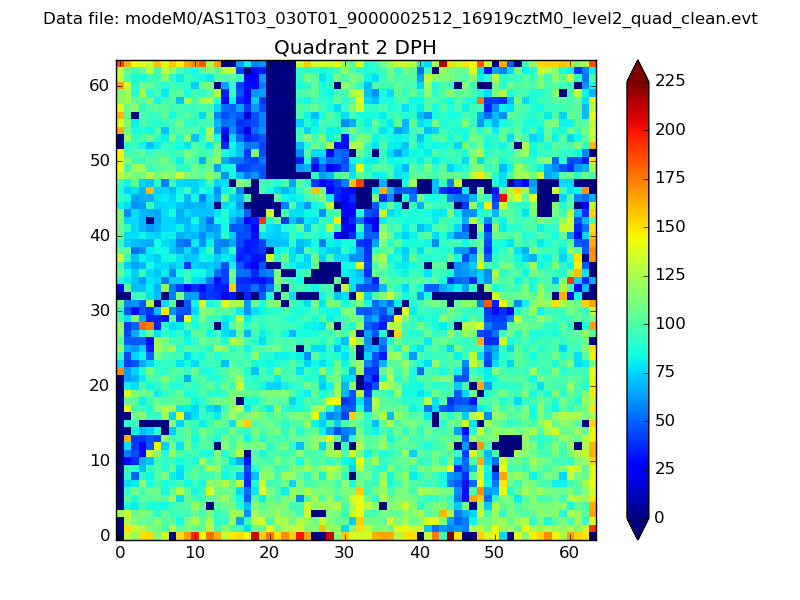 |
Quadrant C |
| Plot type | Count rate plots | Images |
|---|---|---|
| Comparison with Poisson distribution Blue bars denote a histogram of data divided into 1 sec bins. Red curve is a Poisson curve with rate = median count rate of data. |
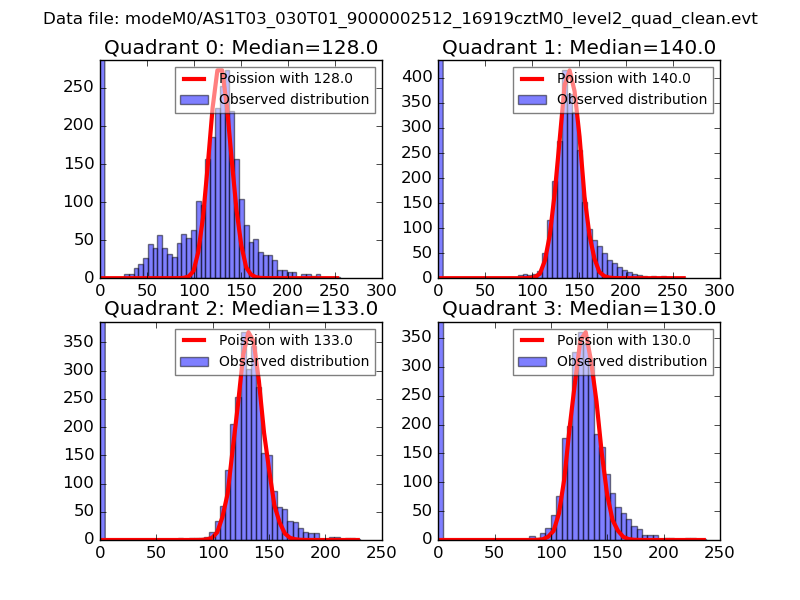 |
 |
| Quadrant-wise count rates Data is divided into 100 sec bins |
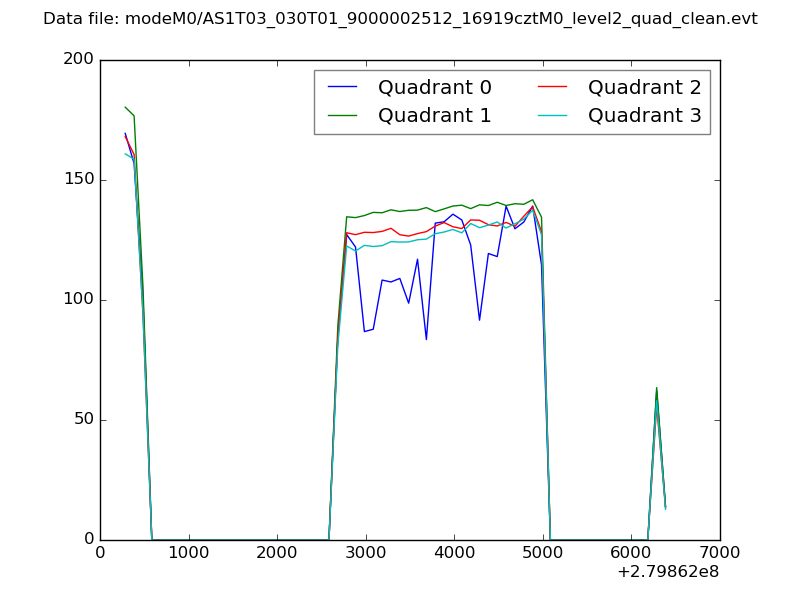 |
|
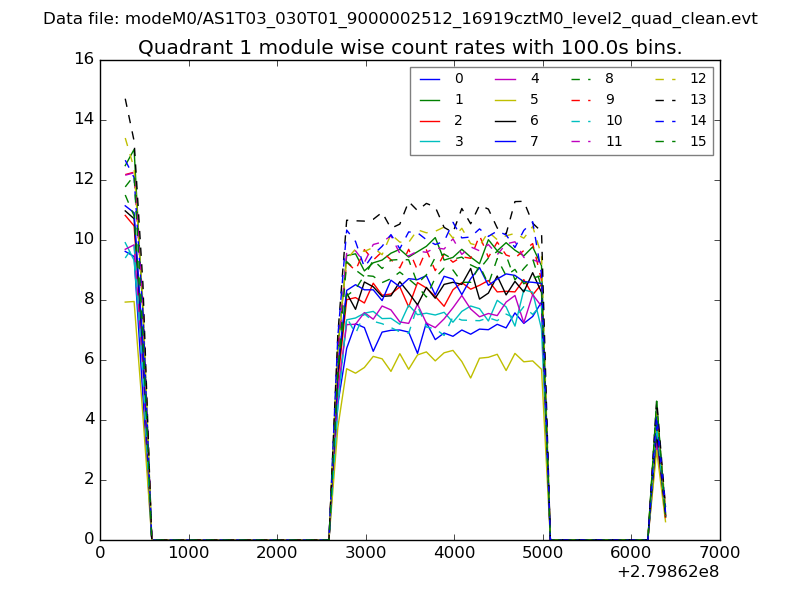
| Module-wise count rates for Quadrant A Data is divided into 100 sec bins |
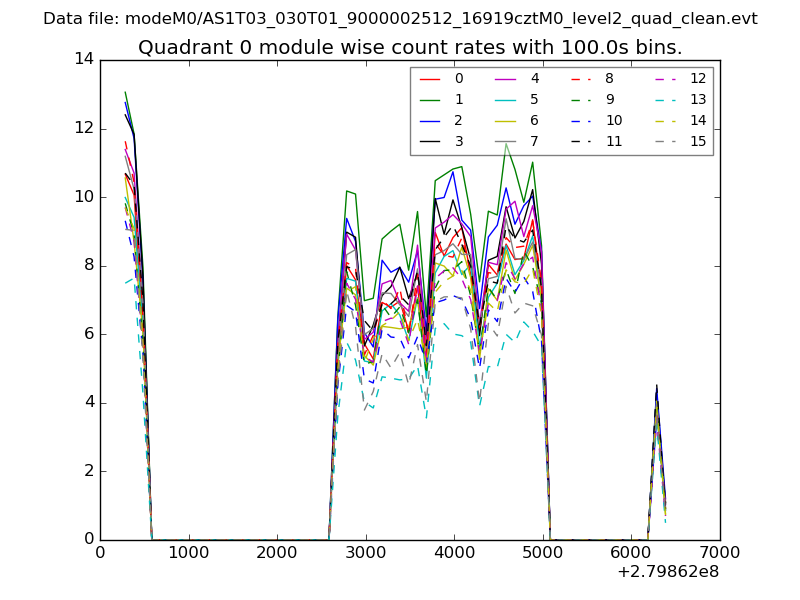 |
 |
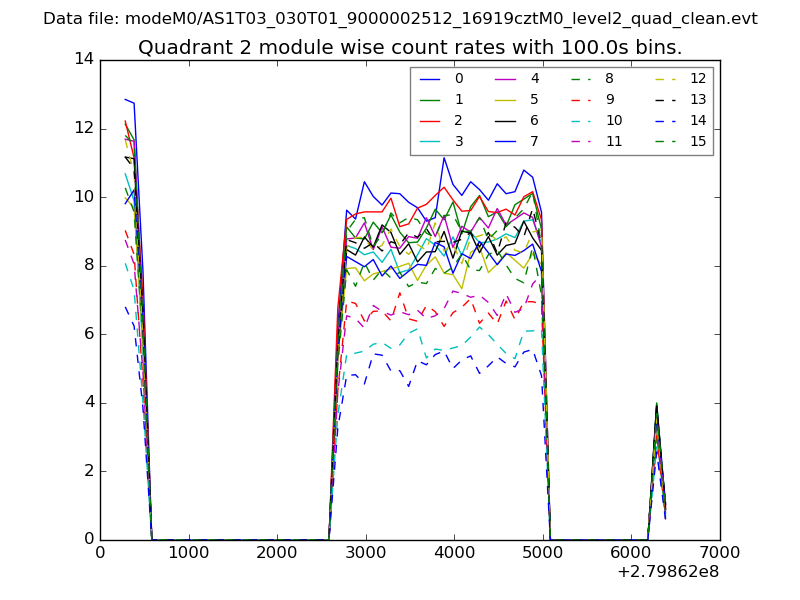
| Module-wise count rates for Quadrant B Data is divided into 100 sec bins |
 |
 |
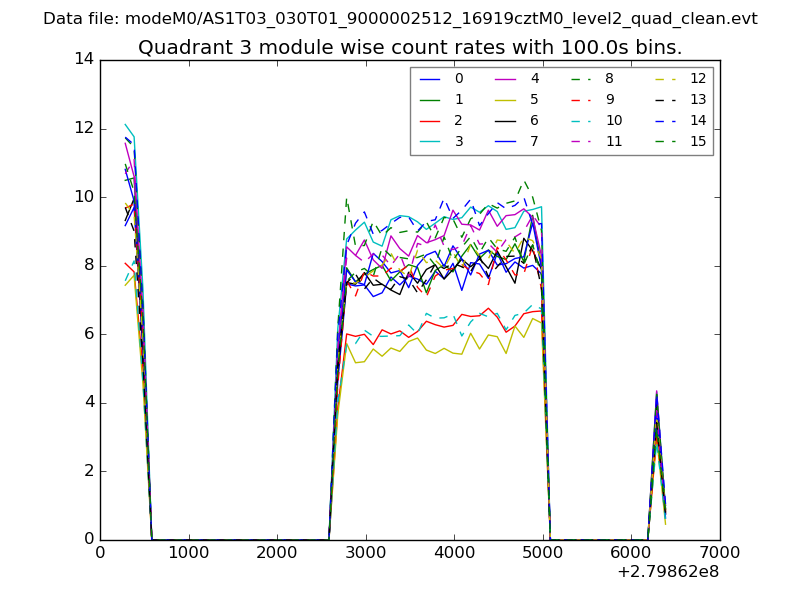
| Module-wise count rates for Quadrant C Data is divided into 100 sec bins |
 |
 |
| Module-wise count rates for Quadrant D Data is divided into 100 sec bins |
 |
 |
| Parameter | Plot |
|---|---|
| CZT HV Monitor |  |
| D_VDD | 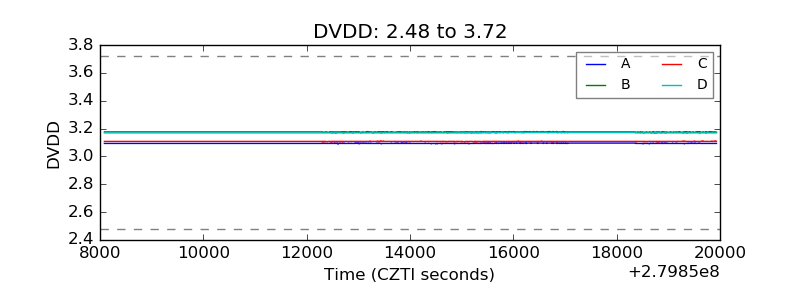 |
| Temperature 1 | 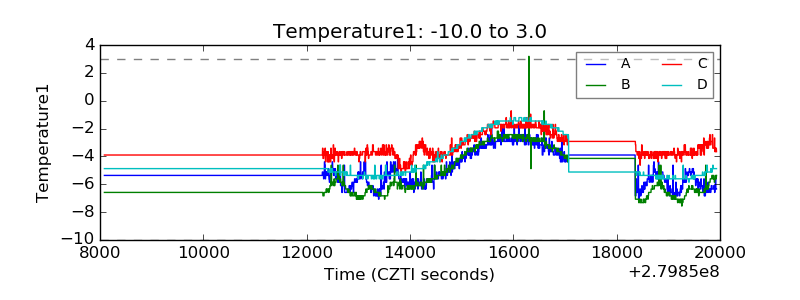 |
| Veto HV Monitor | 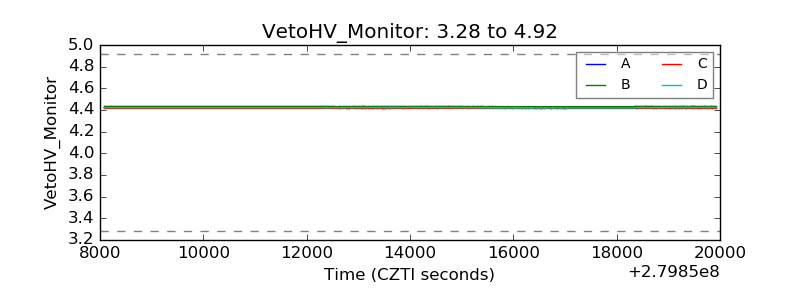 |
| Veto LLD | 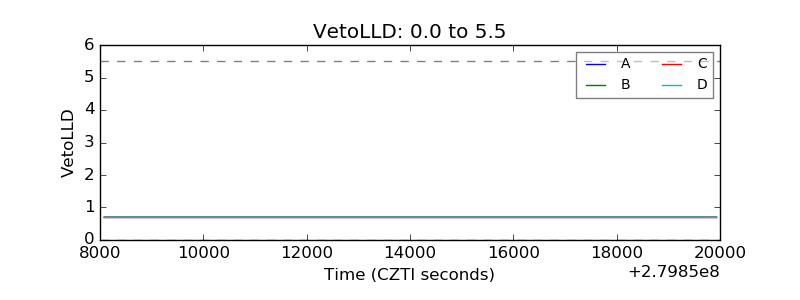 |
| Alpha Counter | 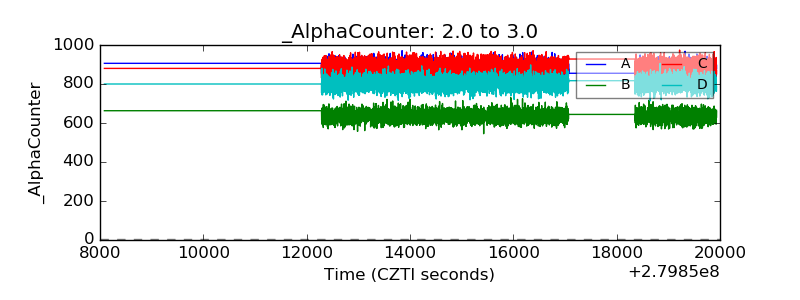 |
| _CPM_Rate | 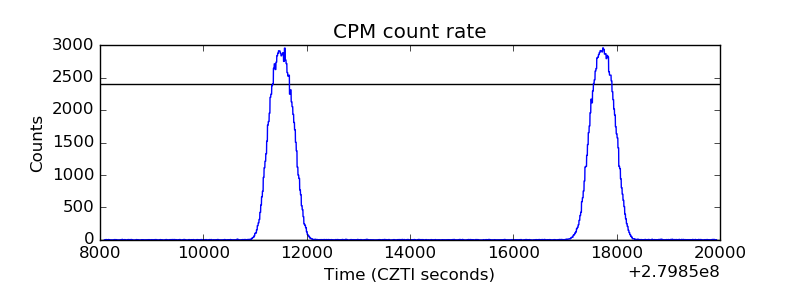 |
| CZT Counter | 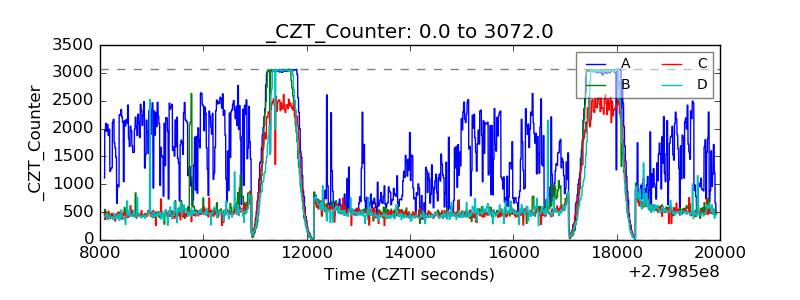 |
| +2.5 Volts monitor |  |
| +5 Volts monitor | 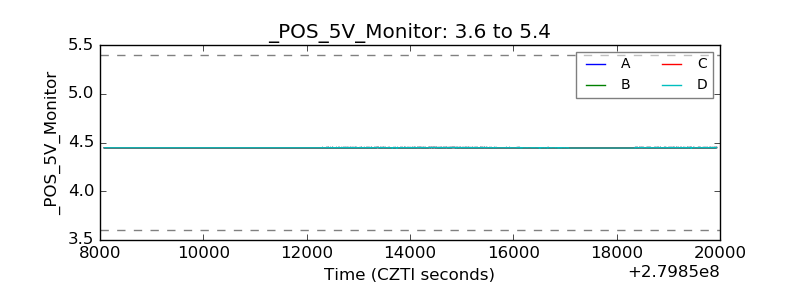 |
| _ROLL_ROT | 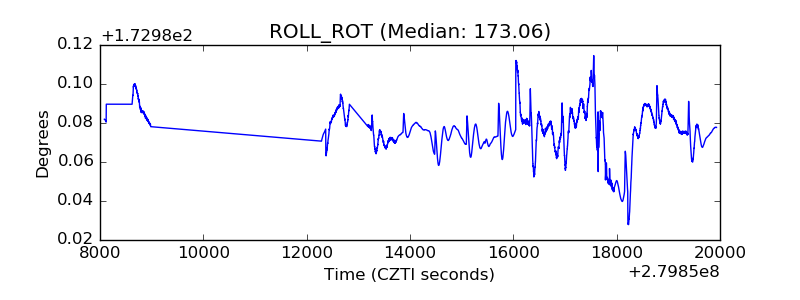 |
| _Roll_DEC | 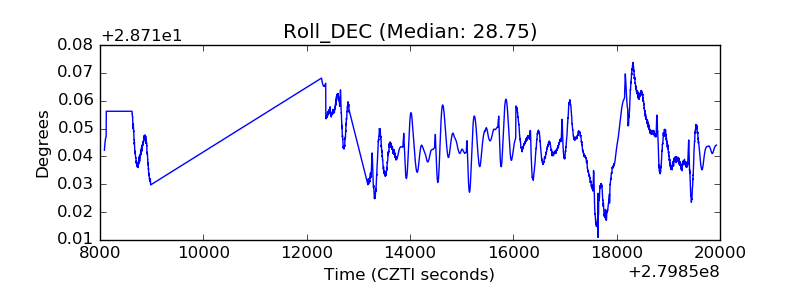 |
| _Roll_RA | 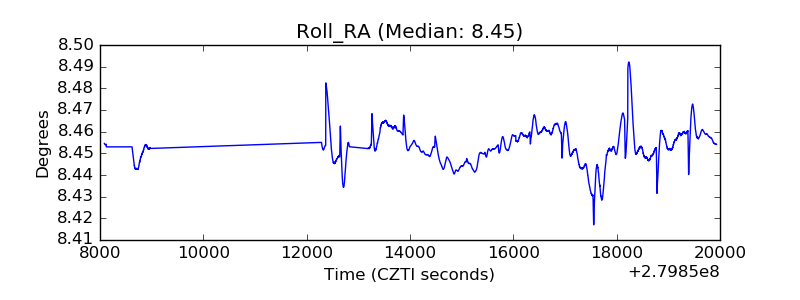 |
| Veto Counter | 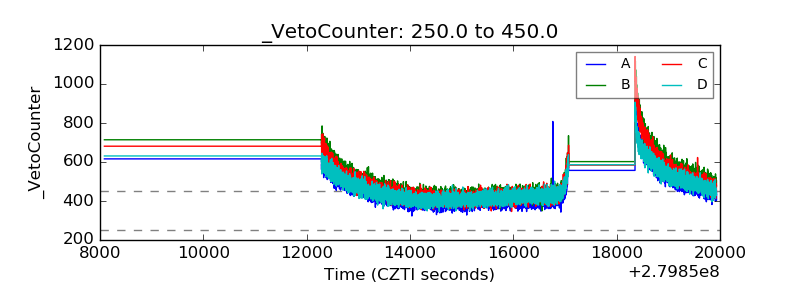 |