| Param | Original file | Final file |
|---|---|---|
| Filename | modeM0/AS1T03_030T01_9000002512_16920cztM0_level2.evt | modeM0/AS1T03_030T01_9000002512_16920cztM0_level2_quad_clean.evt |
| Size (bytes) | 737,444,160 | 36,299,520 |
| Size | 703.3 MB | 34.6 MB |
| Events in quadrant A | 11,209,357 | 141,955 |
| Events in quadrant B | 3,504,194 | 180,063 |
| Events in quadrant C | 3,385,112 | 166,550 |
| Events in quadrant D | 3,801,036 | 161,955 |
| Mode M9 | |||
|---|---|---|---|
| Quadrant | BADHDUFLAG | Total packets | Discarded packets |
| A | 0 | 13 | 0 |
| B | 0 | 13 | 0 |
| C | 0 | 13 | 0 |
| D | 0 | 13 | 0 |
| Mode M0 | |||
|---|---|---|---|
| Quadrant | BADHDUFLAG | Total packets | Discarded packets |
| A | 0 | 37773 | 2 |
| B | 0 | 14166 | 3 |
| C | 0 | 13785 | 2 |
| D | 0 | 15264 | 2 |
| Mode SS | |||
|---|---|---|---|
| Quadrant | BADHDUFLAG | Total packets | Discarded packets |
| A | 0 | 132 | 0 |
| B | 0 | 132 | 0 |
| C | 0 | 132 | 0 |
| D | 0 | 132 | 0 |
| Quadrant | Total seconds | Saturated seconds | Saturation percentage |
|---|---|---|---|
| A | 6407 | 3427 | 53.488372% |
| B | 6407 | 67 | 1.045731% |
| C | 6407 | 84 | 1.311066% |
| D | 6407 | 95 | 1.482753% |
Noise dominated data is calculated using 1-second bins in cleaned event files. If a bin has >2000 counts, and if more than 50% of those come from <1% of pixels, then it is considered to be noise-dominated and hence unusable.
| Quadrant | # 1 sec bins | Bins with >0 counts | Bins with >2000 counts | High rate bins dominated by noise | Noise dominated (total time) | Noise dominated (detector-on time) | Marked lightcurve |
|---|---|---|---|---|---|---|---|
| A | 7728 | 6409 | 2479 | 2479 | 32.08% | 38.68% | 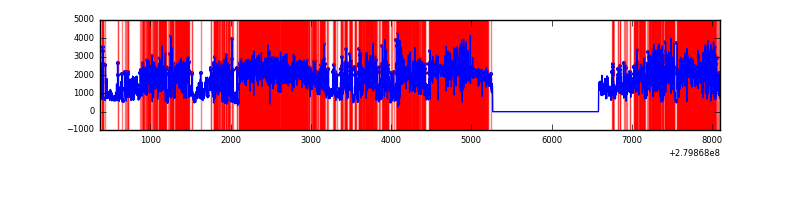 |
| B | 7728 | 6409 | 1 | 1 | 0.01% | 0.02% | 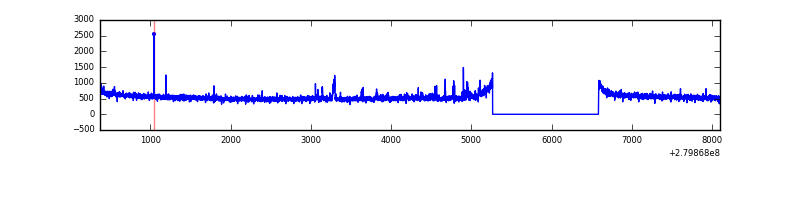 |
| C | 7728 | 6409 | 0 | 0 | 0.00% | 0.00% | 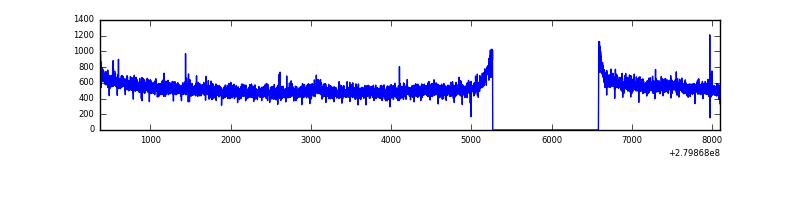 |
| D | 7728 | 6409 | 50 | 50 | 0.65% | 0.78% | 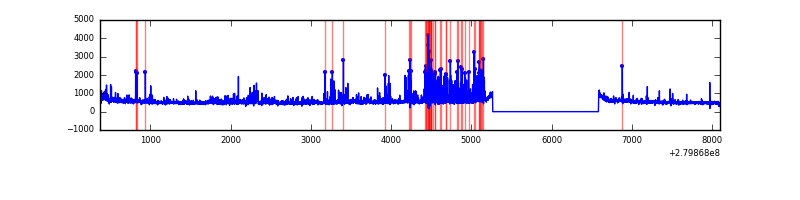 |
Top three noisy pixels from each quadrant. If the there are fewer than three noisy pixels in the level2.evt file, extra rows are filled as -1
| Pixel properties | Quadrant properties | ||||||
|---|---|---|---|---|---|---|---|
| Quadrant | DetID | PixID | Counts | Sigma | Mean | Median | Sigma |
| A | 15 | 174 | 8430040 | 58777.76 | 721 | 709 | 143.4 |
| A | 15 | 190 | 6826 | 42.65 | 721 | 709 | 143.4 |
| A | 0 | 226 | 6262 | 38.72 | 721 | 709 | 143.4 |
| B | 15 | 35 | 72116 | 432.99 | 875 | 856 | 164.6 |
| B | 12 | 111 | 18566 | 107.61 | 875 | 856 | 164.6 |
| B | 11 | 111 | 16048 | 92.31 | 875 | 856 | 164.6 |
| C | 14 | 238 | 132420 | 697.13 | 820 | 828 | 188.8 |
| C | 3 | 233 | 54128 | 282.36 | 820 | 828 | 188.8 |
| C | 13 | 61 | 5955 | 27.16 | 820 | 828 | 188.8 |
| D | 1 | 52 | 472970 | 2353.44 | 826 | 802 | 200.6 |
| D | 2 | 152 | 107603 | 532.33 | 826 | 802 | 200.6 |
| D | 12 | 235 | 92194 | 455.53 | 826 | 802 | 200.6 |
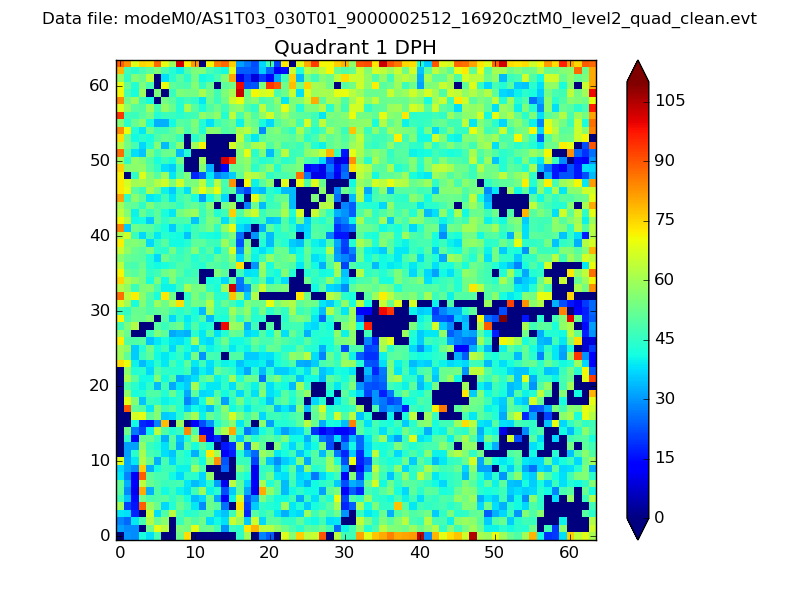
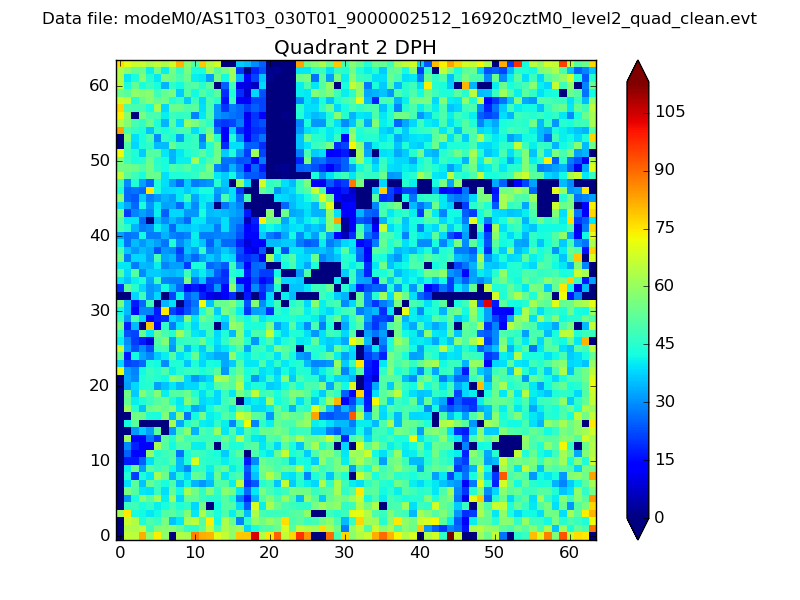
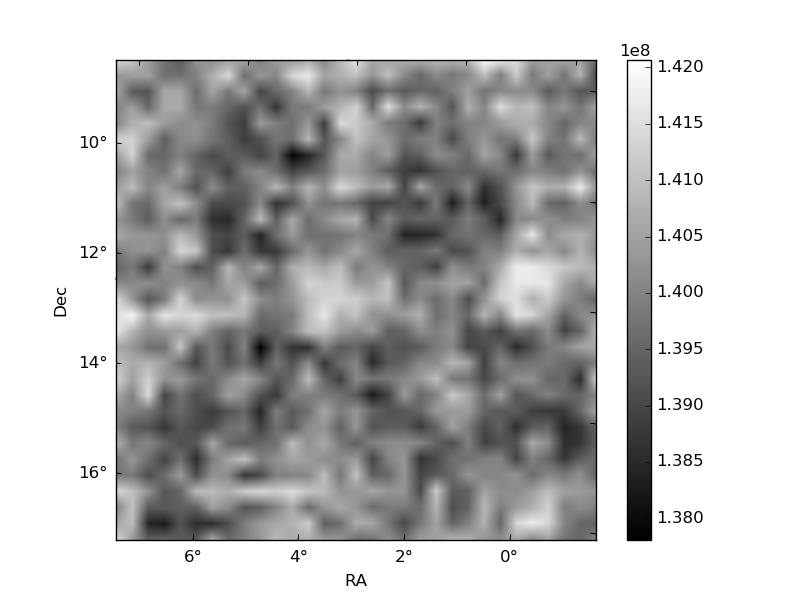
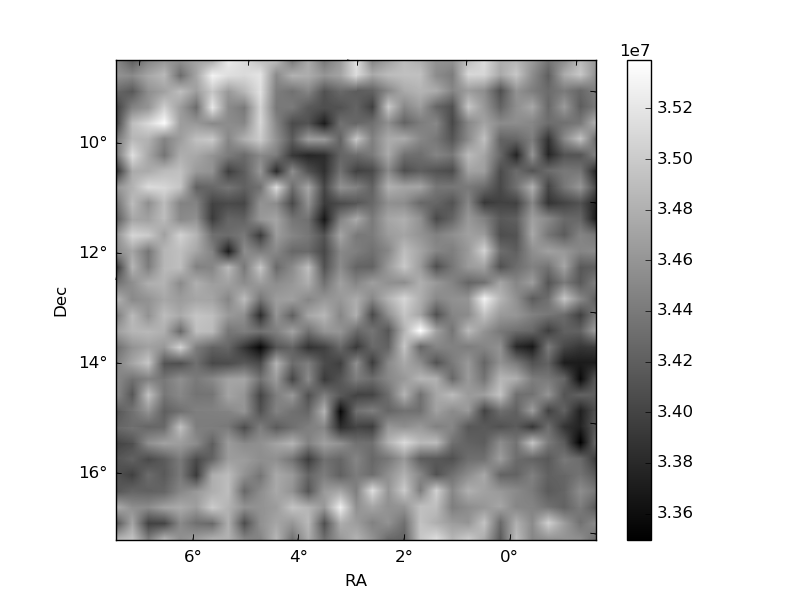
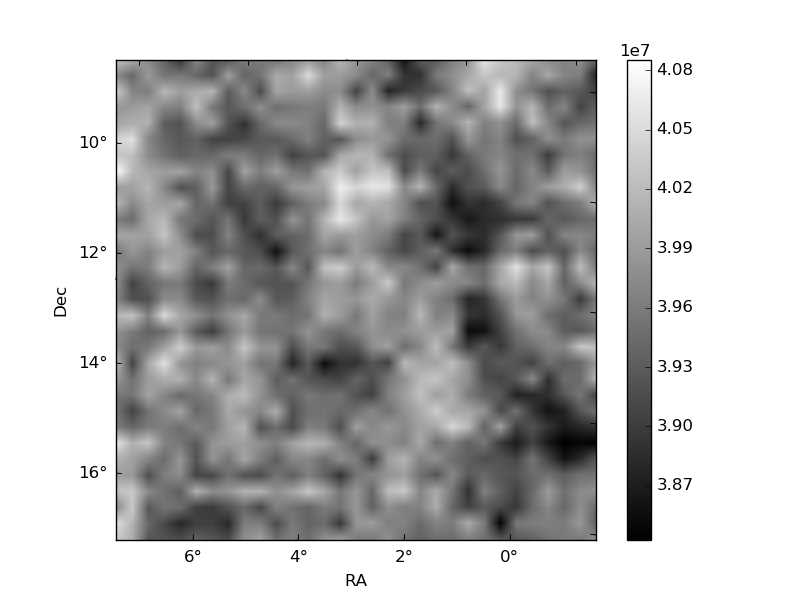
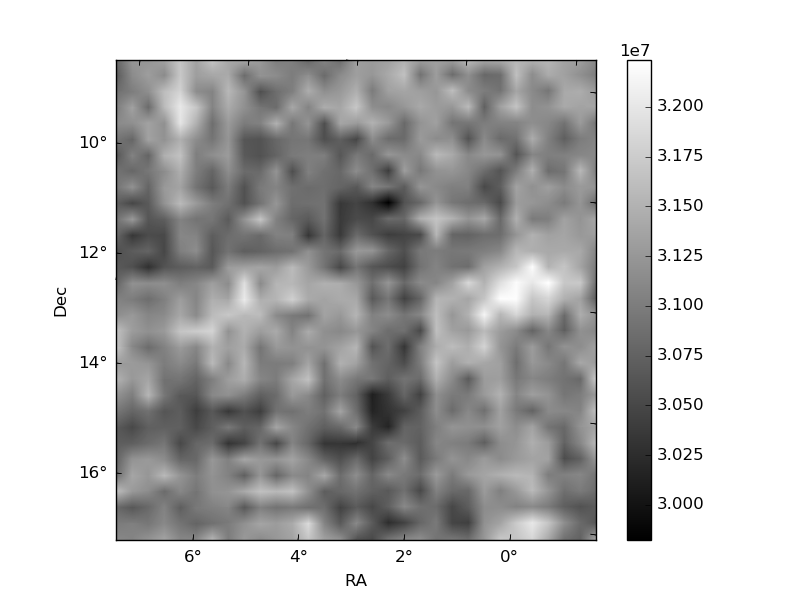
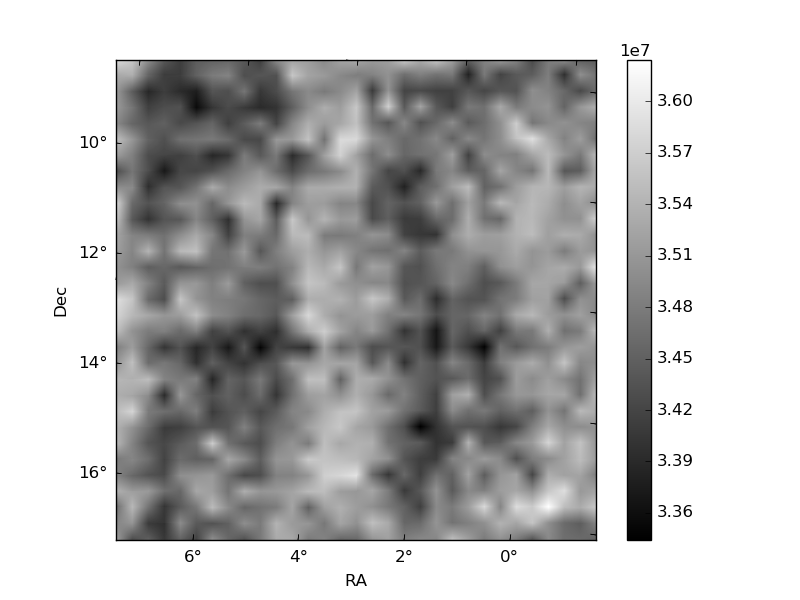
Histogram calculated using DETX and DETY for each event in the final _common_clean file
| Quadrant A |  |
 |
Quadrant B |
|---|---|---|---|
| Quadrant D | 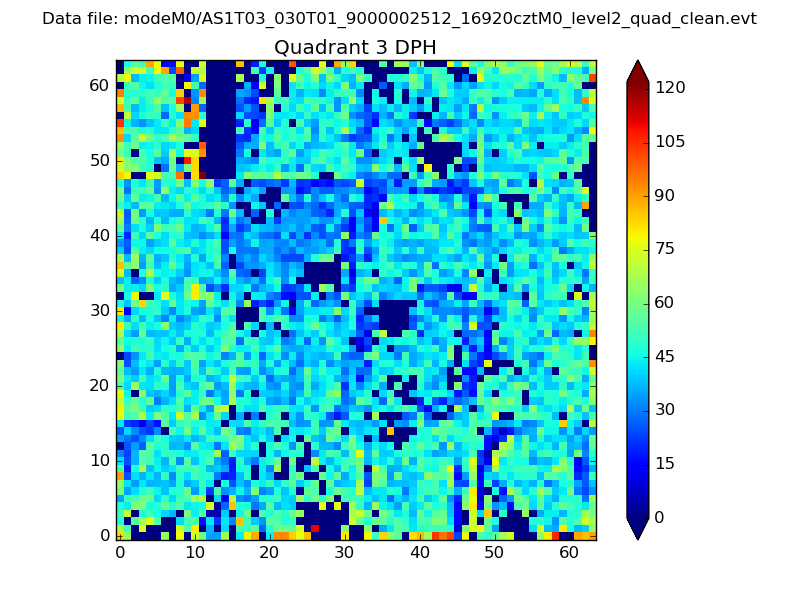 |
 |
Quadrant C |
| Plot type | Count rate plots | Images |
|---|---|---|
| Comparison with Poisson distribution Blue bars denote a histogram of data divided into 1 sec bins. Red curve is a Poisson curve with rate = median count rate of data. |
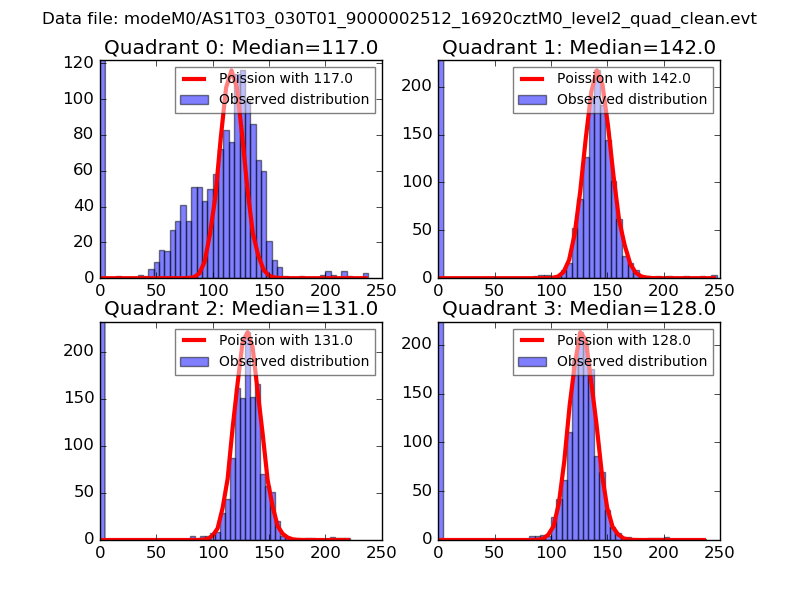 |
 |
| Quadrant-wise count rates Data is divided into 100 sec bins |
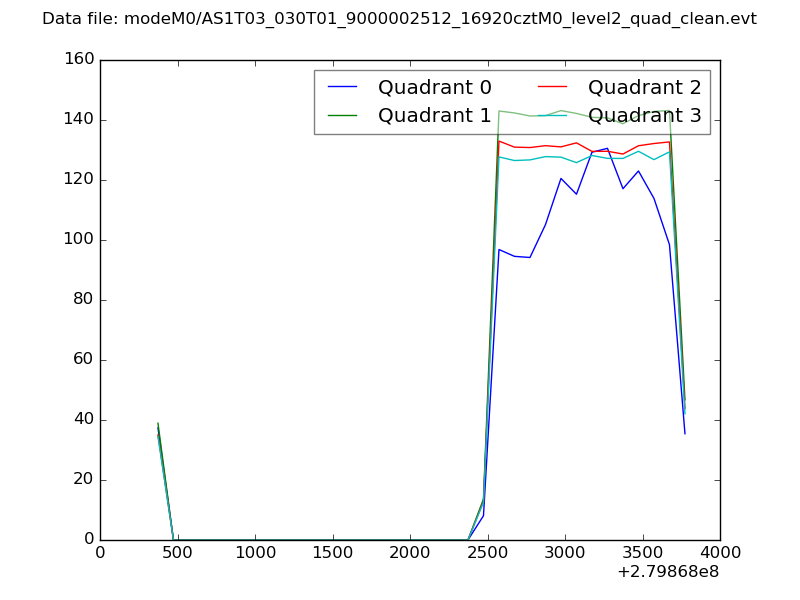 |
|
| Module-wise count rates for Quadrant A Data is divided into 100 sec bins |
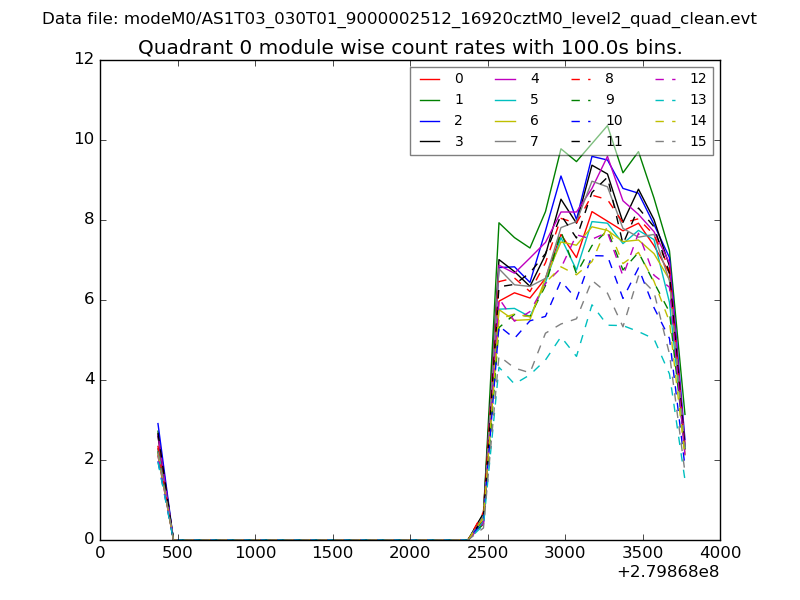 |
 |
| Module-wise count rates for Quadrant B Data is divided into 100 sec bins |
 |
 |
| Module-wise count rates for Quadrant C Data is divided into 100 sec bins |
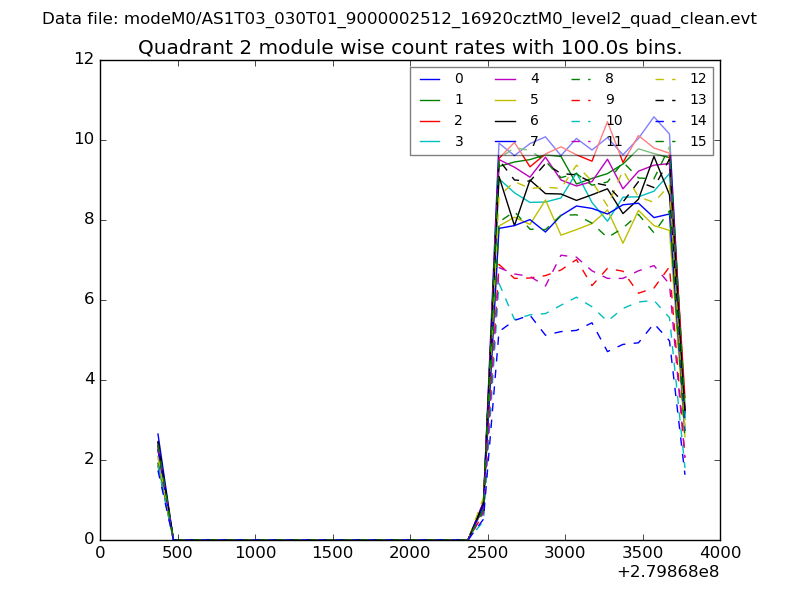 |
 |
| Module-wise count rates for Quadrant D Data is divided into 100 sec bins |
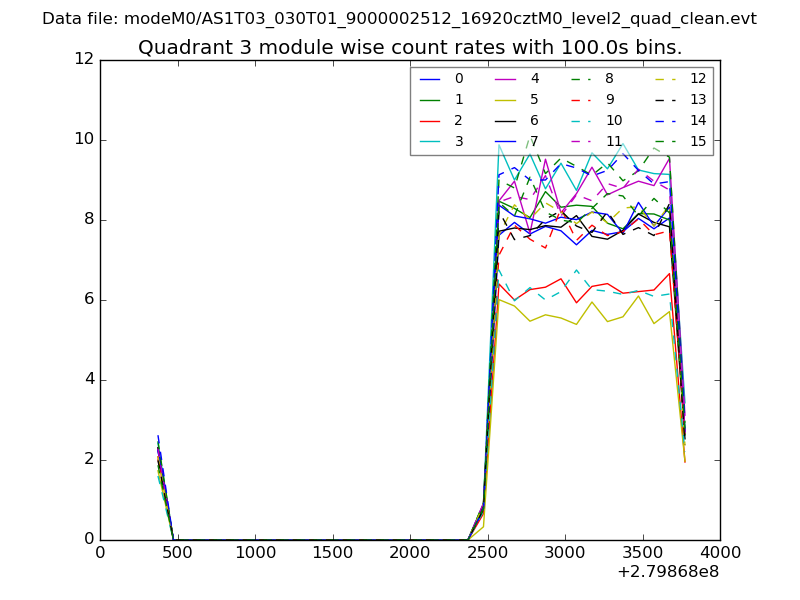 |
 |
| Parameter | Plot |
|---|---|
| CZT HV Monitor | 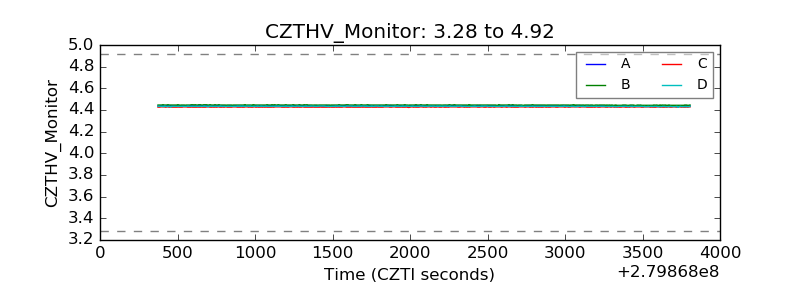 |
| D_VDD | 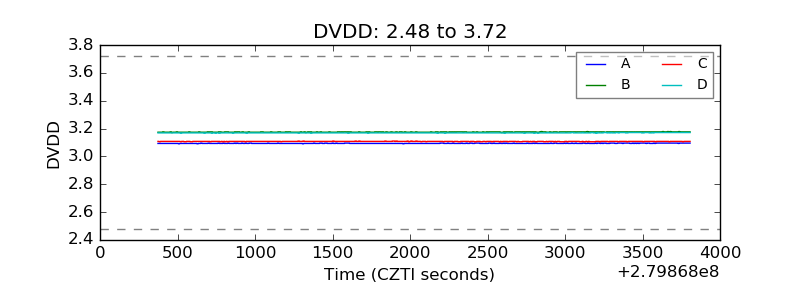 |
| Temperature 1 | 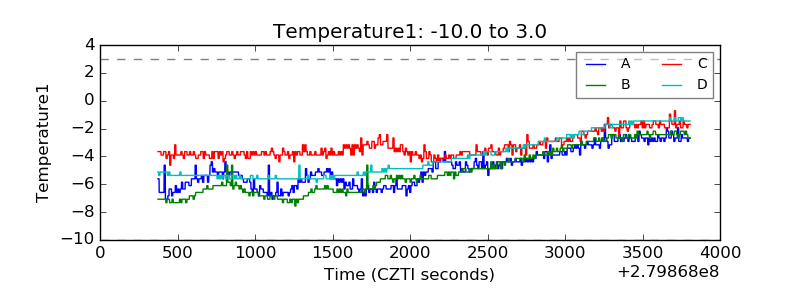 |
| Veto HV Monitor | 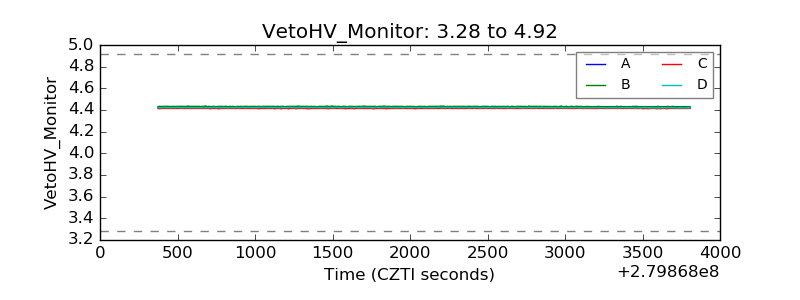 |
| Veto LLD | 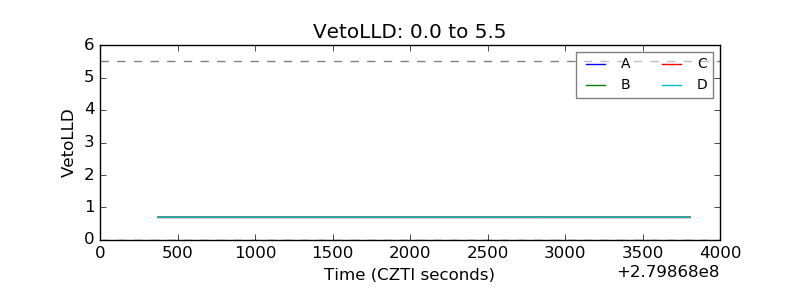 |
| Alpha Counter | 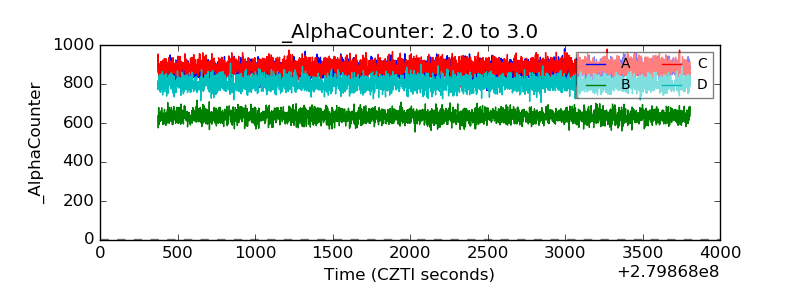 |
| _CPM_Rate | 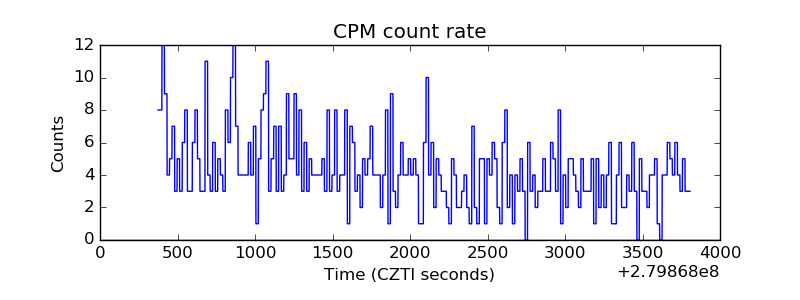 |
| CZT Counter | 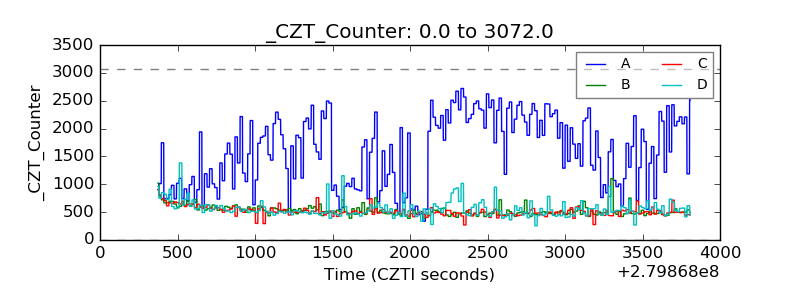 |
| +2.5 Volts monitor |  |
| +5 Volts monitor | 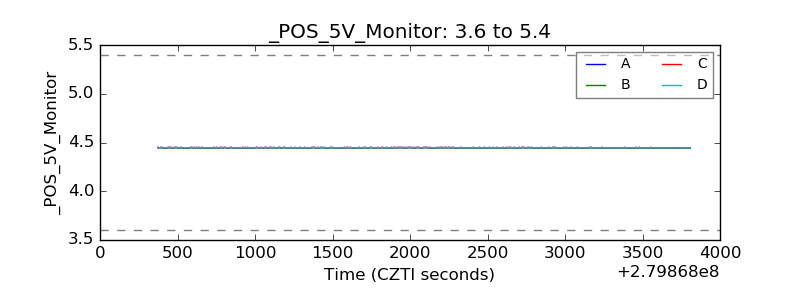 |
| _ROLL_ROT | 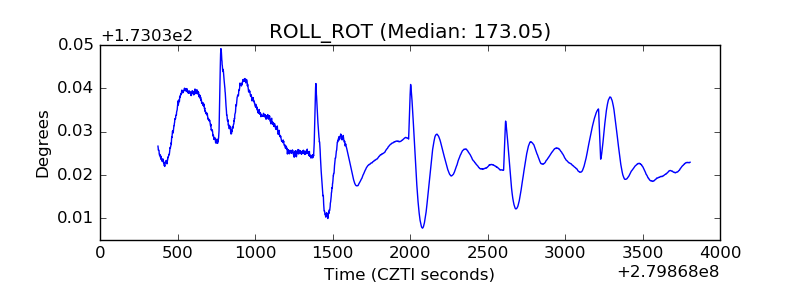 |
| _Roll_DEC | 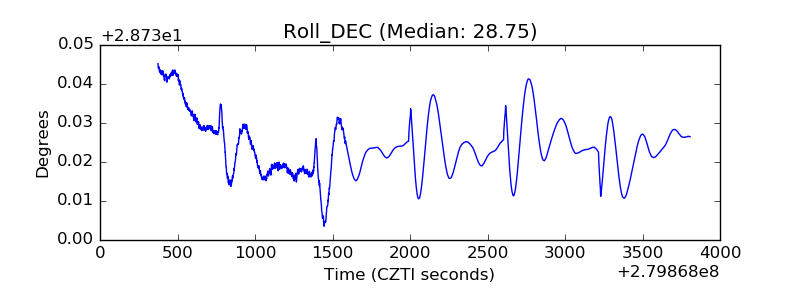 |
| _Roll_RA | 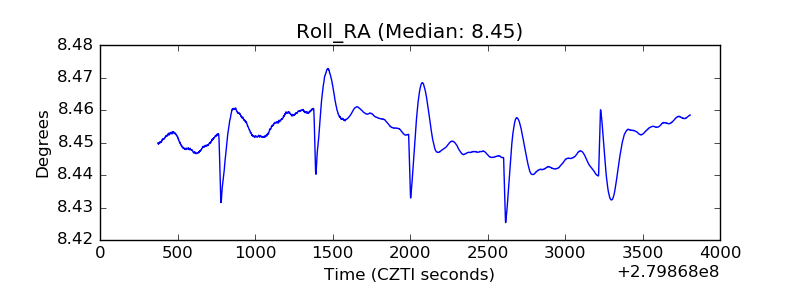 |
| Veto Counter | 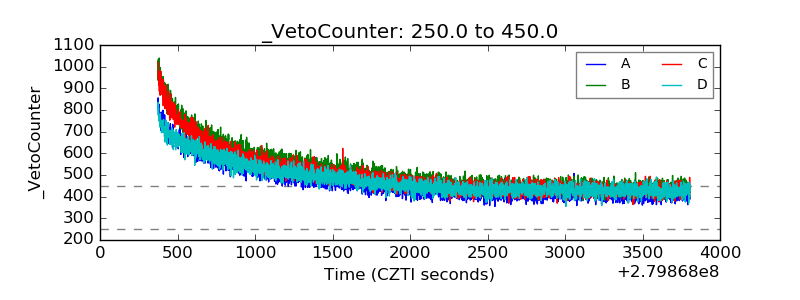 |