| Param | Original file | Final file |
|---|---|---|
| Filename | modeM0/AS1T03_030T01_9000002512_16921cztM0_level2.evt | modeM0/AS1T03_030T01_9000002512_16921cztM0_level2_quad_clean.evt |
| Size (bytes) | 600,946,560 | 70,260,480 |
| Size | 573.1 MB | 67.0 MB |
| Events in quadrant A | 7,053,740 | 430,216 |
| Events in quadrant B | 3,409,448 | 450,717 |
| Events in quadrant C | 3,417,981 | 422,124 |
| Events in quadrant D | 3,895,678 | 388,634 |
| Mode M9 | |||
|---|---|---|---|
| Quadrant | BADHDUFLAG | Total packets | Discarded packets |
| A | 0 | 17 | 0 |
| B | 0 | 18 | 0 |
| C | 0 | 18 | 0 |
| D | 0 | 18 | 0 |
| Mode M0 | |||
|---|---|---|---|
| Quadrant | BADHDUFLAG | Total packets | Discarded packets |
| A | 0 | 25151 | 2 |
| B | 0 | 13775 | 2 |
| C | 0 | 13703 | 2 |
| D | 0 | 15413 | 2 |
| Mode SS | |||
|---|---|---|---|
| Quadrant | BADHDUFLAG | Total packets | Discarded packets |
| A | 0 | 128 | 0 |
| B | 0 | 128 | 0 |
| C | 0 | 128 | 0 |
| D | 0 | 128 | 0 |
| Quadrant | Total seconds | Saturated seconds | Saturation percentage |
|---|---|---|---|
| A | 6234 | 1404 | 22.521655% |
| B | 6234 | 124 | 1.989092% |
| C | 6233 | 126 | 2.021498% |
| D | 6233 | 397 | 6.369325% |
Noise dominated data is calculated using 1-second bins in cleaned event files. If a bin has >2000 counts, and if more than 50% of those come from <1% of pixels, then it is considered to be noise-dominated and hence unusable.
| Quadrant | # 1 sec bins | Bins with >0 counts | Bins with >2000 counts | High rate bins dominated by noise | Noise dominated (total time) | Noise dominated (detector-on time) | Marked lightcurve |
|---|---|---|---|---|---|---|---|
| A | 7530 | 6236 | 846 | 846 | 11.24% | 13.57% | 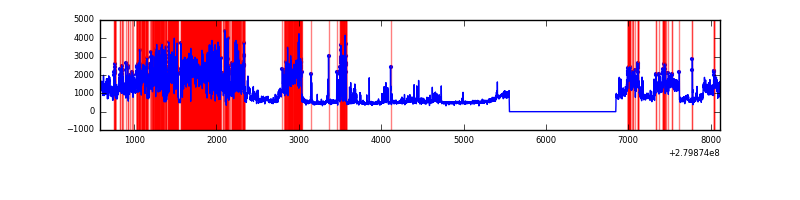 |
| B | 7530 | 6236 | 3 | 3 | 0.04% | 0.05% | 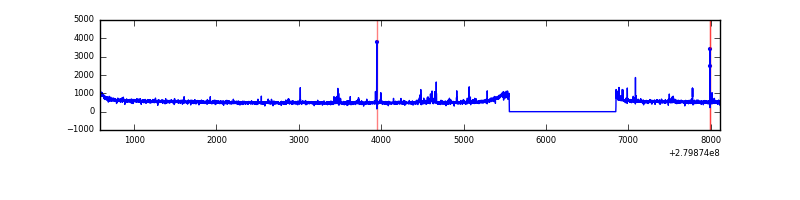 |
| C | 7529 | 6235 | 0 | 0 | 0.00% | 0.00% | 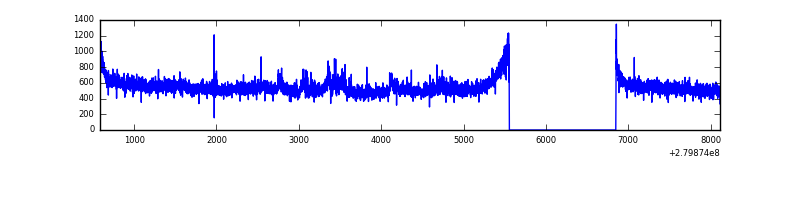 |
| D | 7529 | 6235 | 62 | 62 | 0.82% | 0.99% | 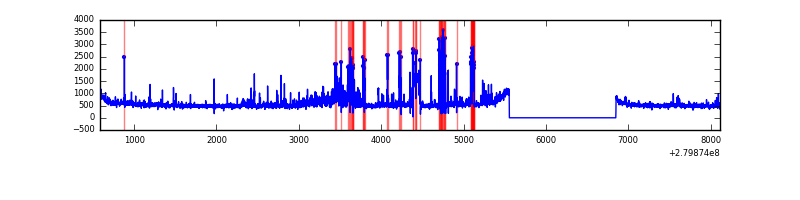 |
Top three noisy pixels from each quadrant. If the there are fewer than three noisy pixels in the level2.evt file, extra rows are filled as -1
| Pixel properties | Quadrant properties | ||||||
|---|---|---|---|---|---|---|---|
| Quadrant | DetID | PixID | Counts | Sigma | Mean | Median | Sigma |
| A | 15 | 174 | 4016764 | 25632.06 | 790 | 776 | 156.7 |
| A | 0 | 226 | 7049 | 40.04 | 790 | 776 | 156.7 |
| A | 12 | 194 | 5746 | 31.72 | 790 | 776 | 156.7 |
| B | 15 | 35 | 43219 | 262.97 | 848 | 829 | 161.2 |
| B | 3 | 64 | 25051 | 150.26 | 848 | 829 | 161.2 |
| B | 0 | 197 | 23574 | 141.1 | 848 | 829 | 161.2 |
| C | 3 | 233 | 185592 | 1004.28 | 796 | 803 | 184.0 |
| C | 14 | 238 | 125170 | 675.91 | 796 | 803 | 184.0 |
| C | 13 | 61 | 5615 | 26.15 | 796 | 803 | 184.0 |
| D | 1 | 52 | 776547 | 4119.43 | 784 | 763 | 188.3 |
| D | 2 | 152 | 76828 | 403.91 | 784 | 763 | 188.3 |
| D | 12 | 235 | 48124 | 251.49 | 784 | 763 | 188.3 |
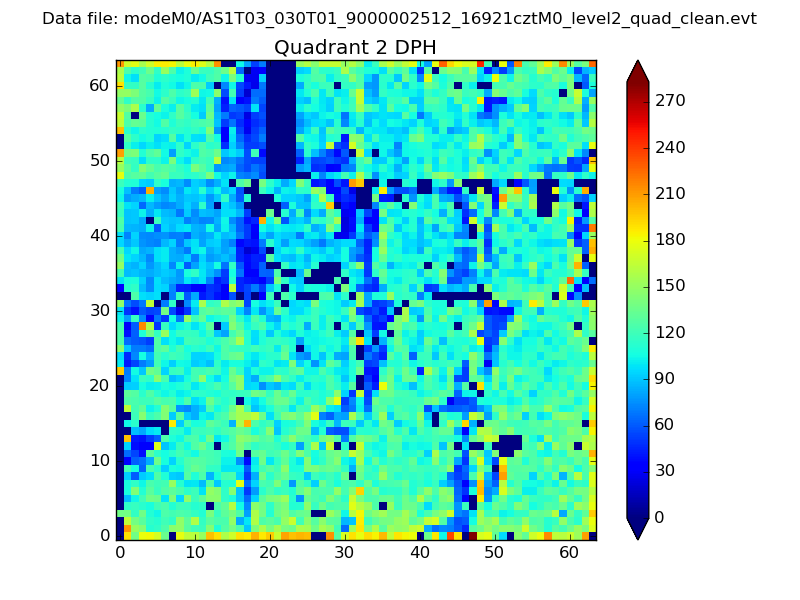
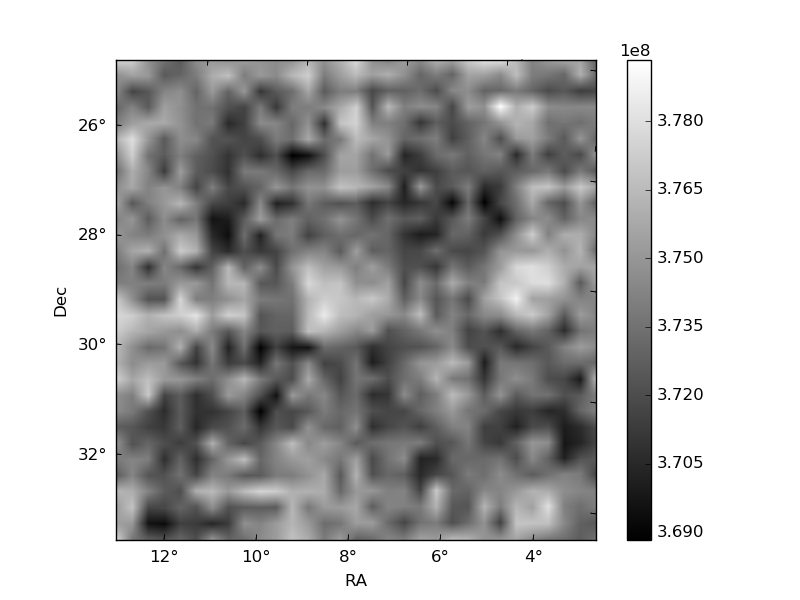
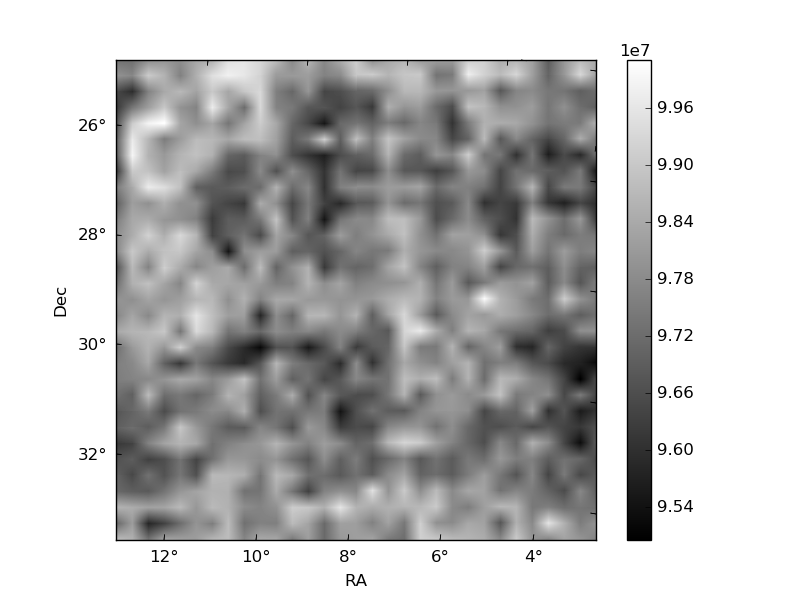
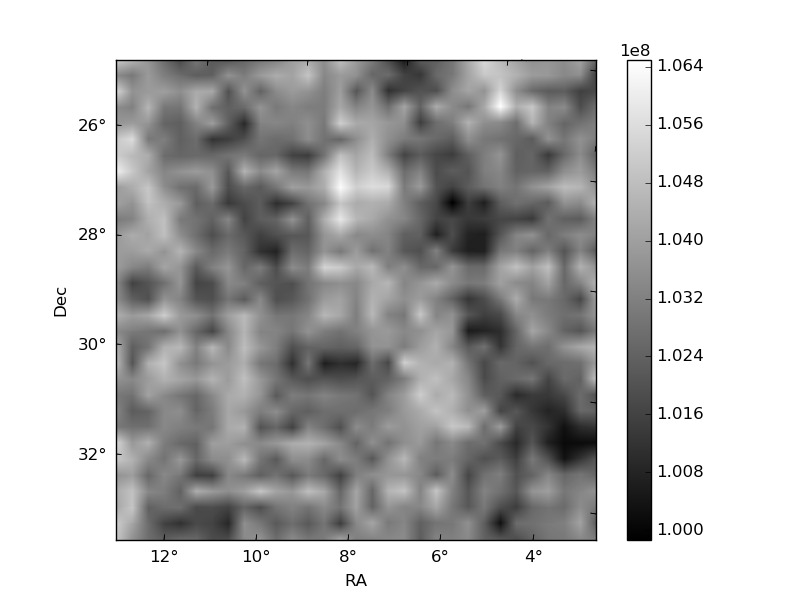
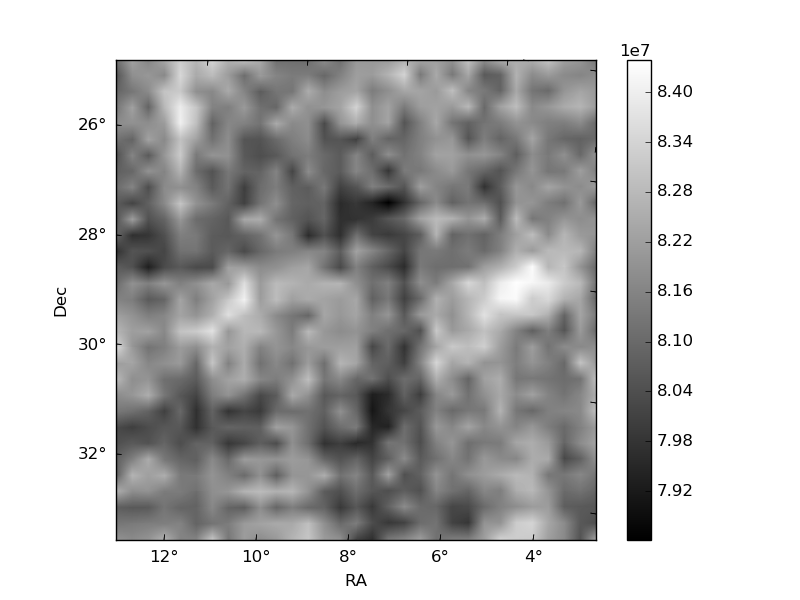
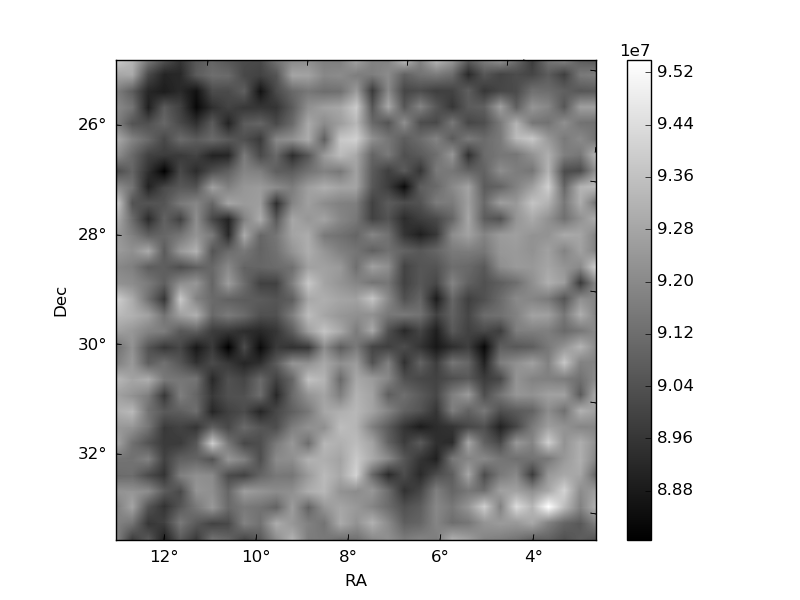
Histogram calculated using DETX and DETY for each event in the final _common_clean file
| Quadrant A | 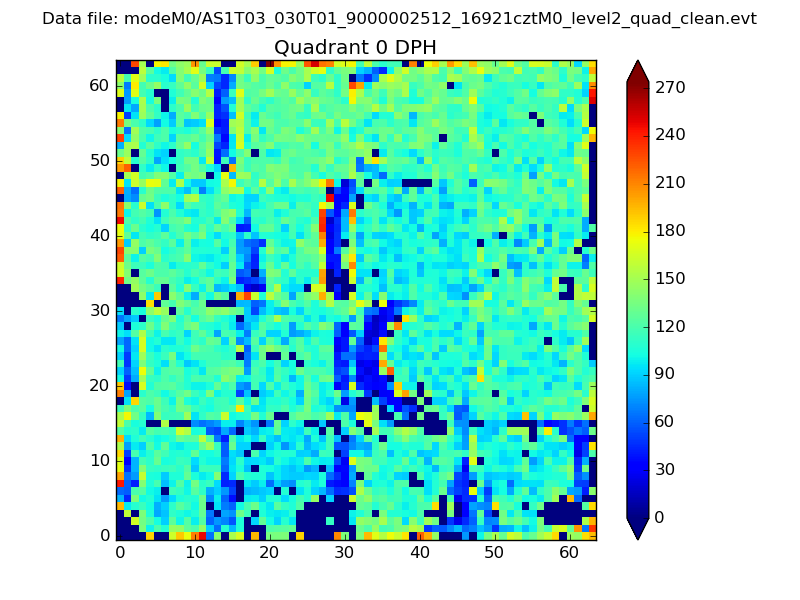 |
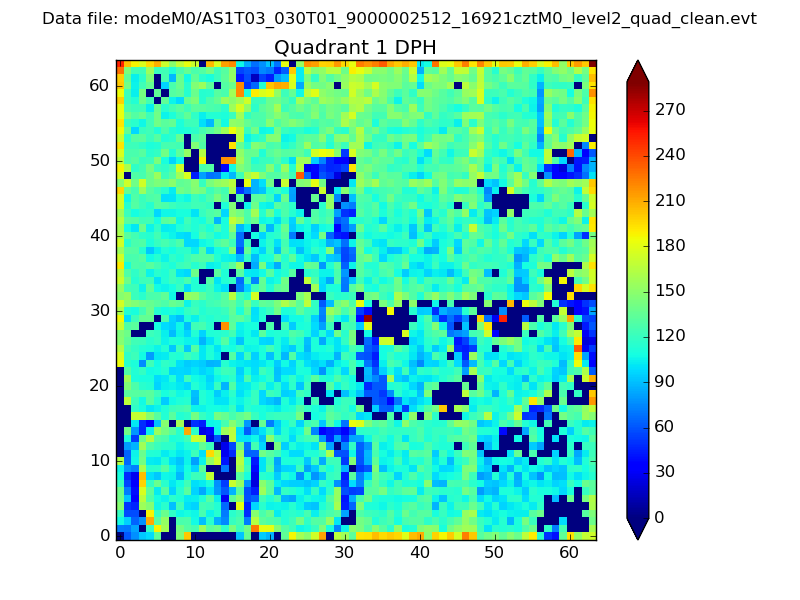 |
Quadrant B |
|---|---|---|---|
| Quadrant D | 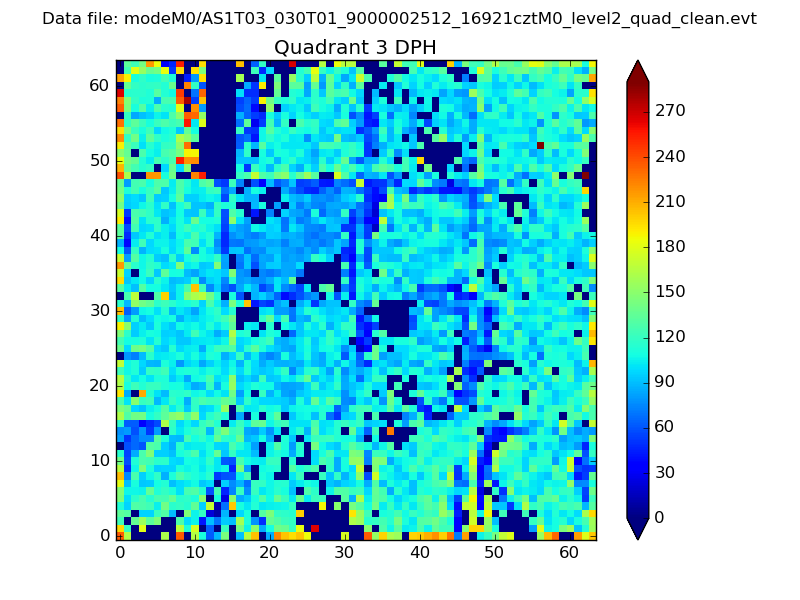 |
 |
Quadrant C |
| Plot type | Count rate plots | Images |
|---|---|---|
| Comparison with Poisson distribution Blue bars denote a histogram of data divided into 1 sec bins. Red curve is a Poisson curve with rate = median count rate of data. |
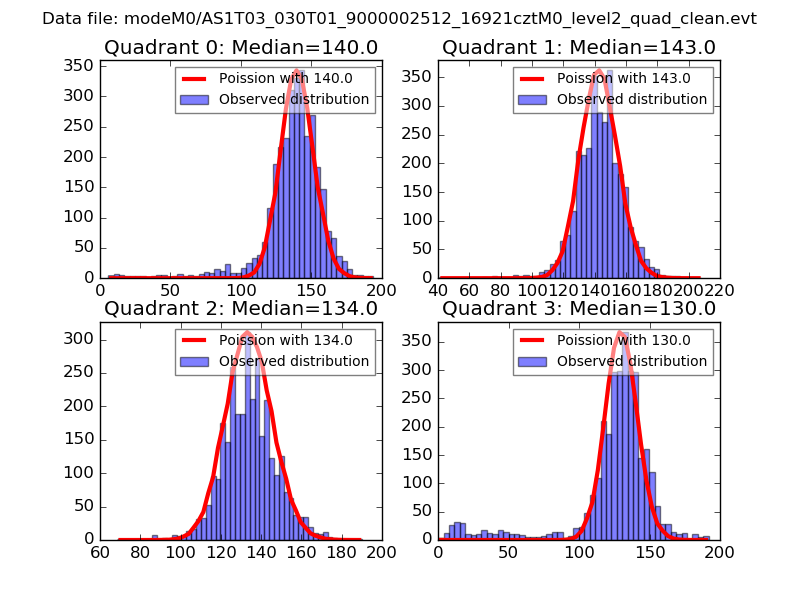 |
 |
| Quadrant-wise count rates Data is divided into 100 sec bins |
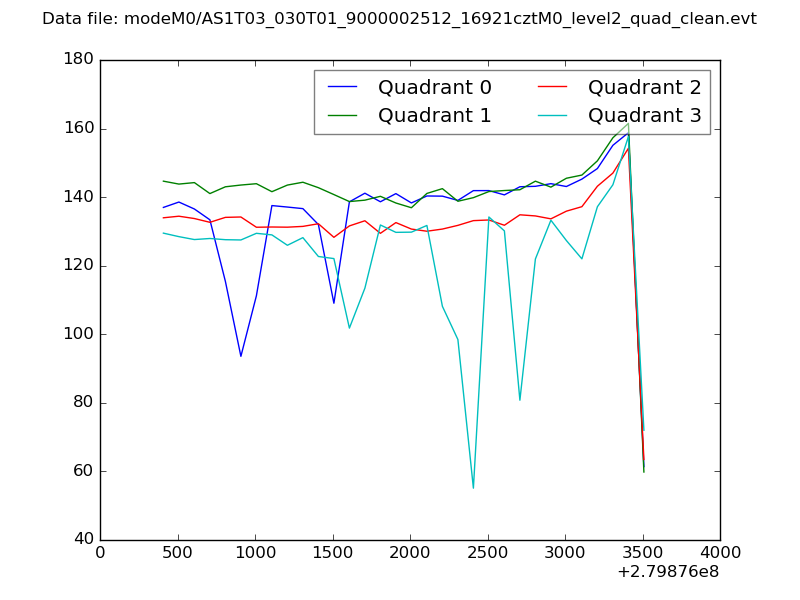 |
|
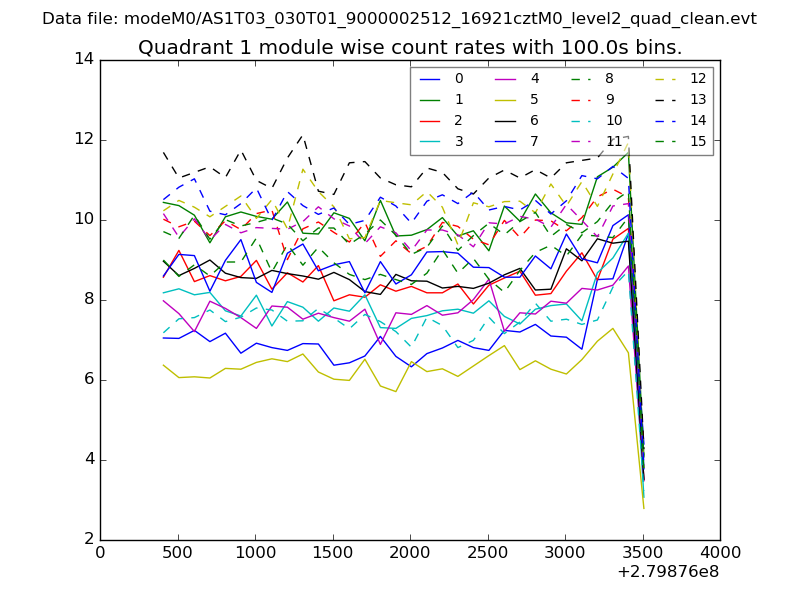
| Module-wise count rates for Quadrant A Data is divided into 100 sec bins |
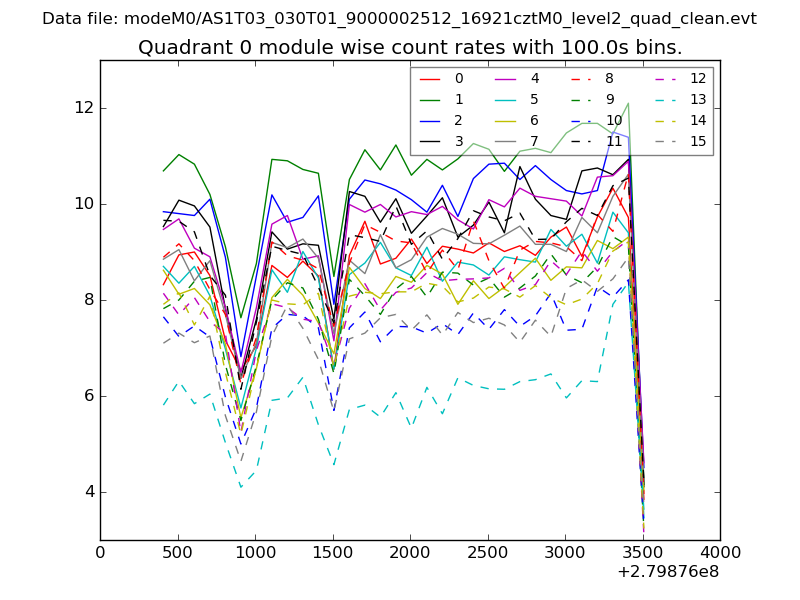 |
 |
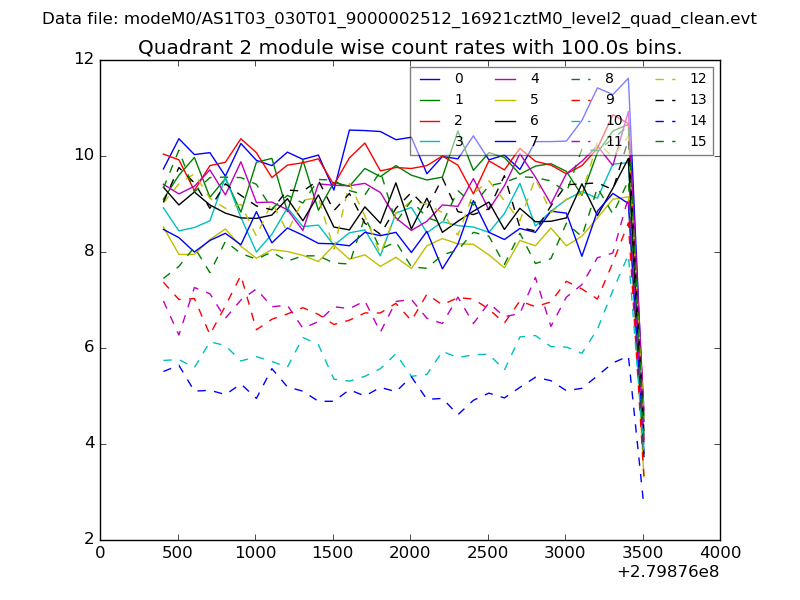
| Module-wise count rates for Quadrant B Data is divided into 100 sec bins |
 |
 |
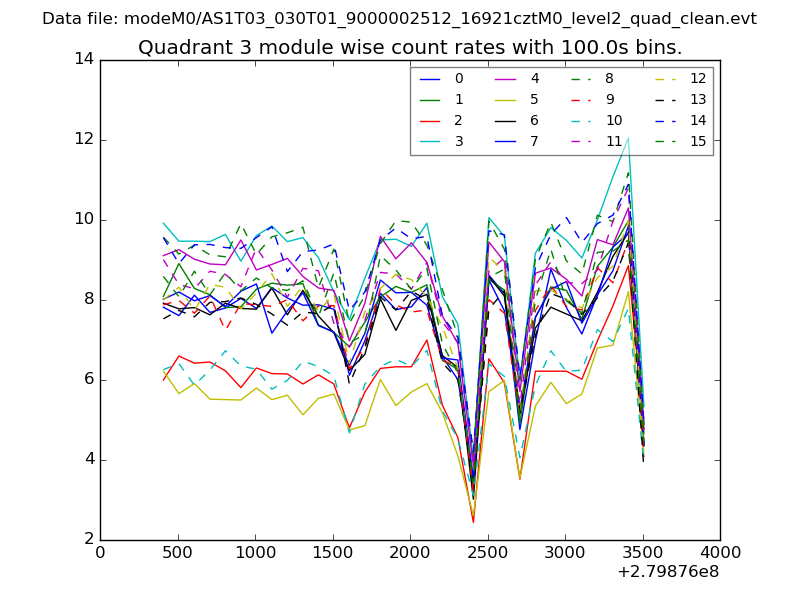
| Module-wise count rates for Quadrant C Data is divided into 100 sec bins |
 |
 |
| Module-wise count rates for Quadrant D Data is divided into 100 sec bins |
 |
 |
| Parameter | Plot |
|---|---|
| CZT HV Monitor | 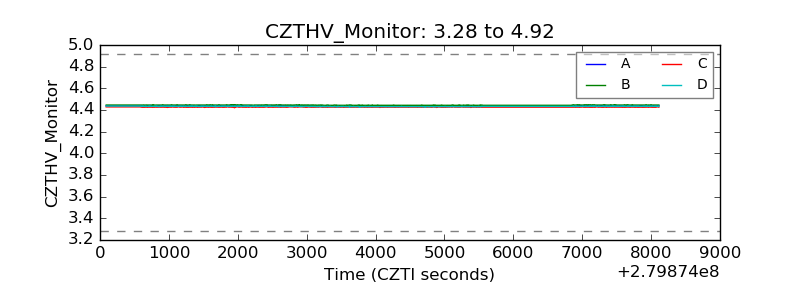 |
| D_VDD | 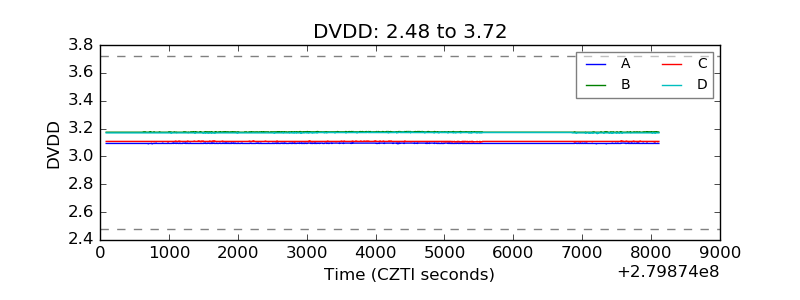 |
| Temperature 1 | 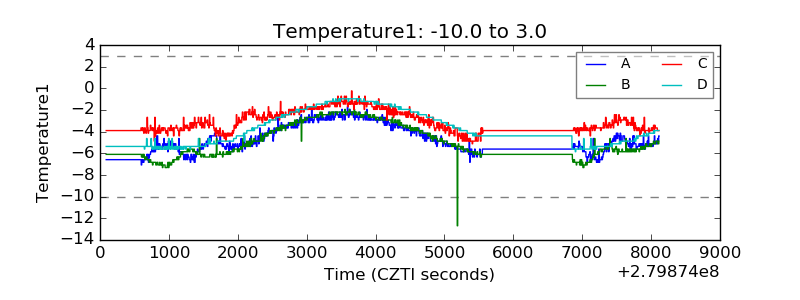 |
| Veto HV Monitor | 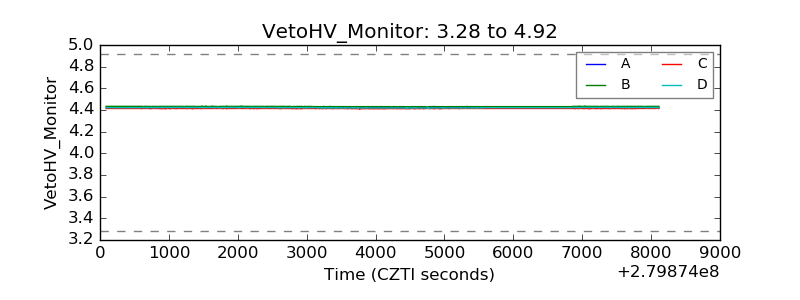 |
| Veto LLD | 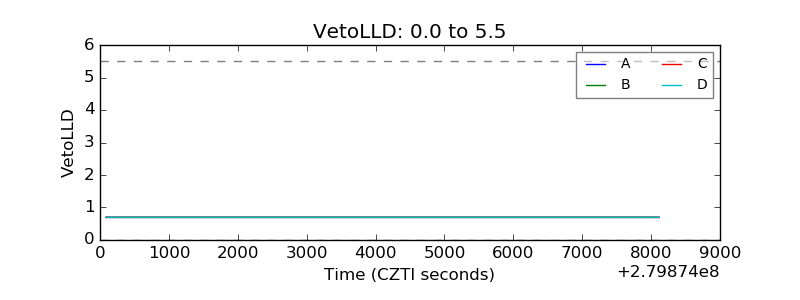 |
| Alpha Counter | 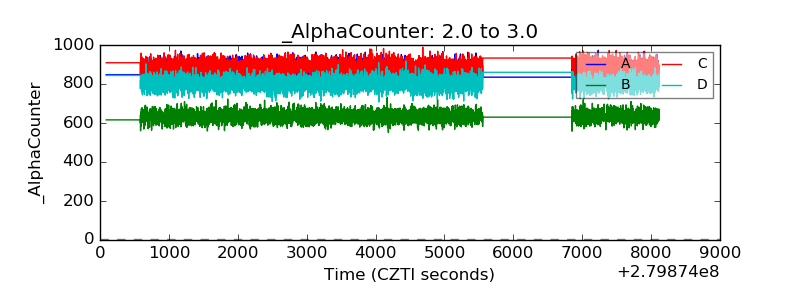 |
| _CPM_Rate | 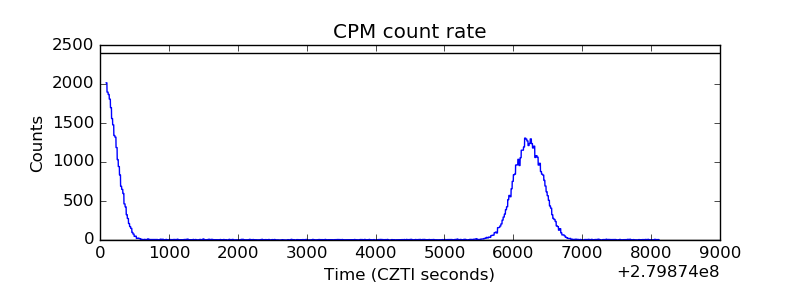 |
| CZT Counter | 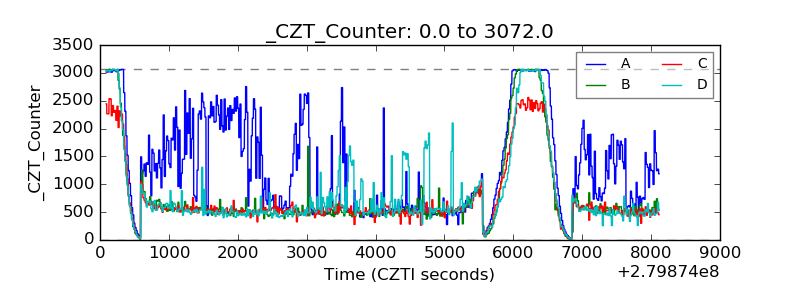 |
| +2.5 Volts monitor |  |
| +5 Volts monitor |  |
| _ROLL_ROT | 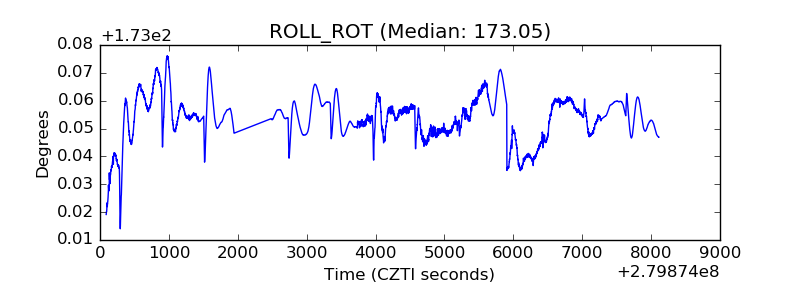 |
| _Roll_DEC | 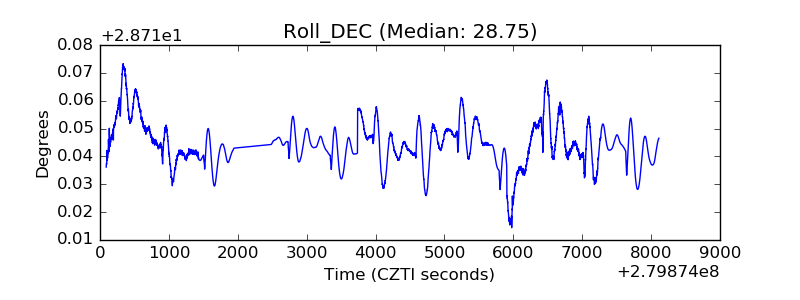 |
| _Roll_RA | 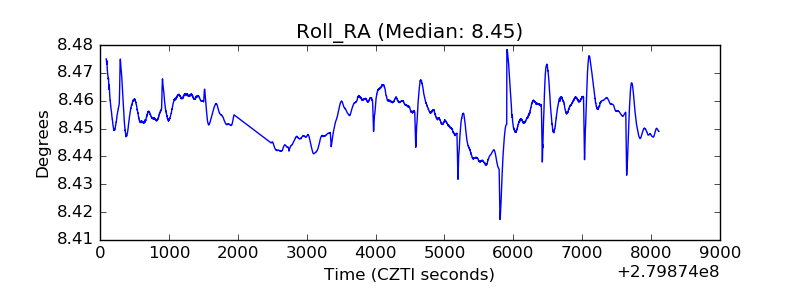 |
| Veto Counter | 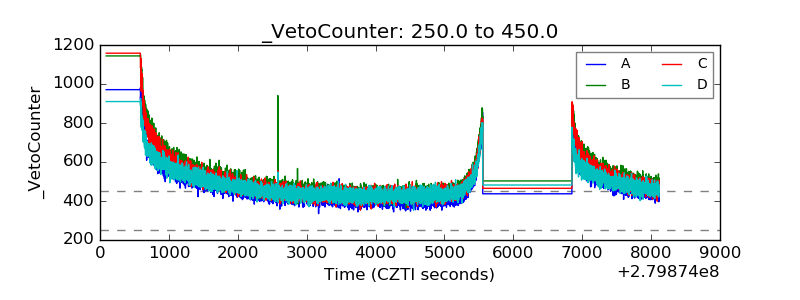 |