| Param | Original file | Final file |
|---|---|---|
| Filename | modeM0/AS1T03_030T01_9000002512_16922cztM0_level2.evt | modeM0/AS1T03_030T01_9000002512_16922cztM0_level2_quad_clean.evt |
| Size (bytes) | 555,753,600 | 85,916,160 |
| Size | 530.0 MB | 81.9 MB |
| Events in quadrant A | 5,223,396 | 548,780 |
| Events in quadrant B | 3,579,581 | 561,505 |
| Events in quadrant C | 3,302,939 | 529,537 |
| Events in quadrant D | 4,282,856 | 506,846 |
| Mode M9 | |||
|---|---|---|---|
| Quadrant | BADHDUFLAG | Total packets | Discarded packets |
| A | 0 | 17 | 0 |
| B | 0 | 18 | 0 |
| C | 0 | 18 | 0 |
| D | 0 | 18 | 0 |
| Mode M0 | |||
|---|---|---|---|
| Quadrant | BADHDUFLAG | Total packets | Discarded packets |
| A | 0 | 19704 | 2 |
| B | 0 | 14487 | 2 |
| C | 0 | 13701 | 2 |
| D | 0 | 16845 | 2 |
| Mode SS | |||
|---|---|---|---|
| Quadrant | BADHDUFLAG | Total packets | Discarded packets |
| A | 0 | 132 | 0 |
| B | 0 | 132 | 0 |
| C | 0 | 132 | 0 |
| D | 0 | 132 | 0 |
| Quadrant | Total seconds | Saturated seconds | Saturation percentage |
|---|---|---|---|
| A | 6524 | 373 | 5.717351% |
| B | 6524 | 172 | 2.636419% |
| C | 6524 | 134 | 2.053955% |
| D | 6524 | 328 | 5.027590% |
Noise dominated data is calculated using 1-second bins in cleaned event files. If a bin has >2000 counts, and if more than 50% of those come from <1% of pixels, then it is considered to be noise-dominated and hence unusable.
| Quadrant | # 1 sec bins | Bins with >0 counts | Bins with >2000 counts | High rate bins dominated by noise | Noise dominated (total time) | Noise dominated (detector-on time) | Marked lightcurve |
|---|---|---|---|---|---|---|---|
| A | 7635 | 6526 | 119 | 119 | 1.56% | 1.82% | 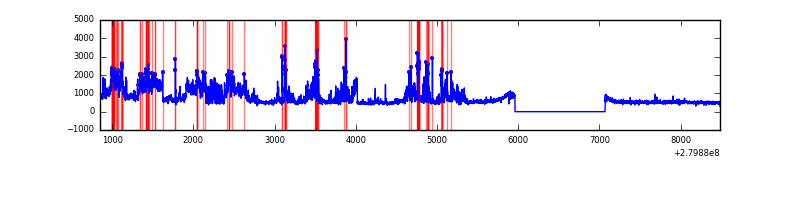 |
| B | 7635 | 6526 | 18 | 18 | 0.24% | 0.28% | 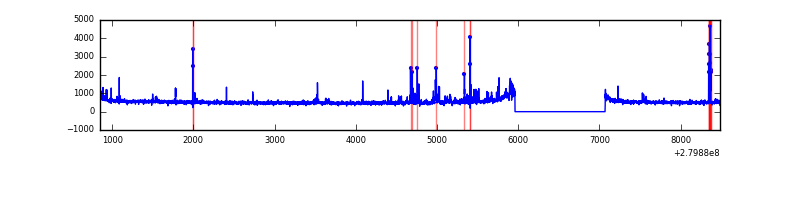 |
| C | 7635 | 6526 | 0 | 0 | 0.00% | 0.00% | 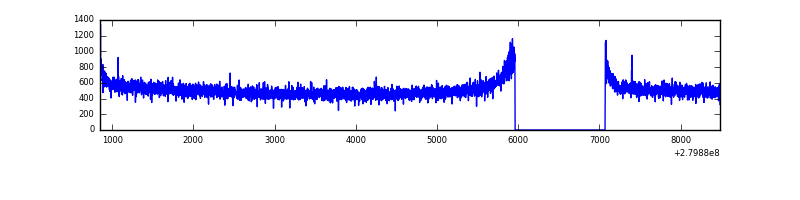 |
| D | 7635 | 6526 | 134 | 134 | 1.76% | 2.05% | 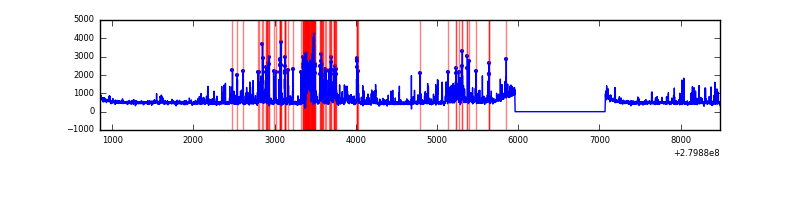 |
Top three noisy pixels from each quadrant. If the there are fewer than three noisy pixels in the level2.evt file, extra rows are filled as -1
| Pixel properties | Quadrant properties | ||||||
|---|---|---|---|---|---|---|---|
| Quadrant | DetID | PixID | Counts | Sigma | Mean | Median | Sigma |
| A | 15 | 174 | 1951436 | 11417.54 | 851 | 835 | 170.8 |
| A | 0 | 226 | 7426 | 38.58 | 851 | 835 | 170.8 |
| A | 12 | 194 | 6176 | 31.26 | 851 | 835 | 170.8 |
| B | 3 | 64 | 169620 | 1041.8 | 850 | 829 | 162.0 |
| B | 15 | 35 | 45885 | 278.09 | 850 | 829 | 162.0 |
| B | 0 | 197 | 25320 | 151.16 | 850 | 829 | 162.0 |
| C | 14 | 238 | 124436 | 663.93 | 805 | 811 | 186.2 |
| C | 3 | 233 | 36173 | 189.91 | 805 | 811 | 186.2 |
| C | 13 | 61 | 5664 | 26.06 | 805 | 811 | 186.2 |
| D | 1 | 52 | 1069027 | 5421.59 | 811 | 788 | 197.0 |
| D | 12 | 235 | 73387 | 368.46 | 811 | 788 | 197.0 |
| D | 2 | 152 | 55642 | 278.4 | 811 | 788 | 197.0 |
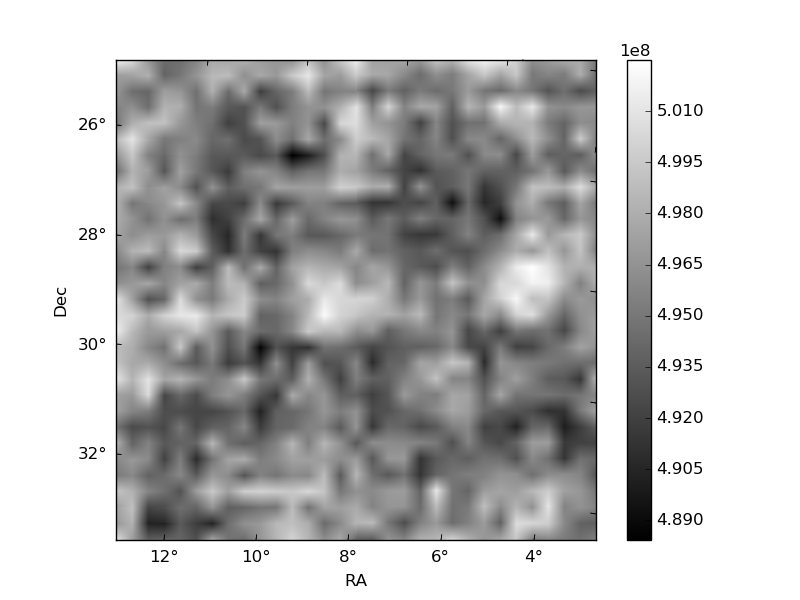
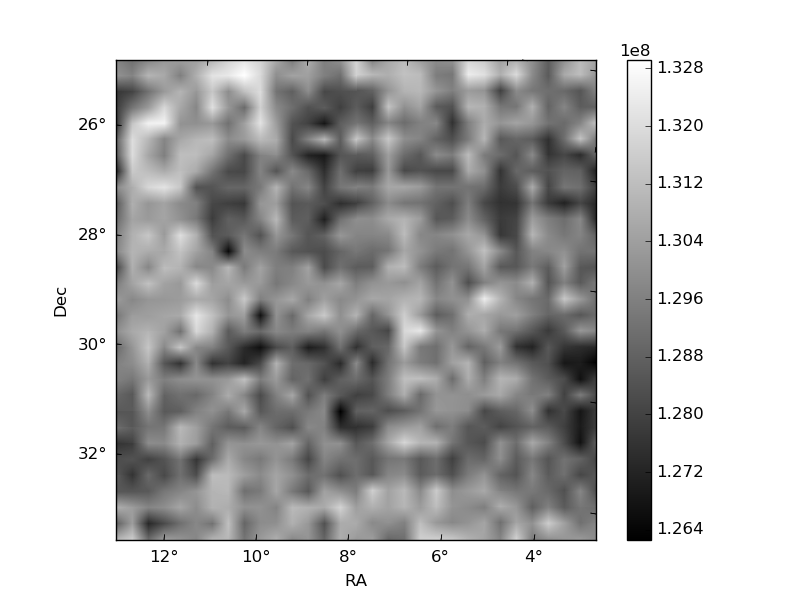
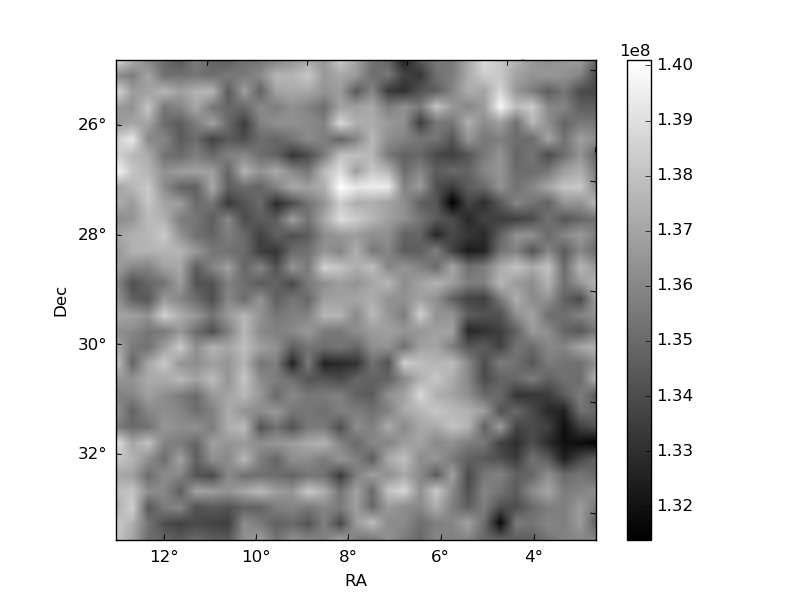
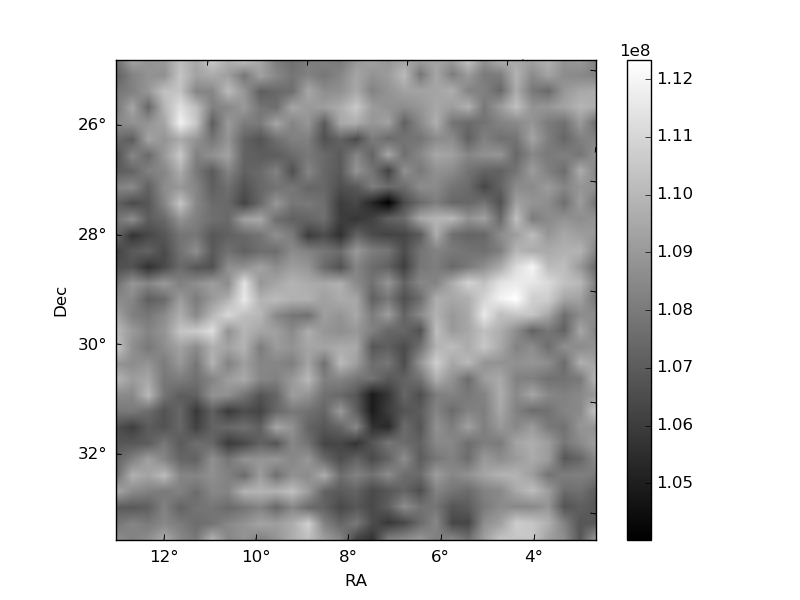
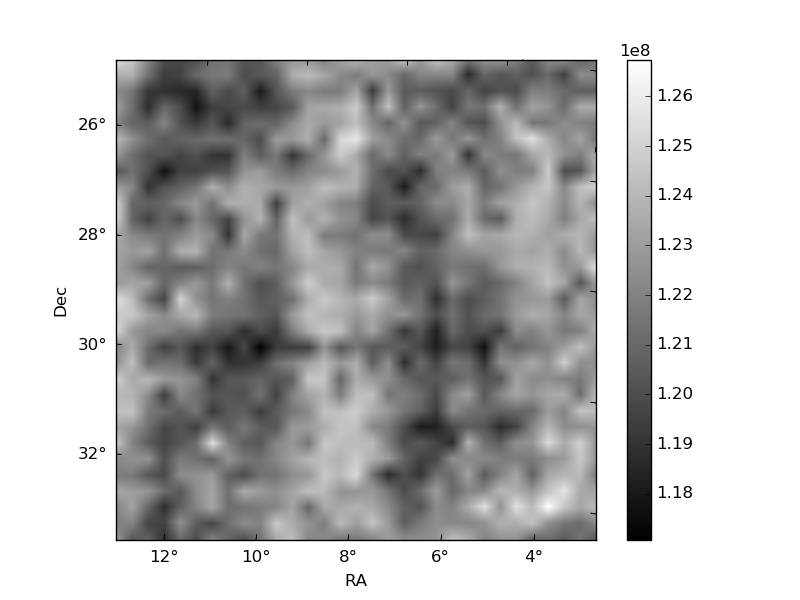
Histogram calculated using DETX and DETY for each event in the final _common_clean file
| Quadrant A | 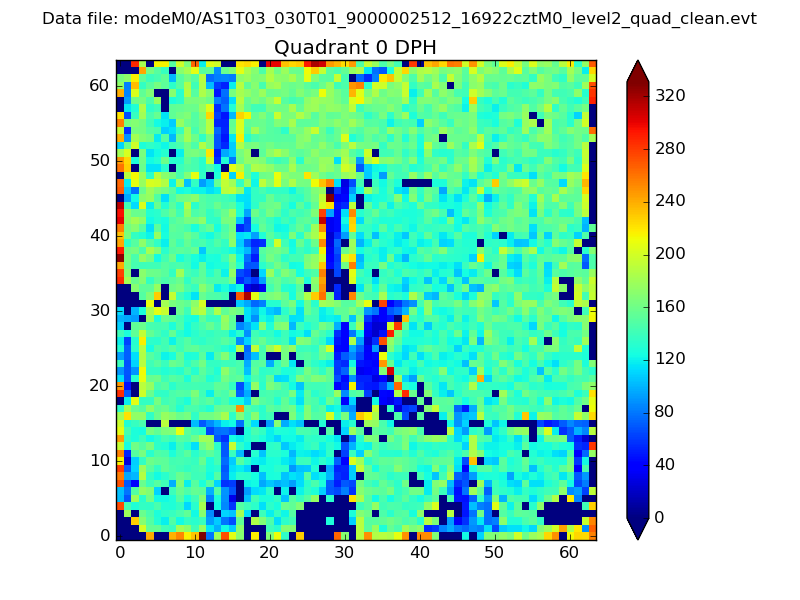 |
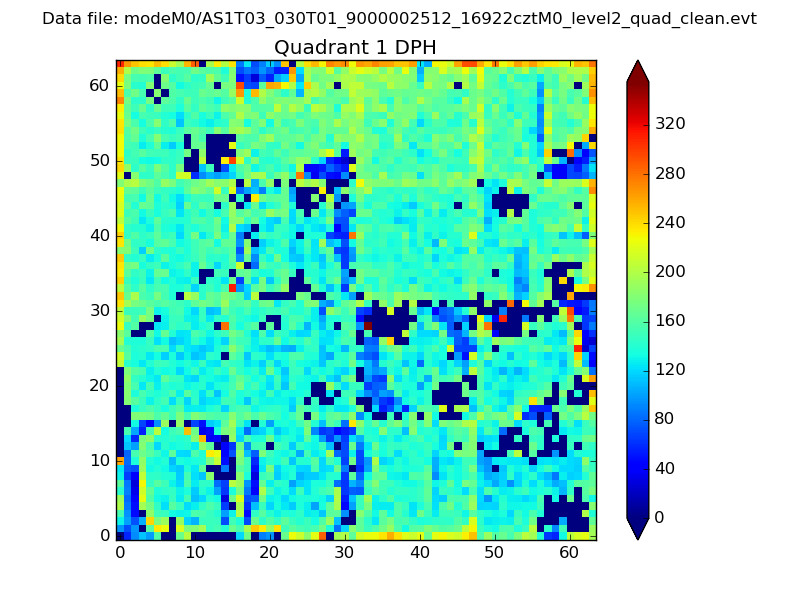 |
Quadrant B |
|---|---|---|---|
| Quadrant D |  |
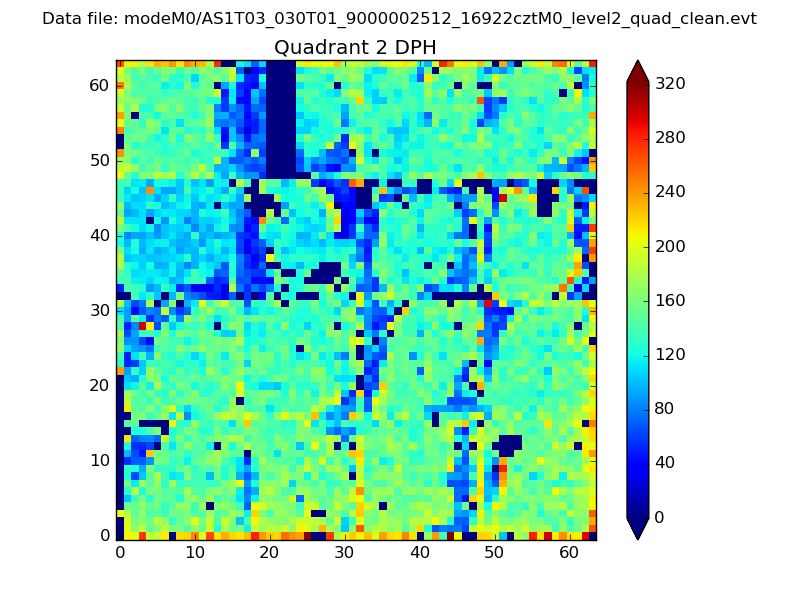 |
Quadrant C |
| Plot type | Count rate plots | Images |
|---|---|---|
| Comparison with Poisson distribution Blue bars denote a histogram of data divided into 1 sec bins. Red curve is a Poisson curve with rate = median count rate of data. |
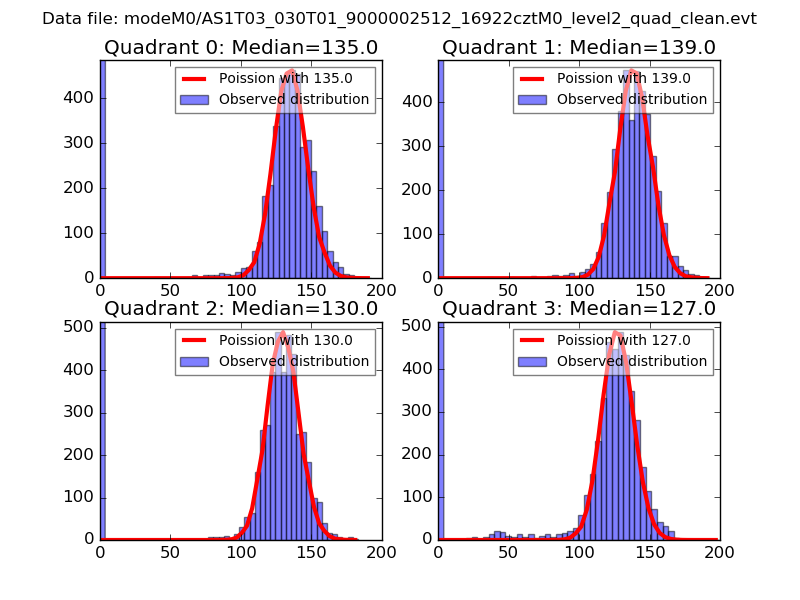 |
 |
| Quadrant-wise count rates Data is divided into 100 sec bins |
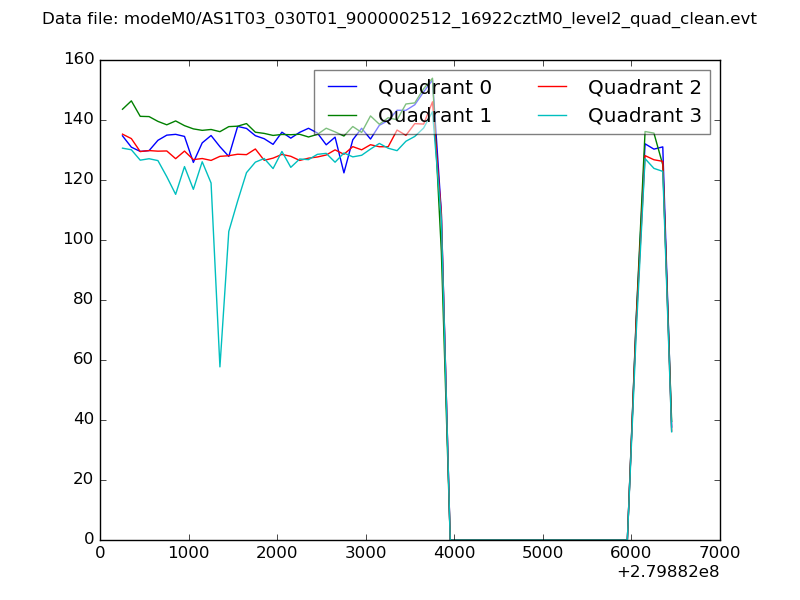 |
|
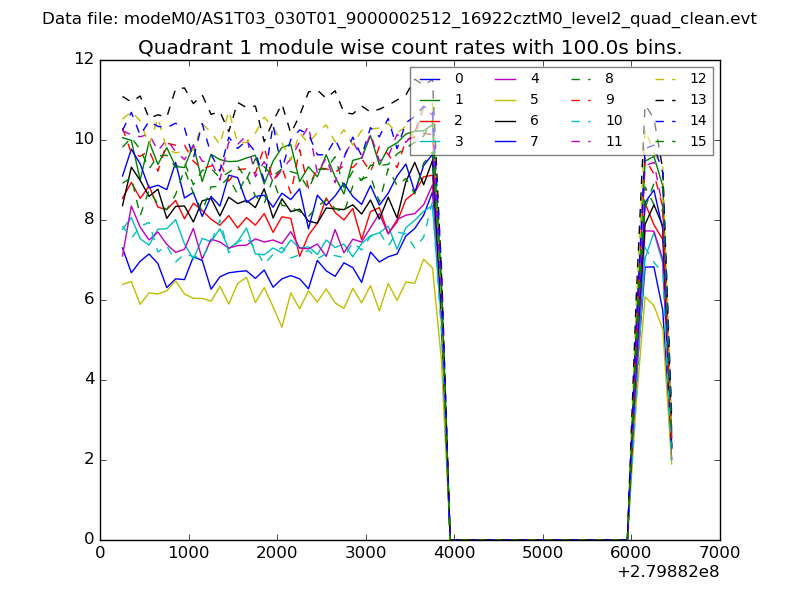
| Module-wise count rates for Quadrant A Data is divided into 100 sec bins |
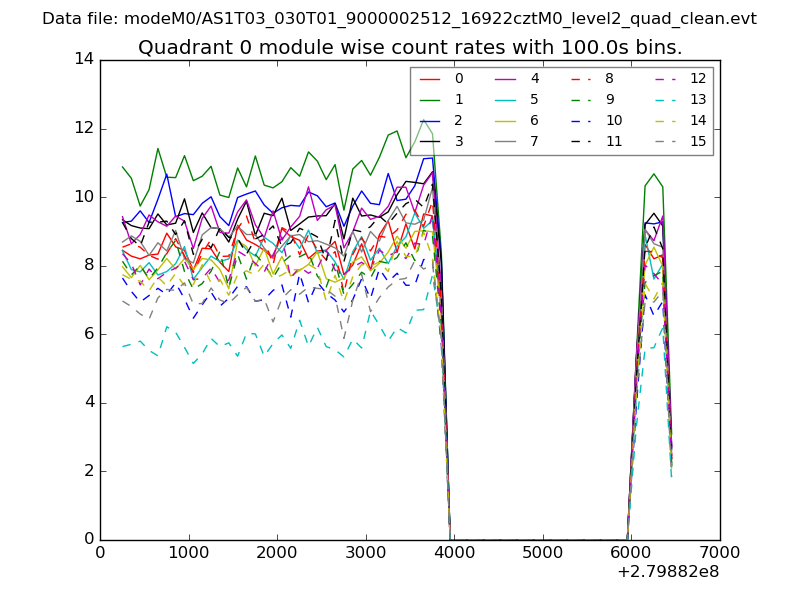 |
 |
| Module-wise count rates for Quadrant B Data is divided into 100 sec bins |
 |
 |
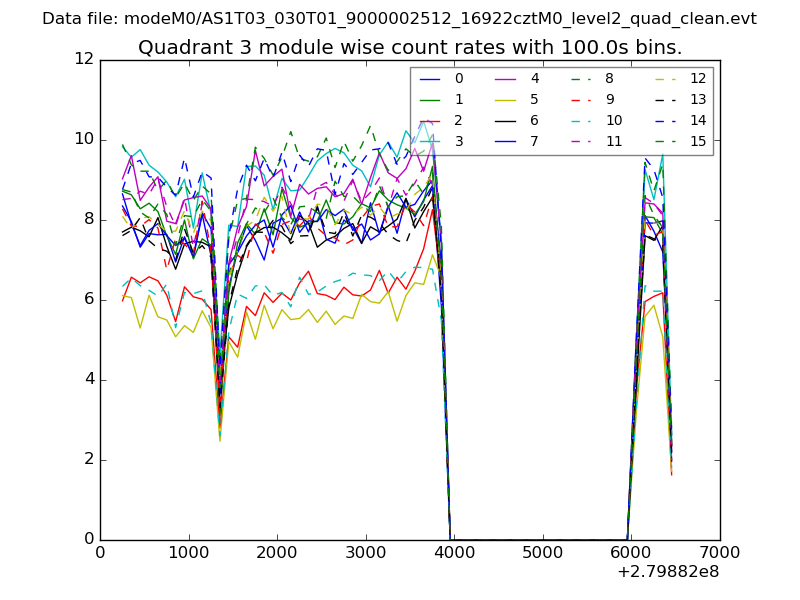
| Module-wise count rates for Quadrant C Data is divided into 100 sec bins |
 |
 |
| Module-wise count rates for Quadrant D Data is divided into 100 sec bins |
 |
 |
| Parameter | Plot |
|---|---|
| CZT HV Monitor | 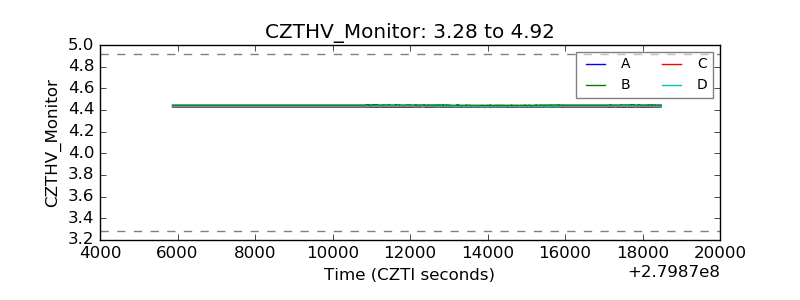 |
| D_VDD | 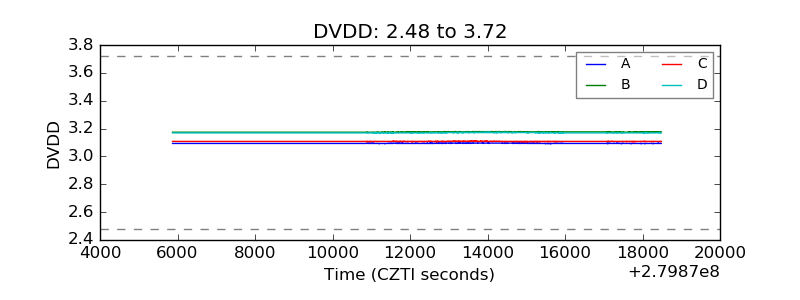 |
| Temperature 1 | 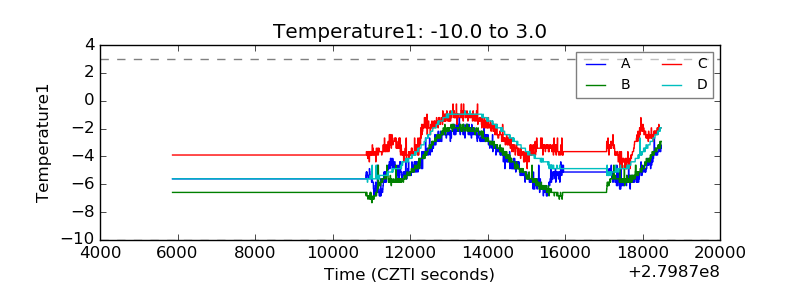 |
| Veto HV Monitor | 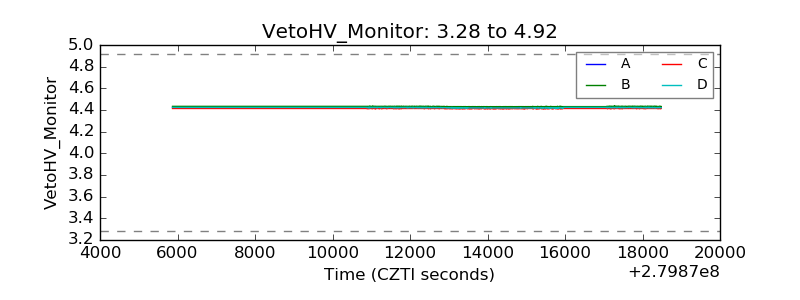 |
| Veto LLD | 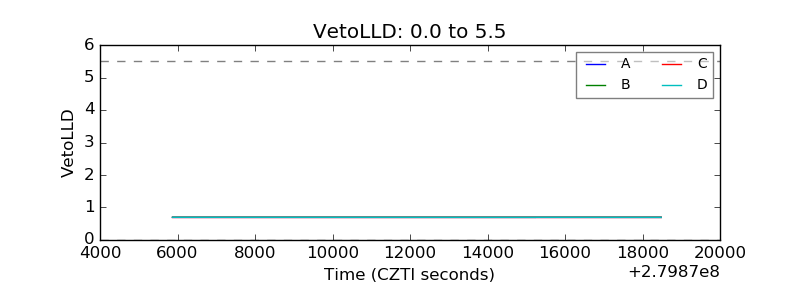 |
| Alpha Counter | 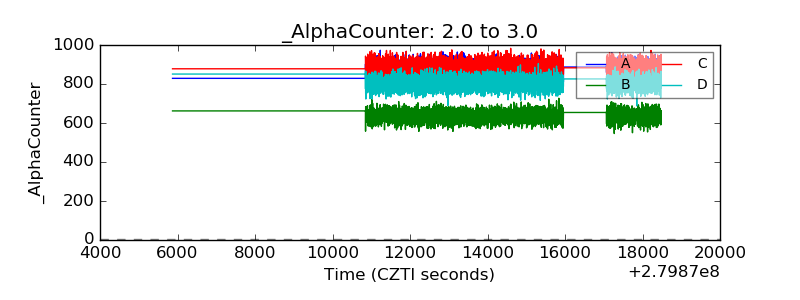 |
| _CPM_Rate | 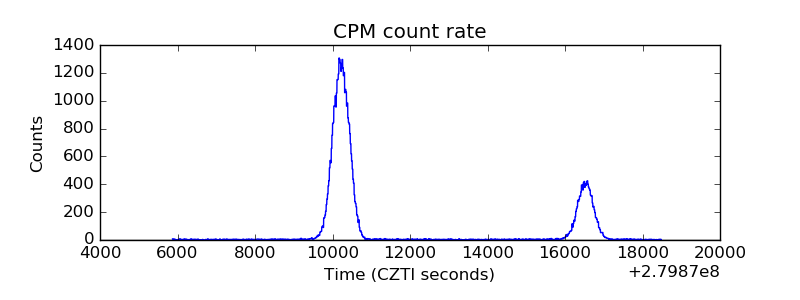 |
| CZT Counter | 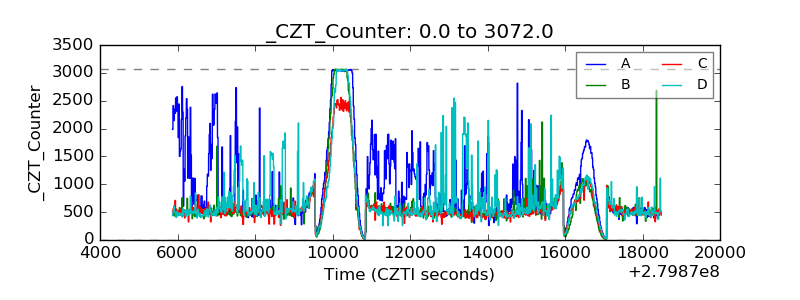 |
| +2.5 Volts monitor |  |
| +5 Volts monitor |  |
| _ROLL_ROT | 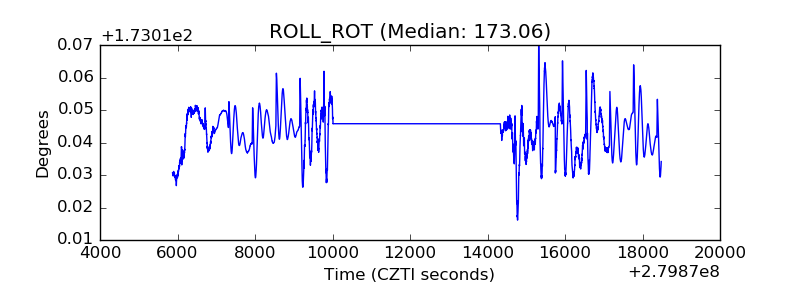 |
| _Roll_DEC | 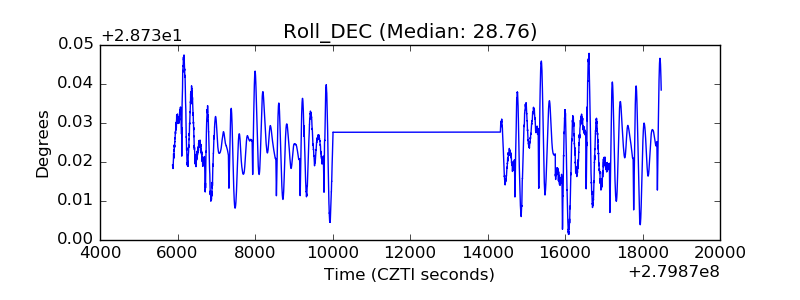 |
| _Roll_RA | 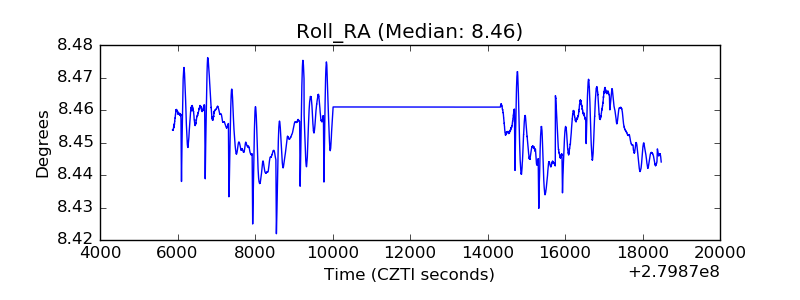 |
| Veto Counter |  |