| Param | Original file | Final file |
|---|---|---|
| Filename | modeM0/AS1T03_030T01_9000002512_16924cztM0_level2.evt | modeM0/AS1T03_030T01_9000002512_16924cztM0_level2_quad_clean.evt |
| Size (bytes) | 586,517,760 | 92,004,480 |
| Size | 559.3 MB | 87.7 MB |
| Events in quadrant A | 4,578,137 | 588,260 |
| Events in quadrant B | 4,060,932 | 596,147 |
| Events in quadrant C | 3,537,676 | 577,713 |
| Events in quadrant D | 5,129,270 | 553,947 |
| Mode M9 | |||
|---|---|---|---|
| Quadrant | BADHDUFLAG | Total packets | Discarded packets |
| A | 0 | 3 | 0 |
| B | 0 | 3 | 0 |
| C | 0 | 3 | 0 |
| D | 0 | 3 | 0 |
| Mode M0 | |||
|---|---|---|---|
| Quadrant | BADHDUFLAG | Total packets | Discarded packets |
| A | 0 | 17941 | 1 |
| B | 0 | 16340 | 1 |
| C | 0 | 14500 | 1 |
| D | 0 | 19645 | 1 |
| Mode SS | |||
|---|---|---|---|
| Quadrant | BADHDUFLAG | Total packets | Discarded packets |
| A | 0 | 138 | 0 |
| B | 0 | 138 | 0 |
| C | 0 | 138 | 0 |
| D | 0 | 138 | 0 |
| Quadrant | Total seconds | Saturated seconds | Saturation percentage |
|---|---|---|---|
| A | 6738 | 387 | 5.743544% |
| B | 6737 | 392 | 5.818614% |
| C | 6737 | 172 | 2.553065% |
| D | 6737 | 430 | 6.382663% |
Noise dominated data is calculated using 1-second bins in cleaned event files. If a bin has >2000 counts, and if more than 50% of those come from <1% of pixels, then it is considered to be noise-dominated and hence unusable.
| Quadrant | # 1 sec bins | Bins with >0 counts | Bins with >2000 counts | High rate bins dominated by noise | Noise dominated (total time) | Noise dominated (detector-on time) | Marked lightcurve |
|---|---|---|---|---|---|---|---|
| A | 7049 | 6740 | 137 | 137 | 1.94% | 2.03% | 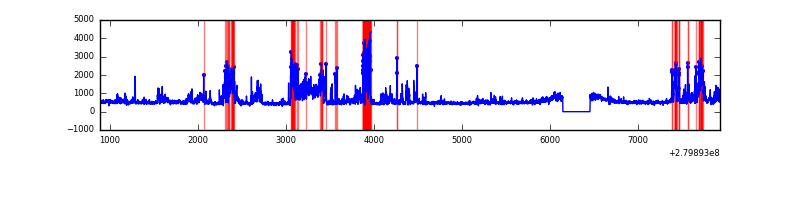 |
| B | 7048 | 6739 | 122 | 122 | 1.73% | 1.81% | 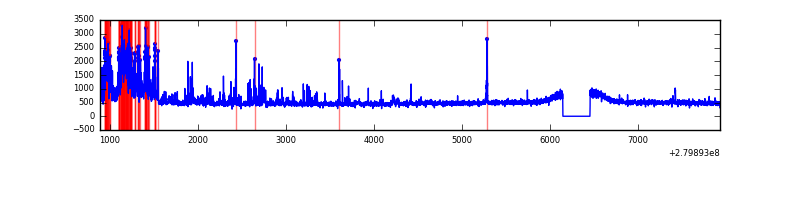 |
| C | 7048 | 6739 | 0 | 0 | 0.00% | 0.00% | 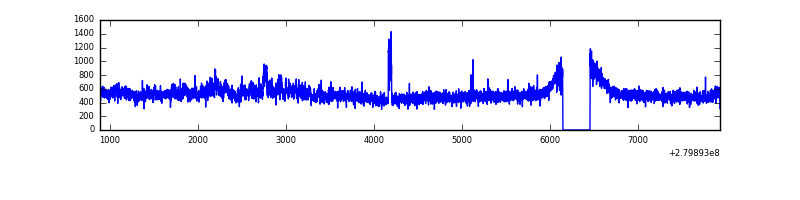 |
| D | 7048 | 6739 | 249 | 249 | 3.53% | 3.69% | 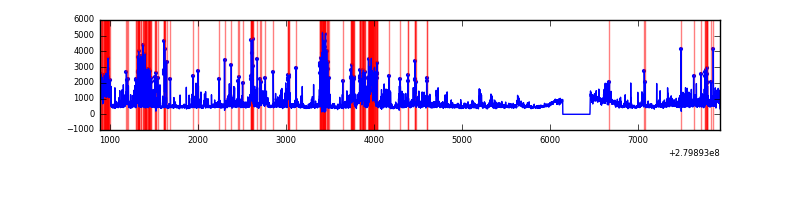 |
Top three noisy pixels from each quadrant. If the there are fewer than three noisy pixels in the level2.evt file, extra rows are filled as -1
| Pixel properties | Quadrant properties | ||||||
|---|---|---|---|---|---|---|---|
| Quadrant | DetID | PixID | Counts | Sigma | Mean | Median | Sigma |
| A | 15 | 174 | 1228932 | 7369.12 | 820 | 800 | 166.7 |
| A | 0 | 23 | 180876 | 1080.5 | 820 | 800 | 166.7 |
| A | 0 | 226 | 17355 | 99.33 | 820 | 800 | 166.7 |
| B | 3 | 64 | 664159 | 4243.92 | 815 | 793 | 156.3 |
| B | 15 | 35 | 51565 | 324.82 | 815 | 793 | 156.3 |
| B | 4 | 216 | 45145 | 283.74 | 815 | 793 | 156.3 |
| C | 3 | 233 | 345503 | 1873.5 | 786 | 790 | 184.0 |
| C | 14 | 238 | 120789 | 652.19 | 786 | 790 | 184.0 |
| C | 13 | 61 | 5662 | 26.48 | 786 | 790 | 184.0 |
| D | 1 | 52 | 2004900 | 10388.28 | 793 | 770 | 192.9 |
| D | 2 | 152 | 61492 | 314.75 | 793 | 770 | 192.9 |
| D | 2 | 234 | 26787 | 134.86 | 793 | 770 | 192.9 |
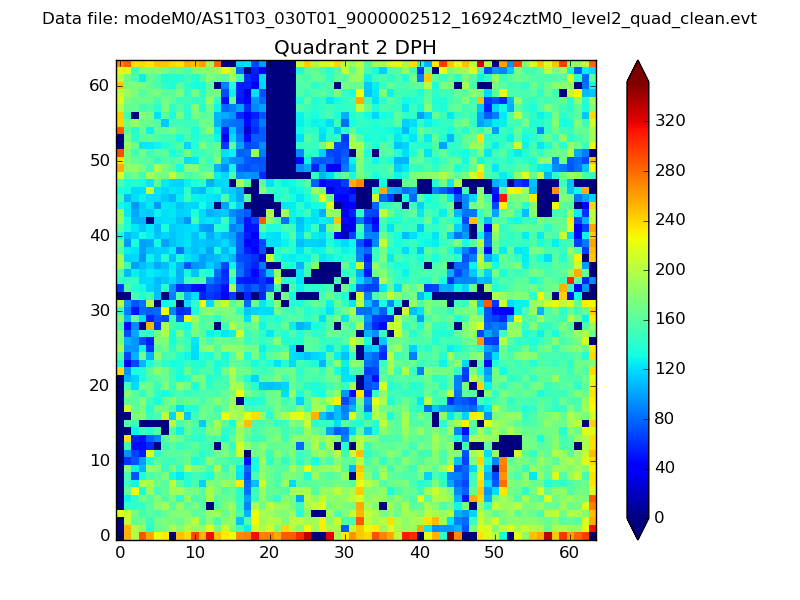
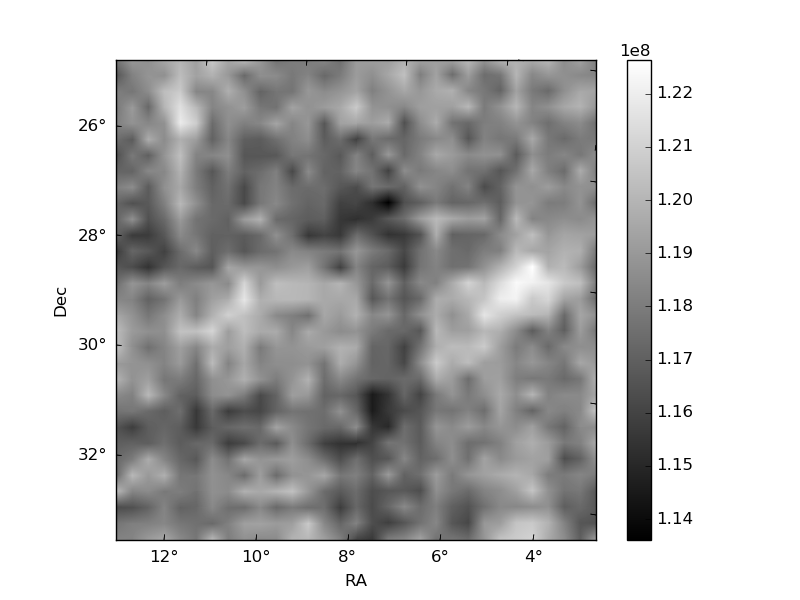
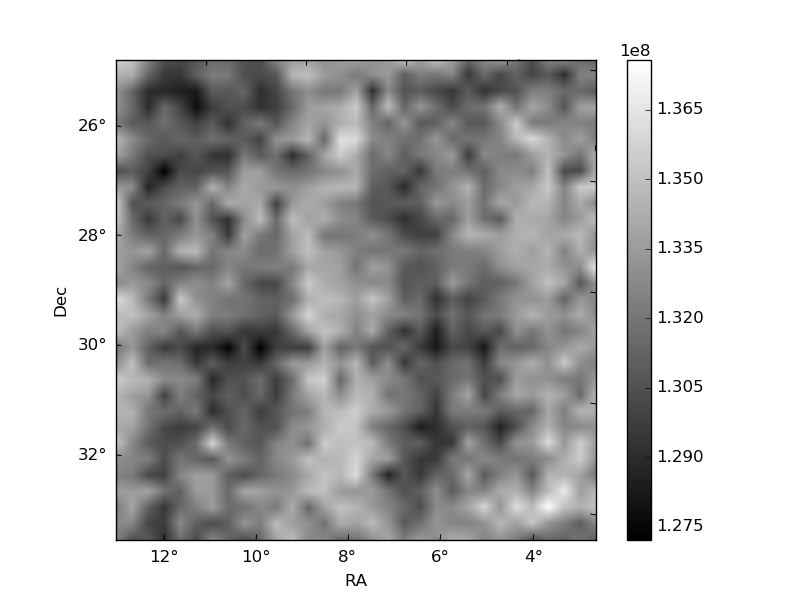
Histogram calculated using DETX and DETY for each event in the final _common_clean file
| Quadrant A | 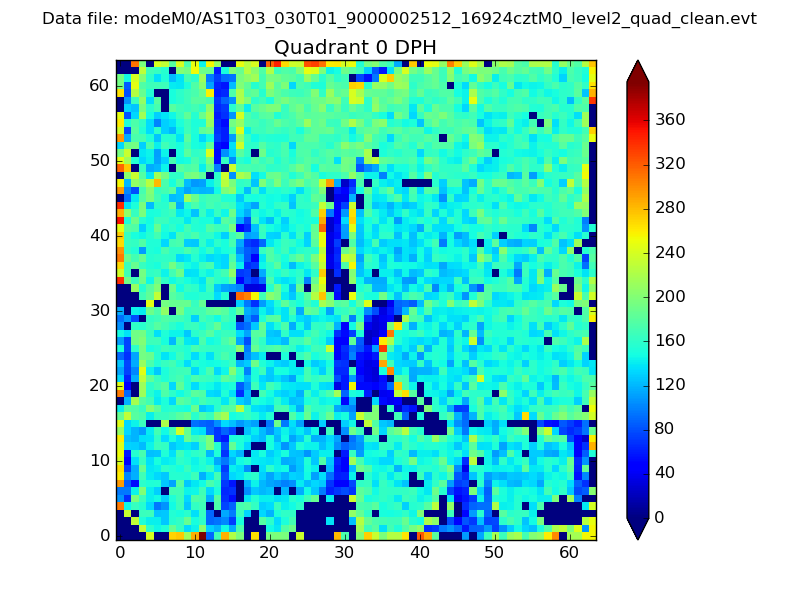 |
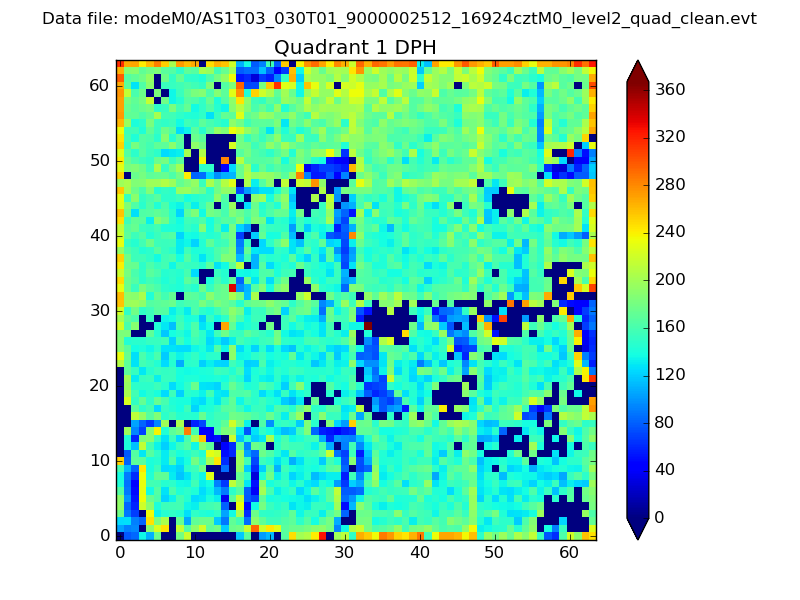 |
Quadrant B |
|---|---|---|---|
| Quadrant D | 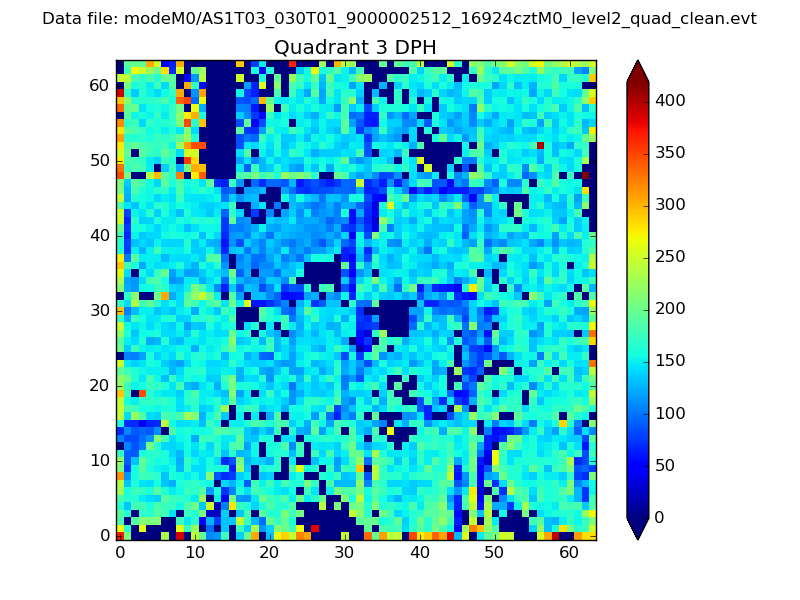 |
 |
Quadrant C |
| Plot type | Count rate plots | Images |
|---|---|---|
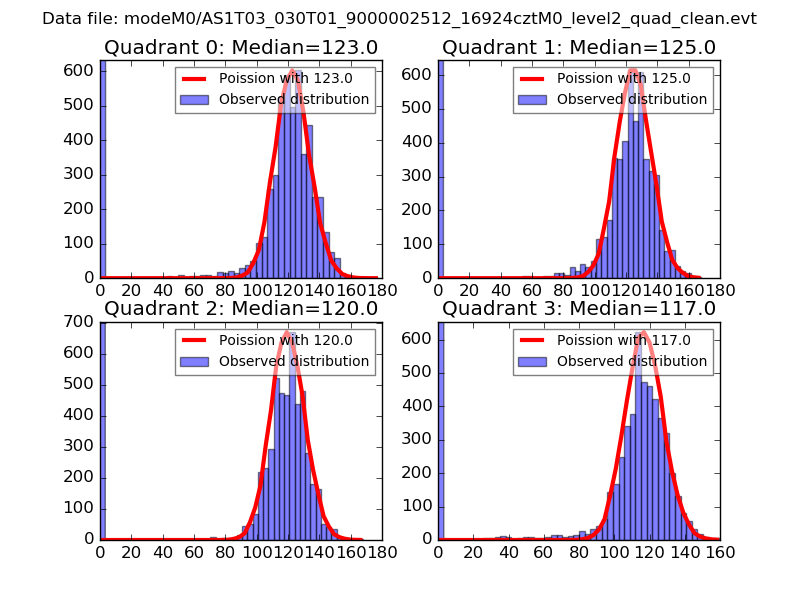
| Comparison with Poisson distribution Blue bars denote a histogram of data divided into 1 sec bins. Red curve is a Poisson curve with rate = median count rate of data. |
 |
 |
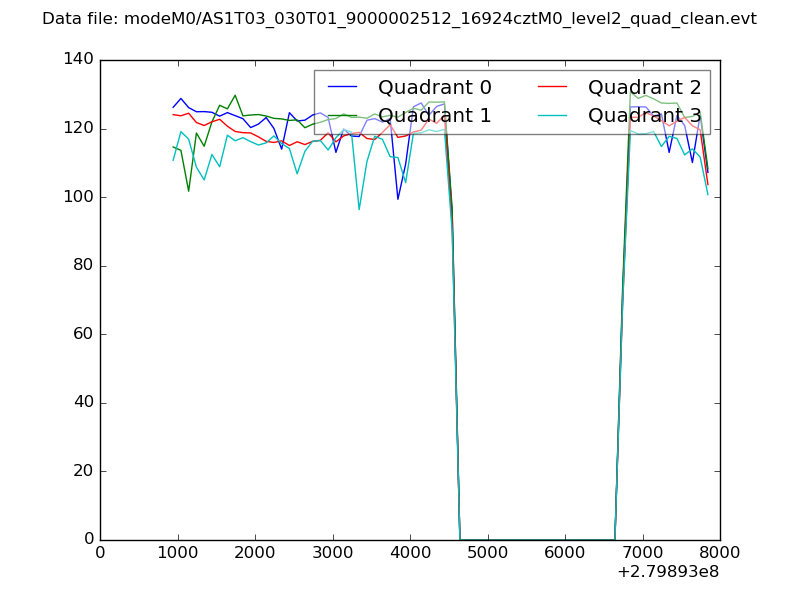
| Quadrant-wise count rates Data is divided into 100 sec bins |
 |
|
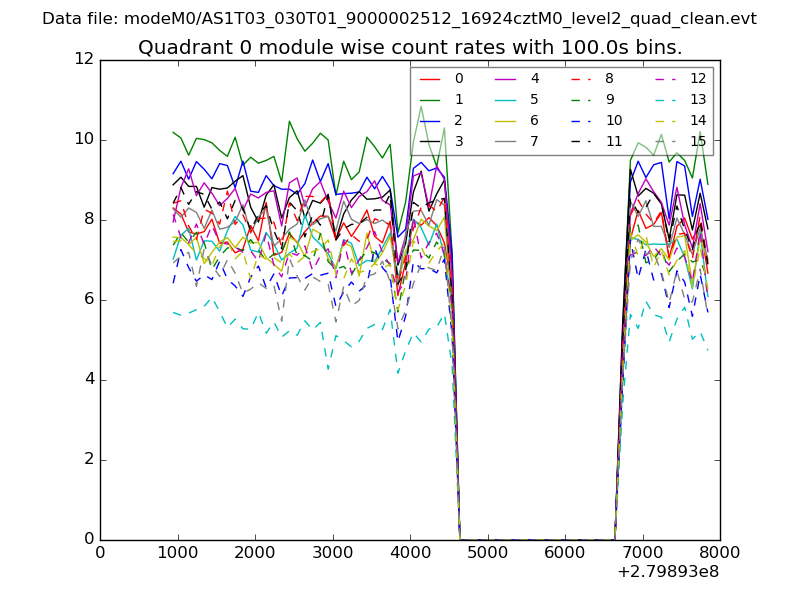
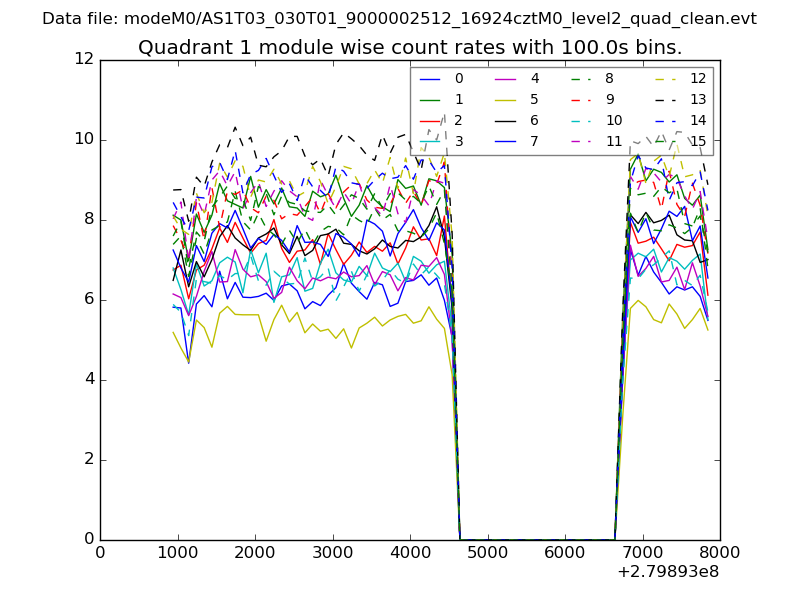
| Module-wise count rates for Quadrant A Data is divided into 100 sec bins |
 |
 |
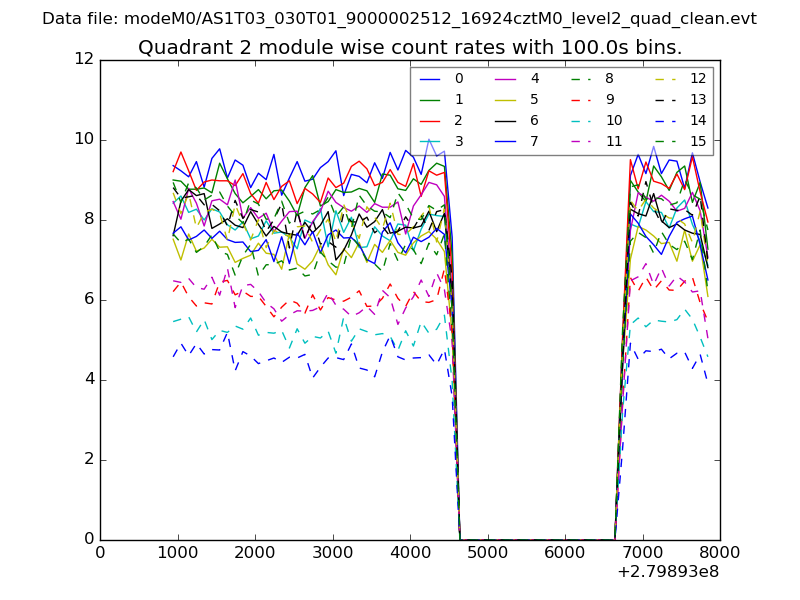
| Module-wise count rates for Quadrant B Data is divided into 100 sec bins |
 |
 |
| Module-wise count rates for Quadrant C Data is divided into 100 sec bins |
 |
 |
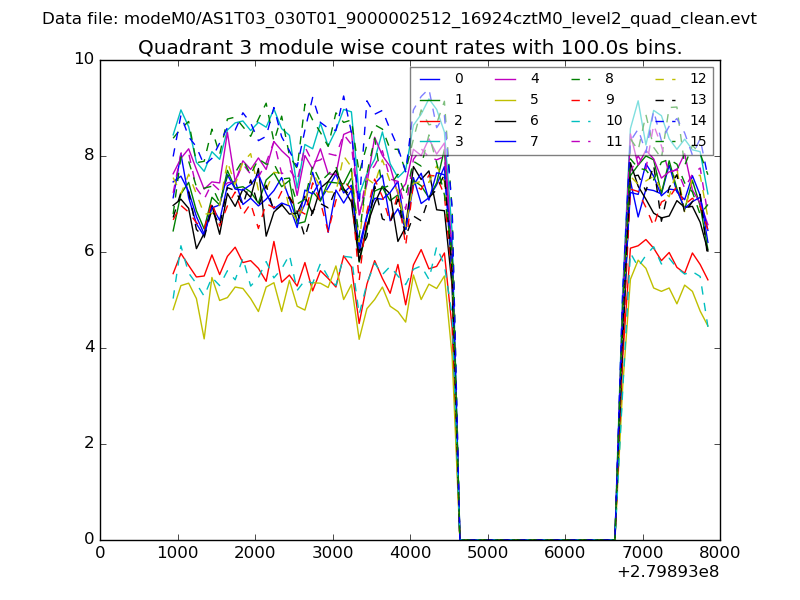
| Module-wise count rates for Quadrant D Data is divided into 100 sec bins |
 |
 |
| Parameter | Plot |
|---|---|
| CZT HV Monitor | 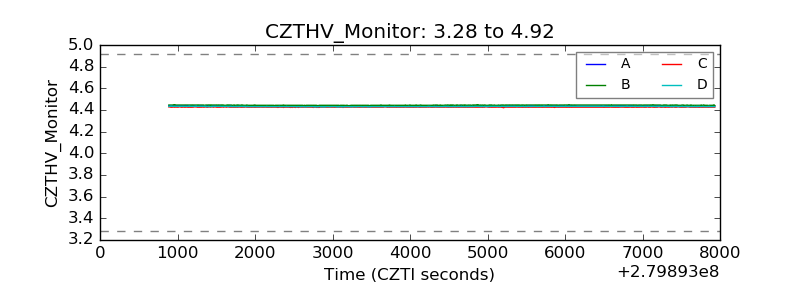 |
| D_VDD | 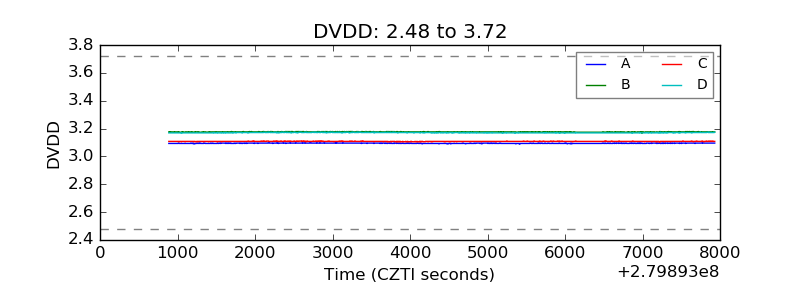 |
| Temperature 1 |  |
| Veto HV Monitor | 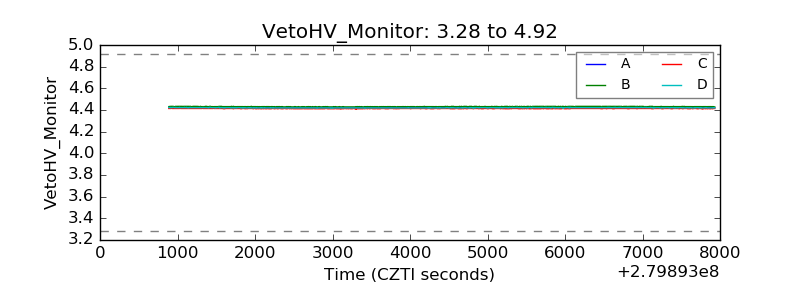 |
| Veto LLD | 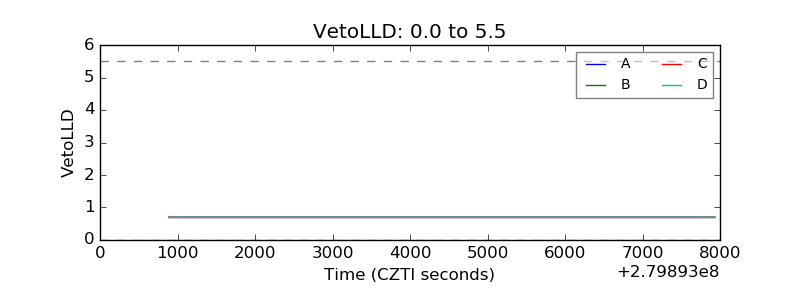 |
| Alpha Counter | 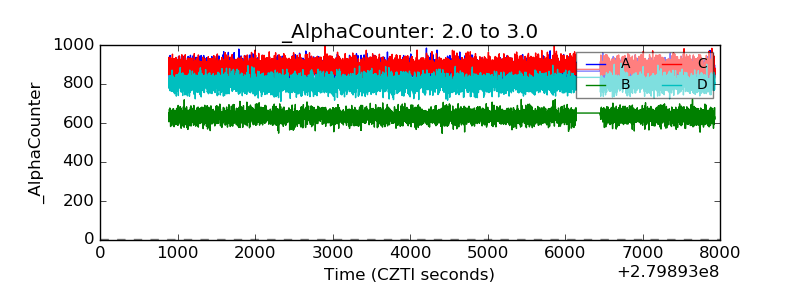 |
| _CPM_Rate | 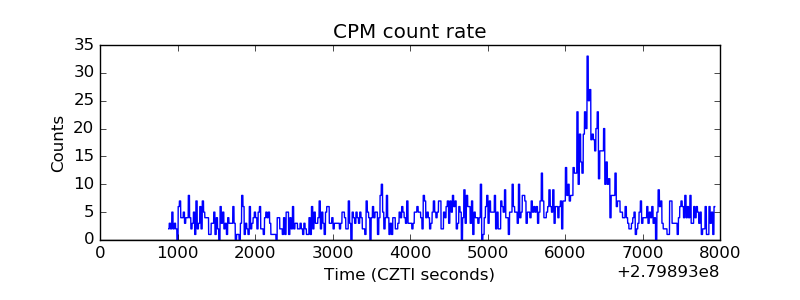 |
| CZT Counter | 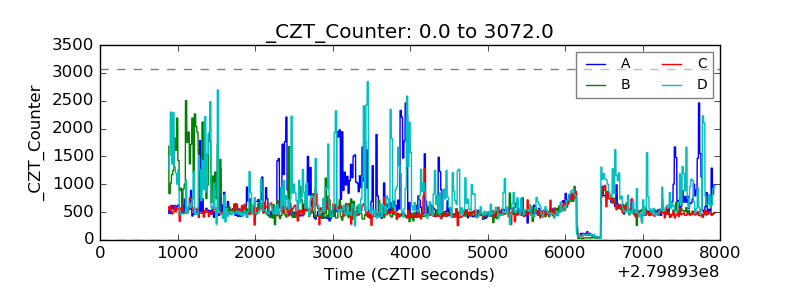 |
| +2.5 Volts monitor |  |
| +5 Volts monitor |  |
| _ROLL_ROT | 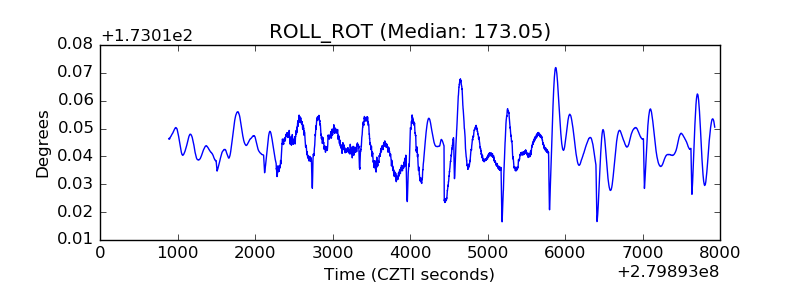 |
| _Roll_DEC | 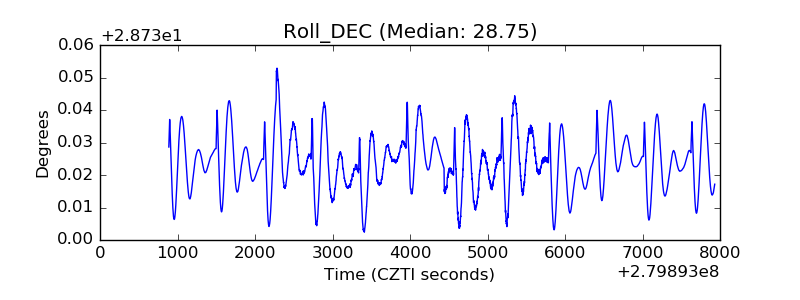 |
| _Roll_RA | 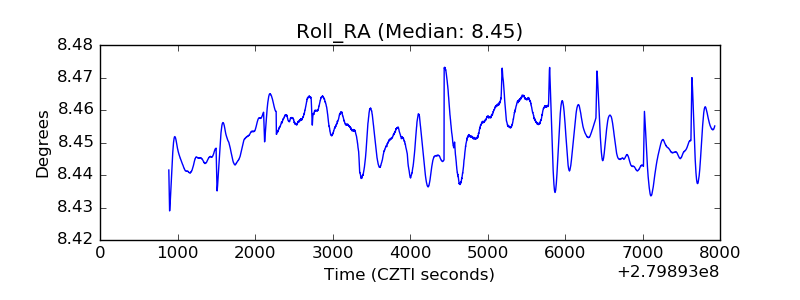 |
| Veto Counter | 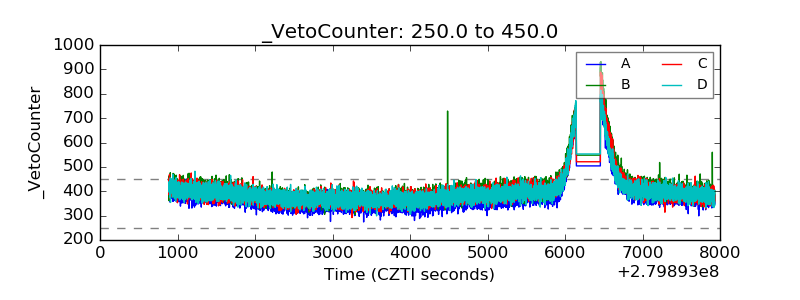 |