| Param | Original file | Final file |
|---|---|---|
| Filename | modeM0/AS1T03_013T01_9000002514cztM0_level2.fits | modeM0/AS1T03_013T01_9000002514cztM0_level2_quad_clean.evt |
| Size (bytes) | 475,283,520 | 442,774,080 |
| Size | 453.3 MB | 422.3 MB |
| Events in quadrant A | 2,920,142 | 2,627,459 |
| Events in quadrant B | 2,865,966 | 2,692,559 |
| Events in quadrant C | 2,872,366 | 2,529,787 |
| Events in quadrant D | 2,243,032 | 2,070,938 |
| Mode M0 | |||
|---|---|---|---|
| Quadrant | BADHDUFLAG | Total packets | Discarded packets |
| A | 0 | 136666 | 0 |
| B | 0 | 106607 | 0 |
| C | 0 | 126083 | 0 |
| D | 0 | 186925 | 0 |
| Mode M9 | |||
|---|---|---|---|
| Quadrant | BADHDUFLAG | Total packets | Discarded packets |
| A | 0 | 94 | 0 |
| B | 0 | 95 | 0 |
| C | 0 | 95 | 0 |
| D | 0 | 95 | 0 |
| Mode SS | |||
|---|---|---|---|
| Quadrant | BADHDUFLAG | Total packets | Discarded packets |
| A | 0 | 1034 | 0 |
| B | 0 | 1034 | 0 |
| C | 0 | 1034 | 0 |
| D | 0 | 1034 | 0 |
| Quadrant | Total seconds | Saturated seconds | Saturation percentage |
|---|---|---|---|
| A | 50828 | 2715 | 5.341544% |
| B | 50828 | 503 | 0.989612% |
| C | 50828 | 1110 | 2.183836% |
| D | 50828 | 9236 | 18.171087% |
Noise dominated data is calculated using 1-second bins in cleaned event files. If a bin has >2000 counts, and if more than 50% of those come from <1% of pixels, then it is considered to be noise-dominated and hence unusable.
| Quadrant | # 1 sec bins | Bins with >0 counts | Bins with >2000 counts | High rate bins dominated by noise | Noise dominated (total time) | Noise dominated (detector-on time) | Marked lightcurve |
|---|---|---|---|---|---|---|---|
| A | 64790 | 50765 | 0 | 0 | 0.00% | 0.00% | 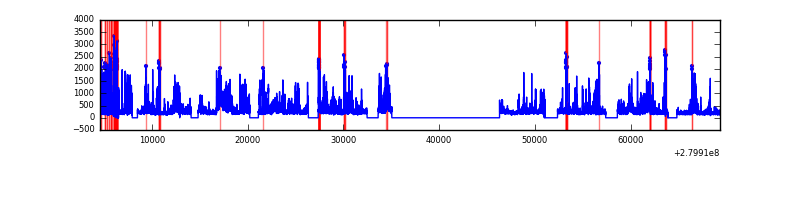 |
| B | 64790 | 50828 | 0 | 0 | 0.00% | 0.00% | 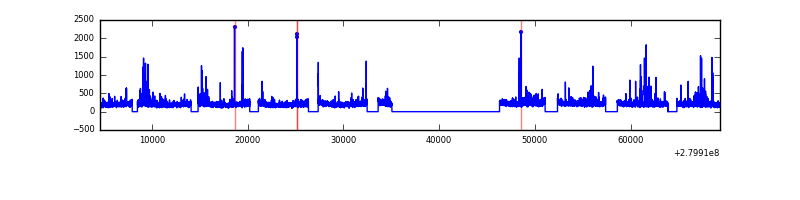 |
| C | 64790 | 50827 | 0 | 0 | 0.00% | 0.00% | 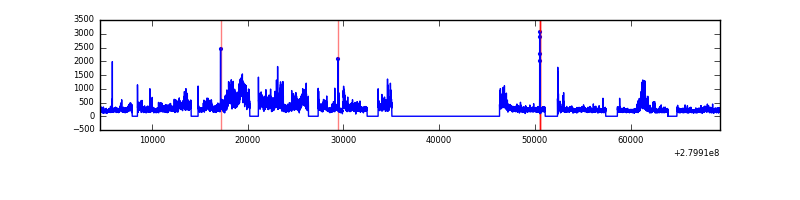 |
| D | 64787 | 49923 | 0 | 0 | 0.00% | 0.00% | 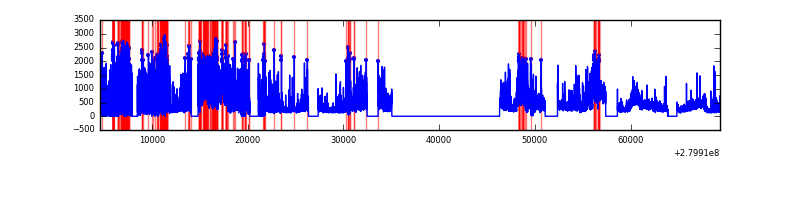 |
Top three noisy pixels from each quadrant. If the there are fewer than three noisy pixels in the level2.evt file, extra rows are filled as -1
| Pixel properties | Quadrant properties | ||||||
|---|---|---|---|---|---|---|---|
| Quadrant | DetID | PixID | Counts | Sigma | Mean | Median | Sigma |
| A | 0 | 29 | 2833 | 11.15 | 761 | 715 | 189.9 |
| A | 7 | 110 | 2385 | 8.79 | 761 | 715 | 189.9 |
| A | 0 | 30 | 2241 | 8.03 | 761 | 715 | 189.9 |
| B | 2 | 9 | 2312 | 10.69 | 757 | 724 | 148.6 |
| B | 2 | 8 | 1969 | 8.38 | 757 | 724 | 148.6 |
| B | 3 | 17 | 1900 | 7.91 | 757 | 724 | 148.6 |
| C | 12 | 241 | 2034 | 6.79 | 758 | 710 | 195.0 |
| C | 9 | 233 | 1942 | 6.32 | 758 | 710 | 195.0 |
| C | 2 | 191 | 1919 | 6.2 | 758 | 710 | 195.0 |
| D | 6 | 231 | 1676 | 6.45 | 639 | 585 | 169.1 |
| D | 10 | 189 | 1637 | 6.22 | 639 | 585 | 169.1 |
| D | 7 | 3 | 1602 | 6.01 | 639 | 585 | 169.1 |
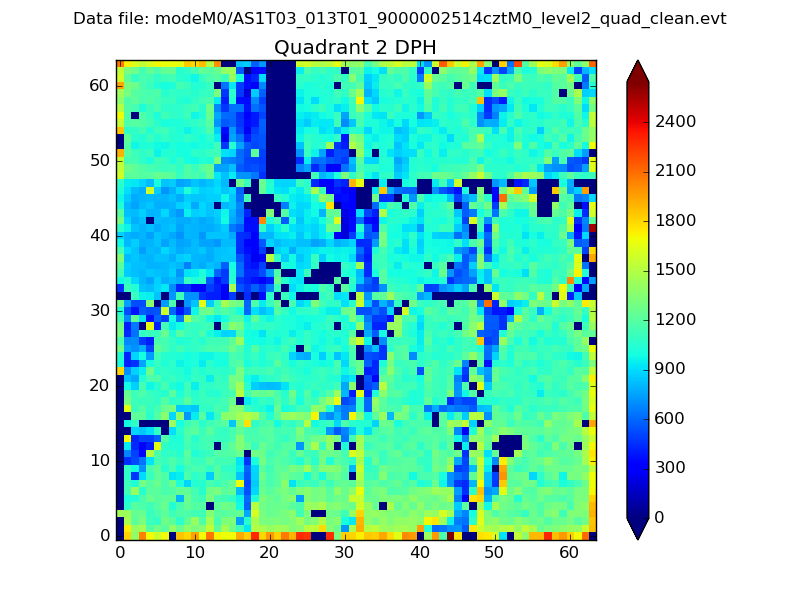
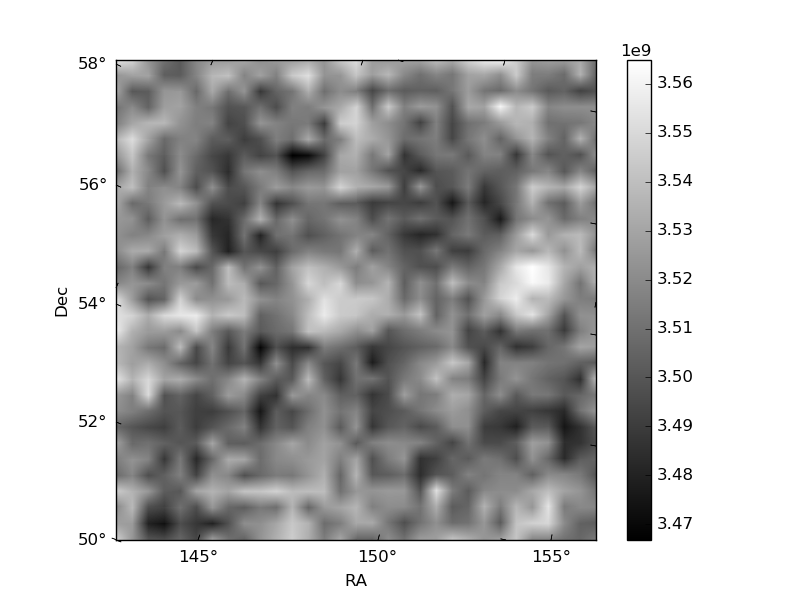
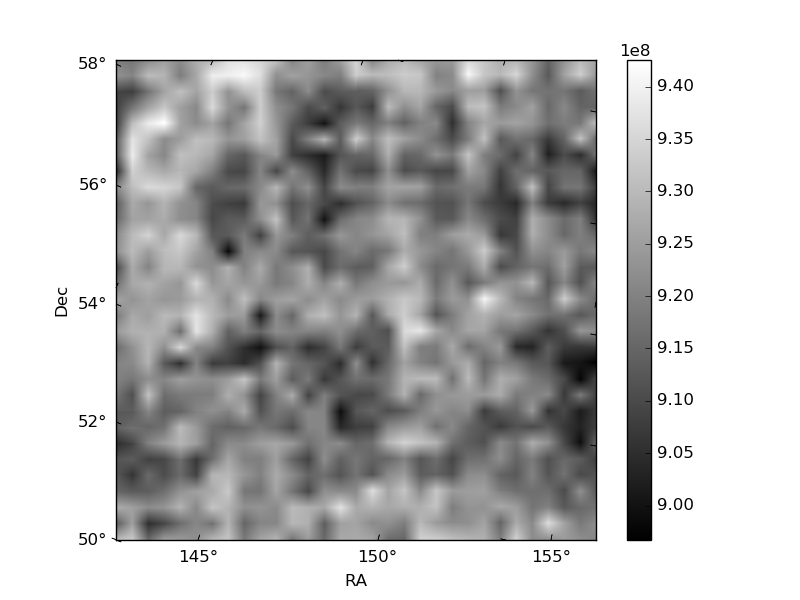
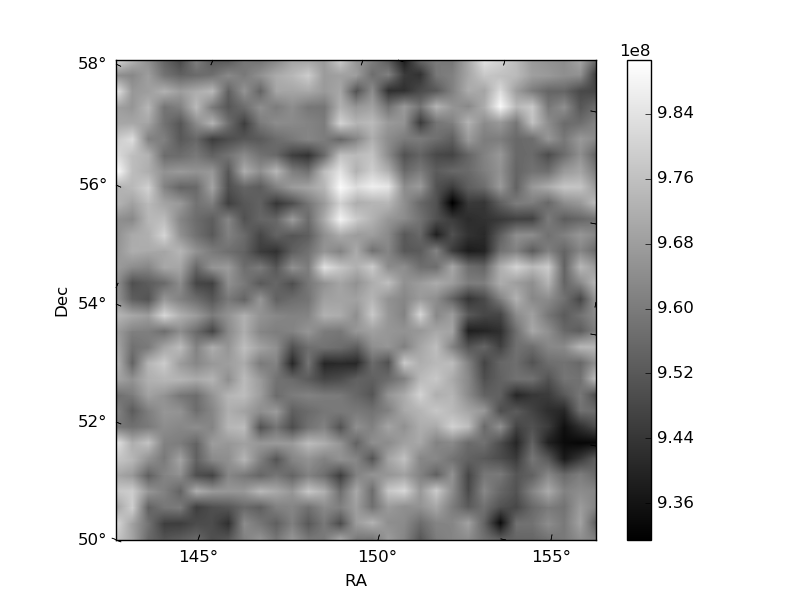
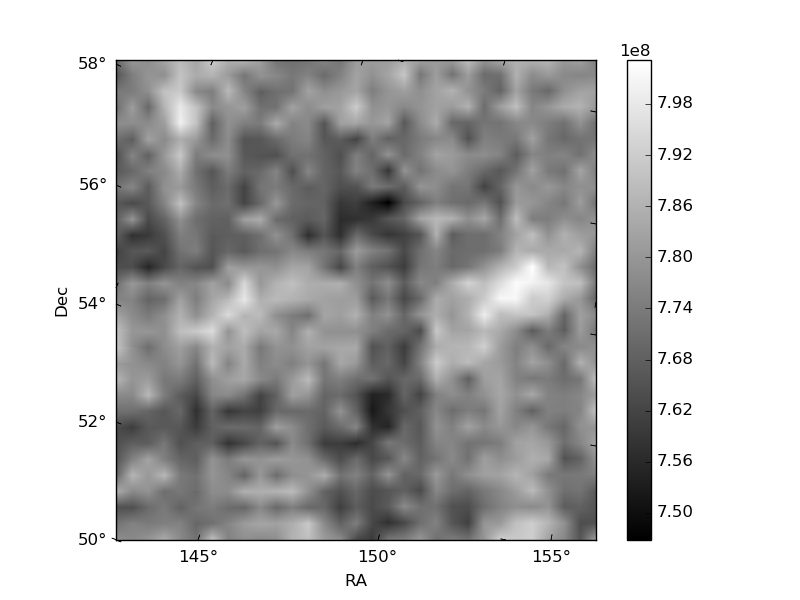
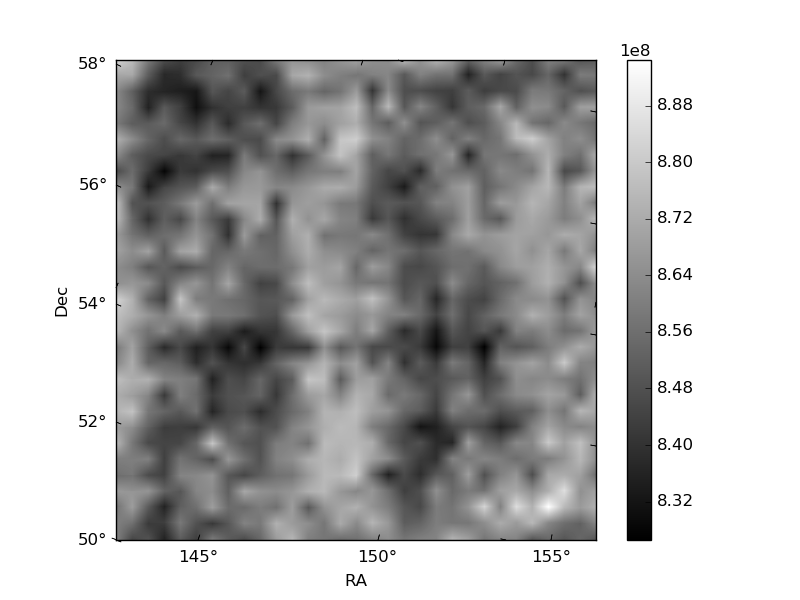
Histogram calculated using DETX and DETY for each event in the final _common_clean file
| Quadrant A | 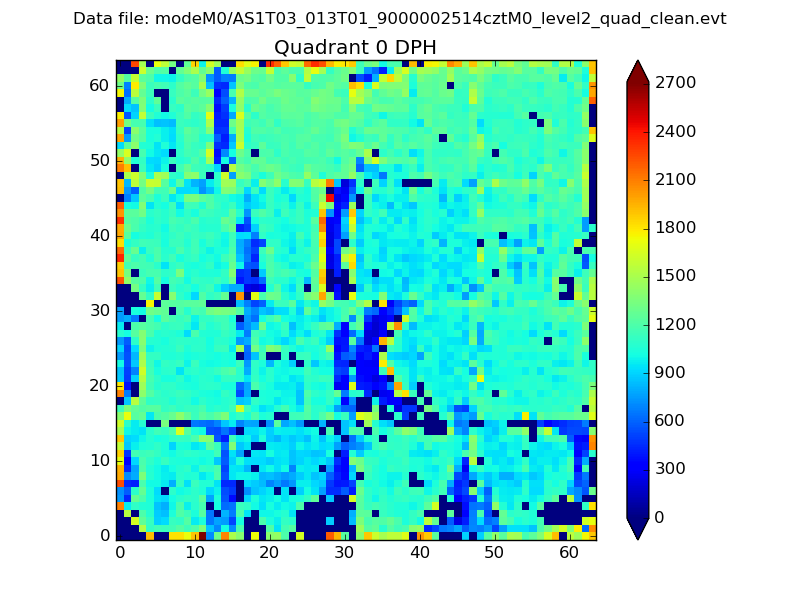 |
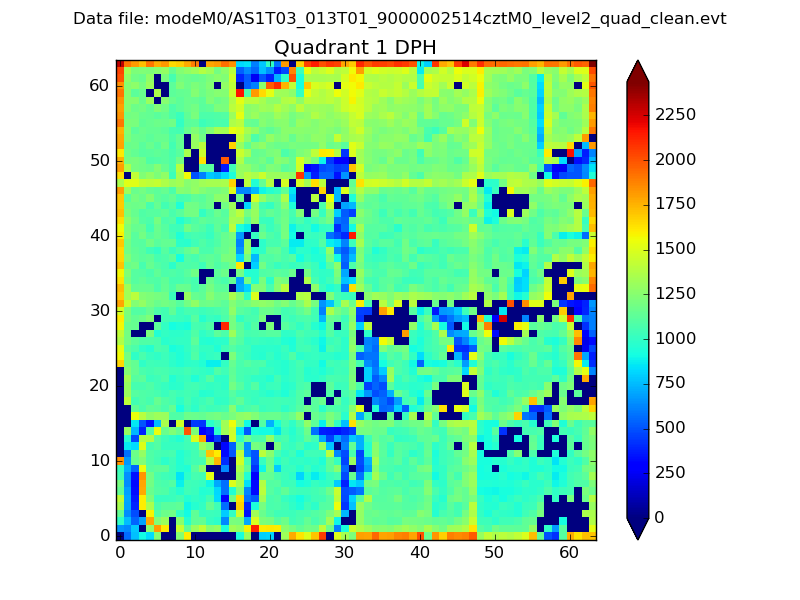 |
Quadrant B |
|---|---|---|---|
| Quadrant D | 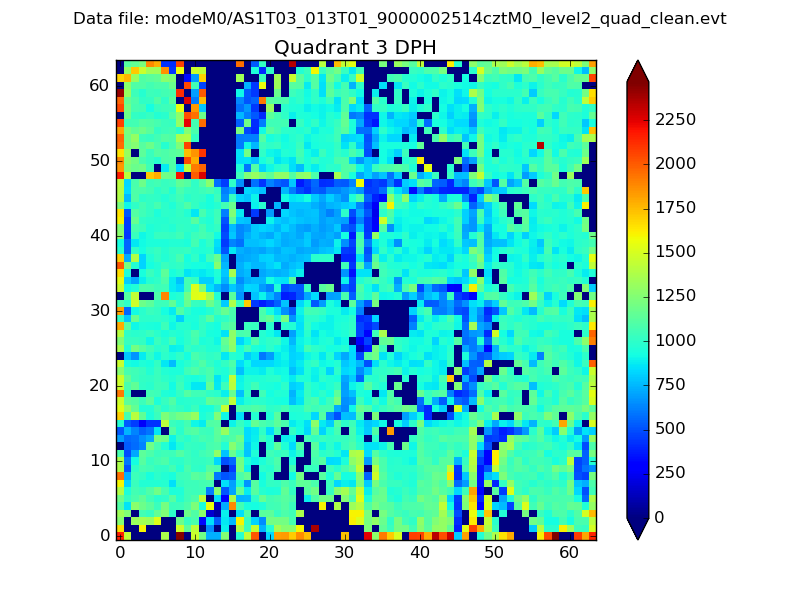 |
 |
Quadrant C |
| Plot type | Count rate plots | Images |
|---|---|---|
| Comparison with Poisson distribution Blue bars denote a histogram of data divided into 1 sec bins. Red curve is a Poisson curve with rate = median count rate of data. |
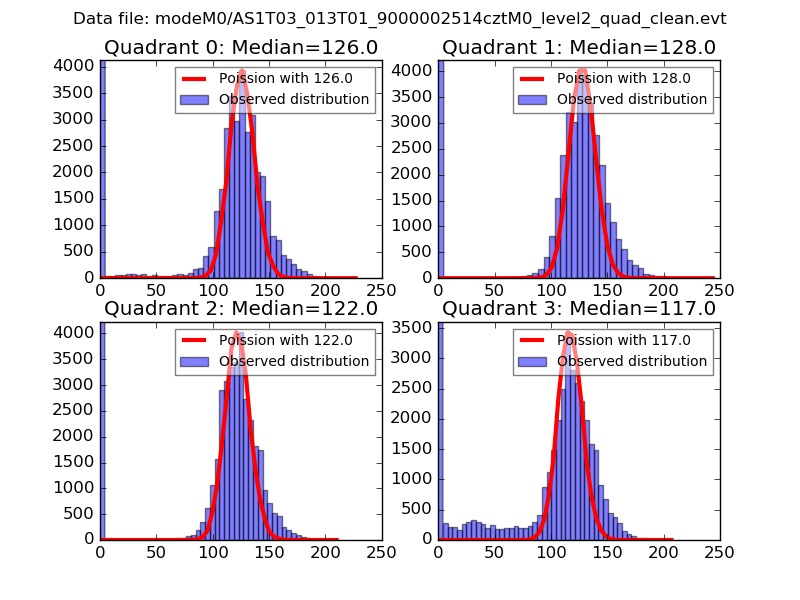 |
 |
| Quadrant-wise count rates Data is divided into 100 sec bins |
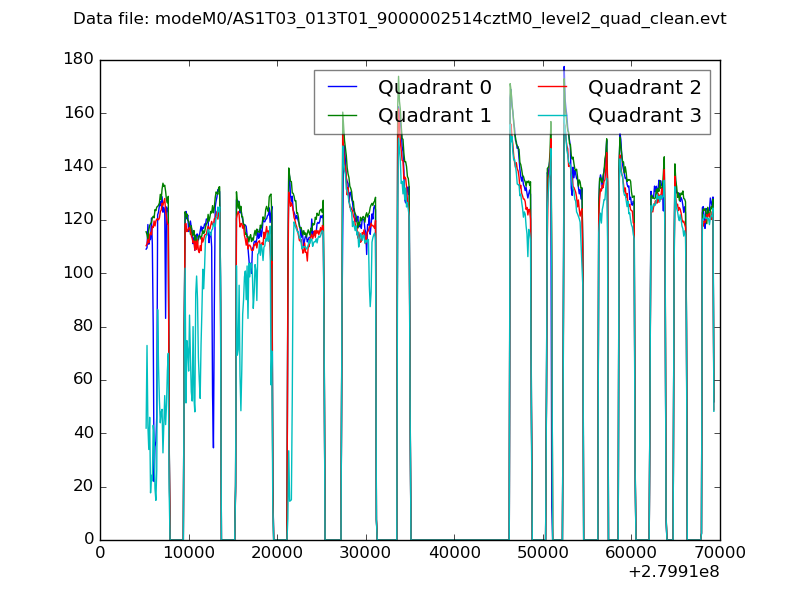 |
|
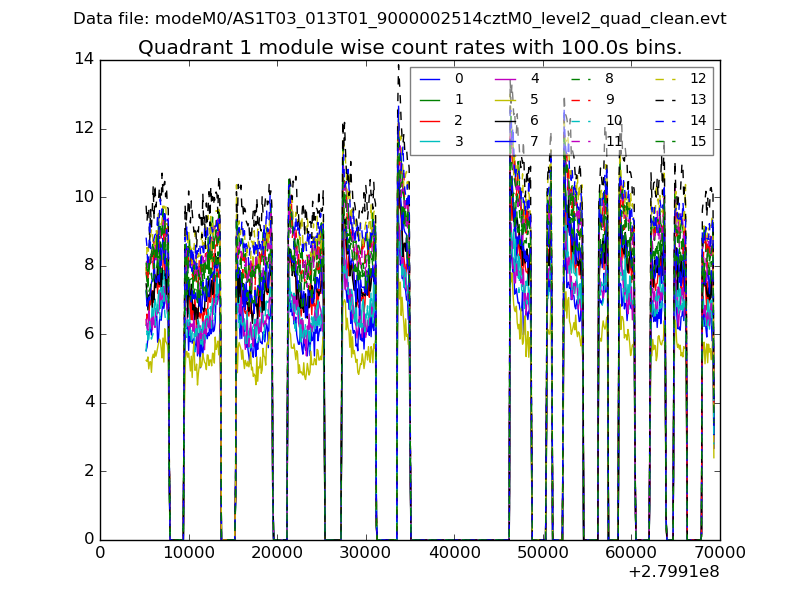
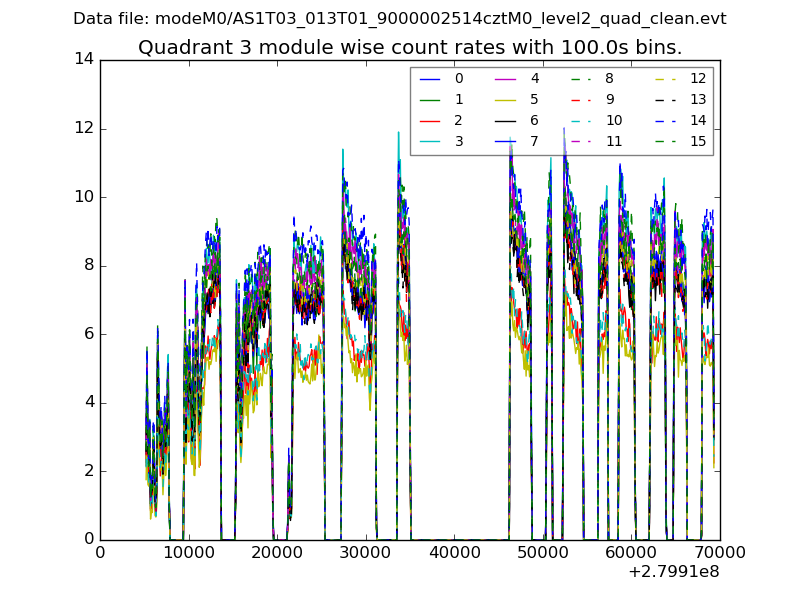
| Module-wise count rates for Quadrant A Data is divided into 100 sec bins |
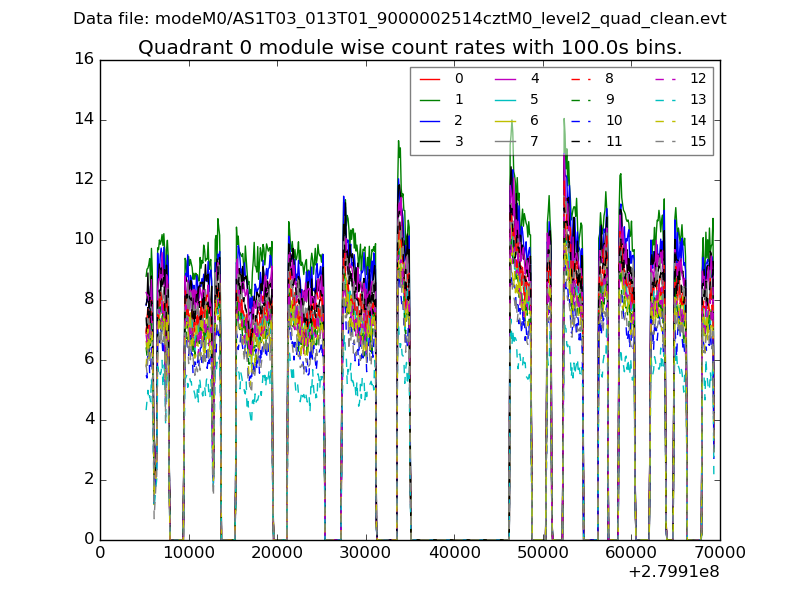 |
 |
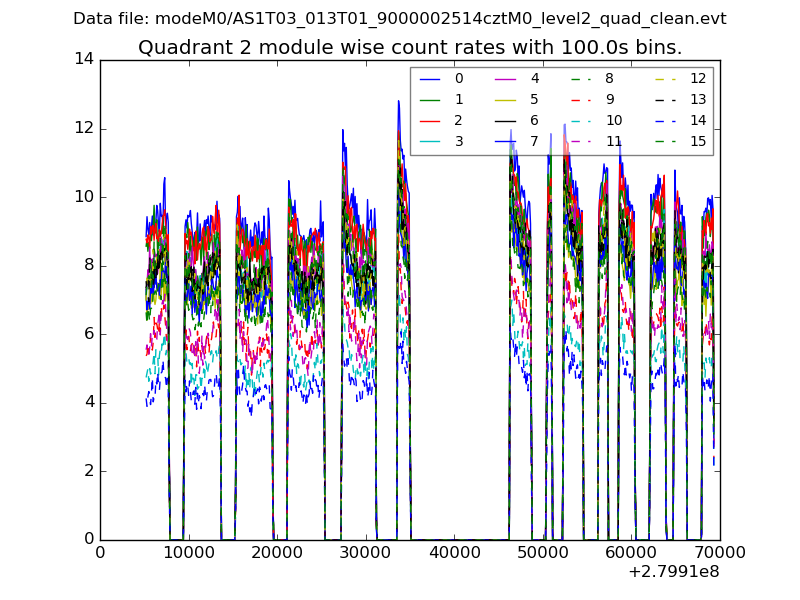
| Module-wise count rates for Quadrant B Data is divided into 100 sec bins |
 |
 |
| Module-wise count rates for Quadrant C Data is divided into 100 sec bins |
 |
 |
| Module-wise count rates for Quadrant D Data is divided into 100 sec bins |
 |
 |
| Parameter | Plot |
|---|---|
| CZT HV Monitor | 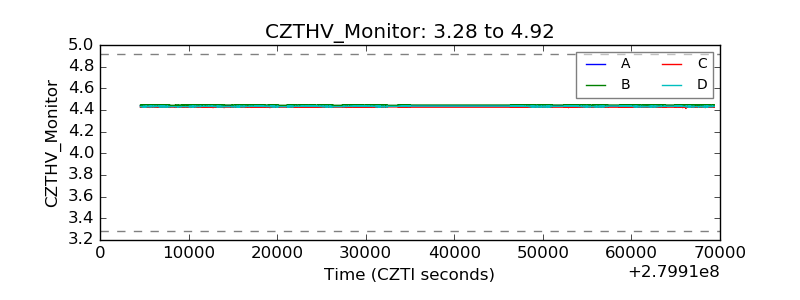 |
| D_VDD | 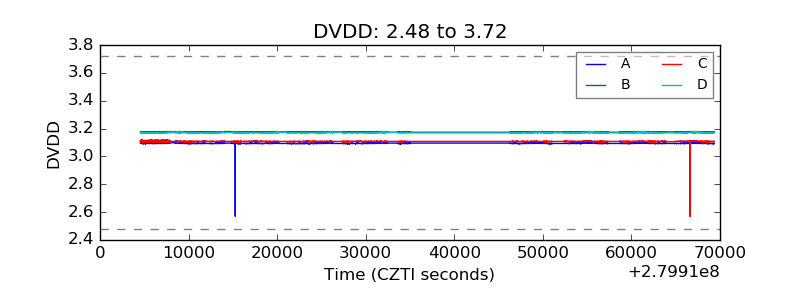 |
| Temperature 1 | 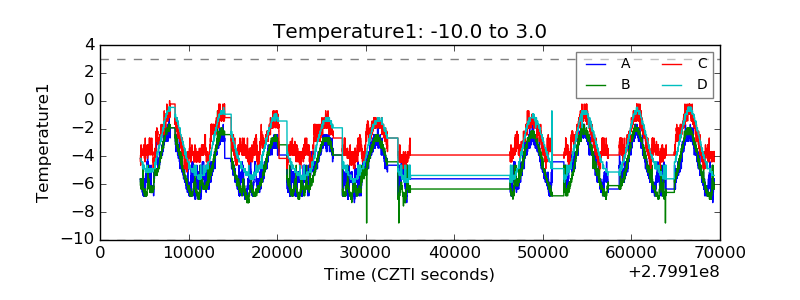 |
| Veto HV Monitor | 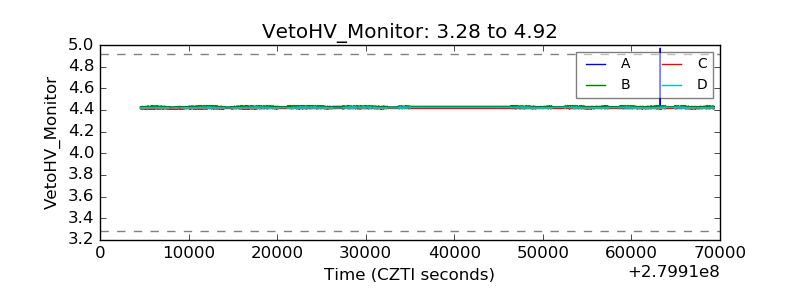 |
| Veto LLD | 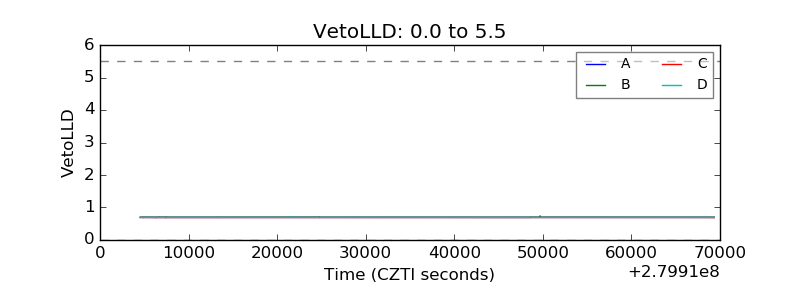 |
| Alpha Counter | 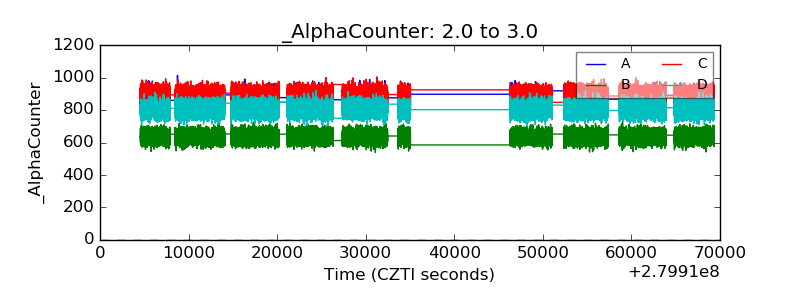 |
| _CPM_Rate | 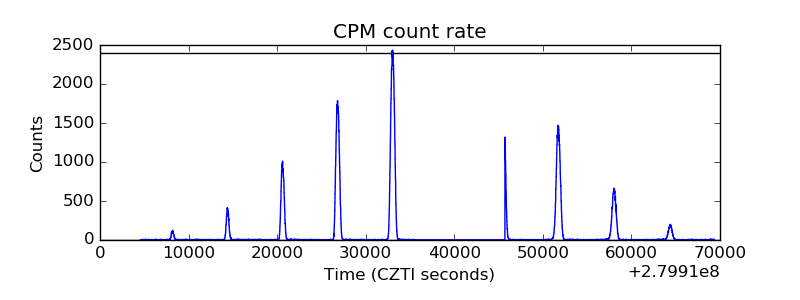 |
| CZT Counter | 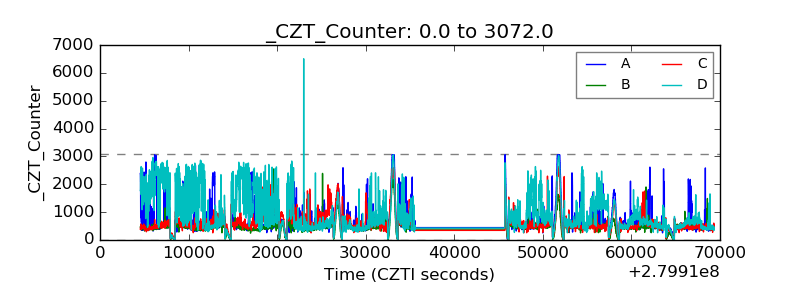 |
| +2.5 Volts monitor | 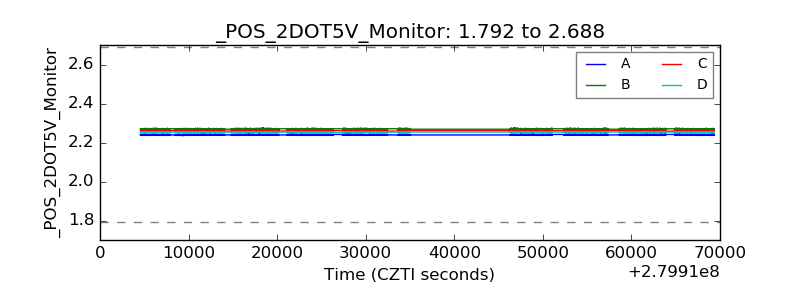 |
| +5 Volts monitor | 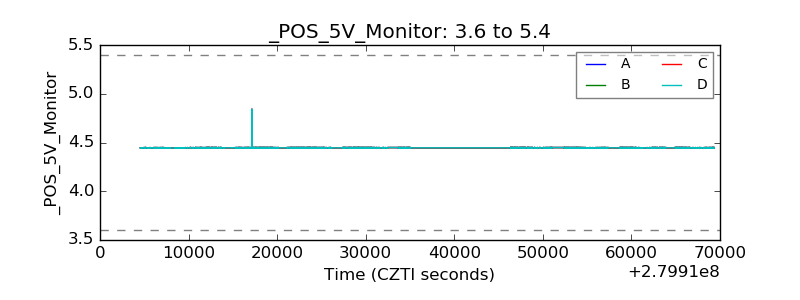 |
| _ROLL_ROT | 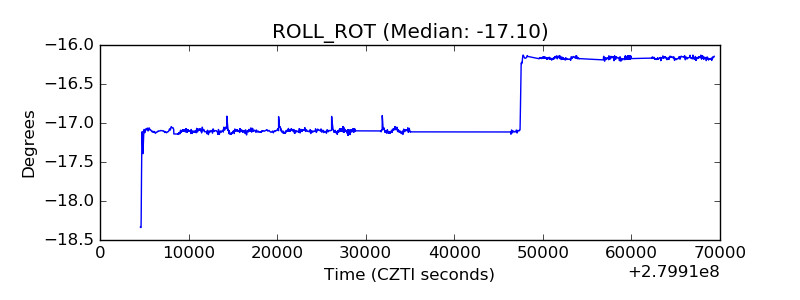 |
| _Roll_DEC | 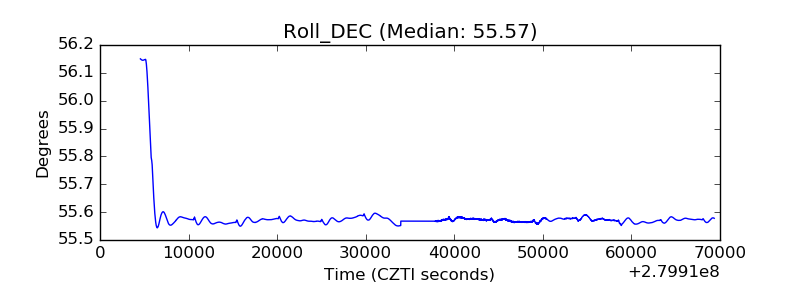 |
| _Roll_RA | 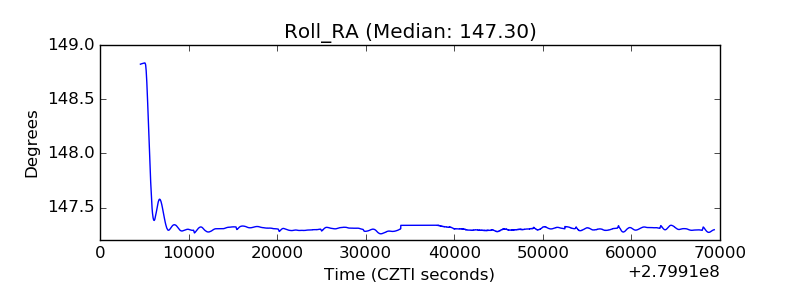 |
| Veto Counter | 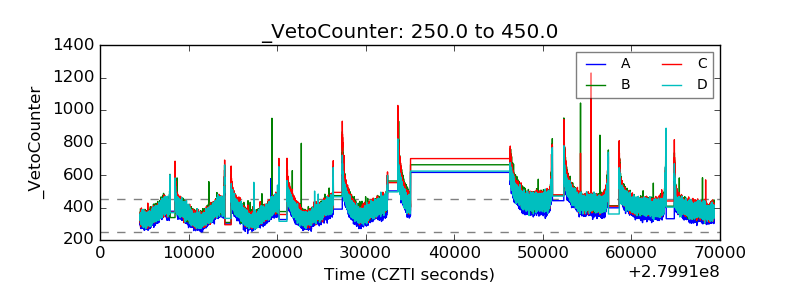 |