| Param | Original file | Final file |
|---|---|---|
| Filename | modeM0/AS1T03_013T01_9000002514_16929cztM0_level2.evt | modeM0/AS1T03_013T01_9000002514_16929cztM0_level2_quad_clean.evt |
| Size (bytes) | 1,410,373,440 | 168,402,240 |
| Size | 1.3 GB | 160.6 MB |
| Events in quadrant A | 9,657,074 | 1,118,716 |
| Events in quadrant B | 5,698,692 | 1,204,218 |
| Events in quadrant C | 7,001,377 | 1,157,924 |
| Events in quadrant D | 19,532,935 | 772,160 |
| Mode M0 | |||
|---|---|---|---|
| Quadrant | BADHDUFLAG | Total packets | Discarded packets |
| A | 0 | 37058 | 2 |
| B | 0 | 25479 | 2 |
| C | 0 | 28961 | 2 |
| D | 0 | 66464 | 2 |
| Mode M9 | |||
|---|---|---|---|
| Quadrant | BADHDUFLAG | Total packets | Discarded packets |
| A | 0 | 13 | 0 |
| B | 0 | 13 | 0 |
| C | 0 | 13 | 0 |
| D | 0 | 13 | 0 |
| Mode SS | |||
|---|---|---|---|
| Quadrant | BADHDUFLAG | Total packets | Discarded packets |
| A | 0 | 248 | 0 |
| B | 0 | 248 | 0 |
| C | 0 | 248 | 0 |
| D | 0 | 248 | 0 |
| Quadrant | Total seconds | Saturated seconds | Saturation percentage |
|---|---|---|---|
| A | 12218 | 1161 | 9.502374% |
| B | 12218 | 75 | 0.613848% |
| C | 12218 | 187 | 1.530529% |
| D | 12218 | 6025 | 49.312490% |
Noise dominated data is calculated using 1-second bins in cleaned event files. If a bin has >2000 counts, and if more than 50% of those come from <1% of pixels, then it is considered to be noise-dominated and hence unusable.
| Quadrant | # 1 sec bins | Bins with >0 counts | Bins with >2000 counts | High rate bins dominated by noise | Noise dominated (total time) | Noise dominated (detector-on time) | Marked lightcurve |
|---|---|---|---|---|---|---|---|
| A | 13504 | 12221 | 948 | 948 | 7.02% | 7.76% | 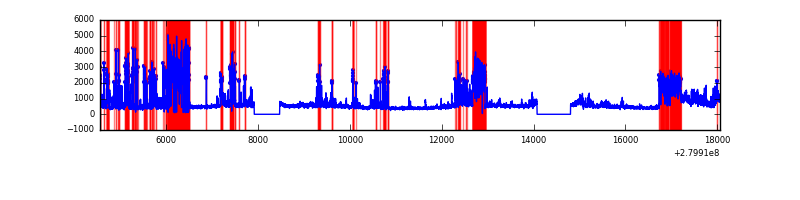 |
| B | 13504 | 12221 | 5 | 5 | 0.04% | 0.04% | 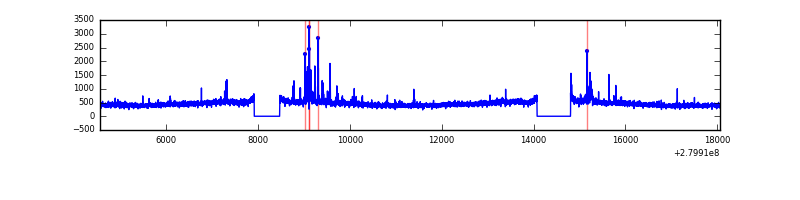 |
| C | 13504 | 12221 | 2 | 2 | 0.01% | 0.02% |  |
| D | 13504 | 12221 | 4168 | 4168 | 30.86% | 34.11% | 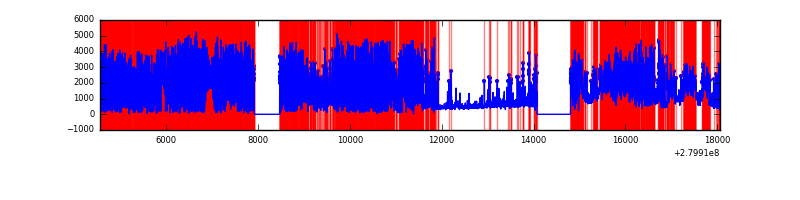 |
Top three noisy pixels from each quadrant. If the there are fewer than three noisy pixels in the level2.evt file, extra rows are filled as -1
| Pixel properties | Quadrant properties | ||||||
|---|---|---|---|---|---|---|---|
| Quadrant | DetID | PixID | Counts | Sigma | Mean | Median | Sigma |
| A | 15 | 174 | 4558359 | 17210.56 | 1324 | 1297 | 264.8 |
| A | 0 | 226 | 11630 | 39.02 | 1324 | 1297 | 264.8 |
| A | 3 | 137 | 9776 | 32.02 | 1324 | 1297 | 264.8 |
| B | 0 | 189 | 74582 | 278.04 | 1387 | 1352 | 263.4 |
| B | 15 | 35 | 59867 | 222.17 | 1387 | 1352 | 263.4 |
| B | 0 | 197 | 41010 | 150.57 | 1387 | 1352 | 263.4 |
| C | 3 | 233 | 1598372 | 5185.31 | 1325 | 1336 | 308.0 |
| C | 14 | 238 | 205366 | 662.45 | 1325 | 1336 | 308.0 |
| C | 5 | 112 | 12137 | 35.07 | 1325 | 1336 | 308.0 |
| D | 1 | 52 | 15723635 | 67542.43 | 971 | 945 | 232.8 |
| D | 2 | 152 | 46083 | 193.91 | 971 | 945 | 232.8 |
| D | 2 | 234 | 38863 | 162.89 | 971 | 945 | 232.8 |
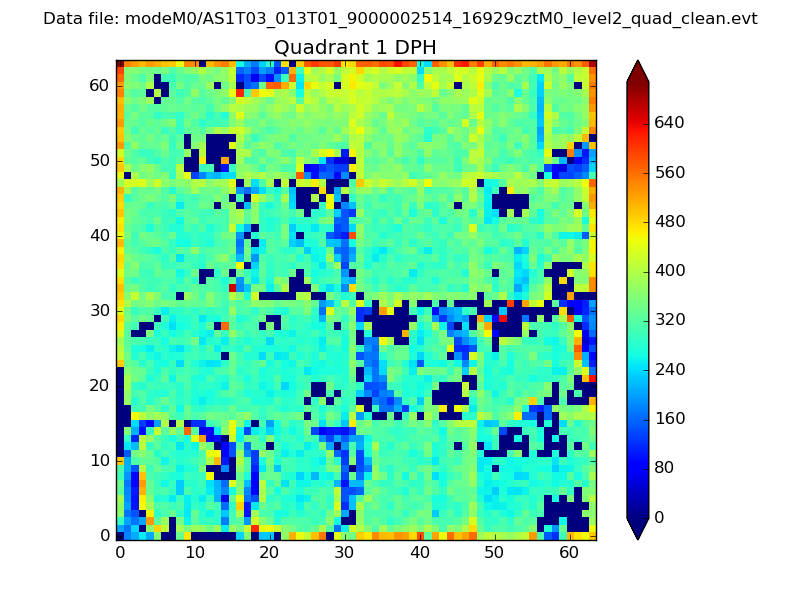
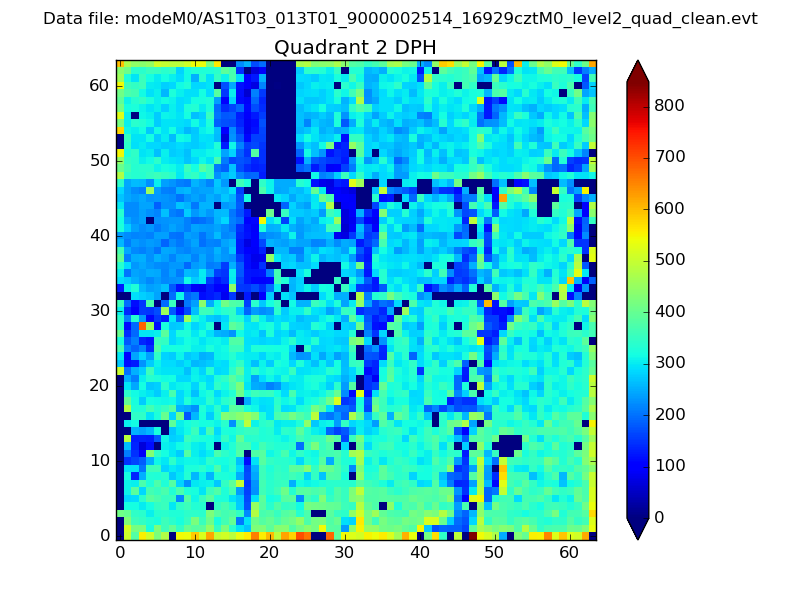
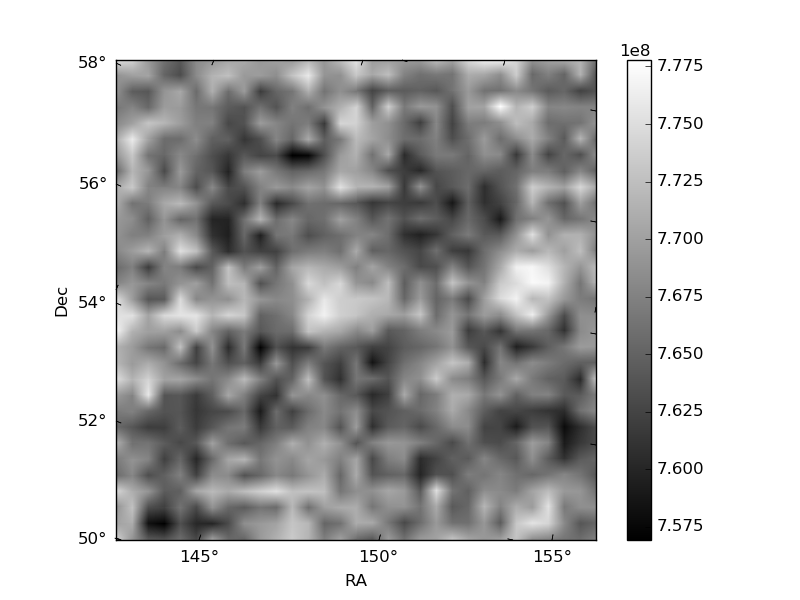
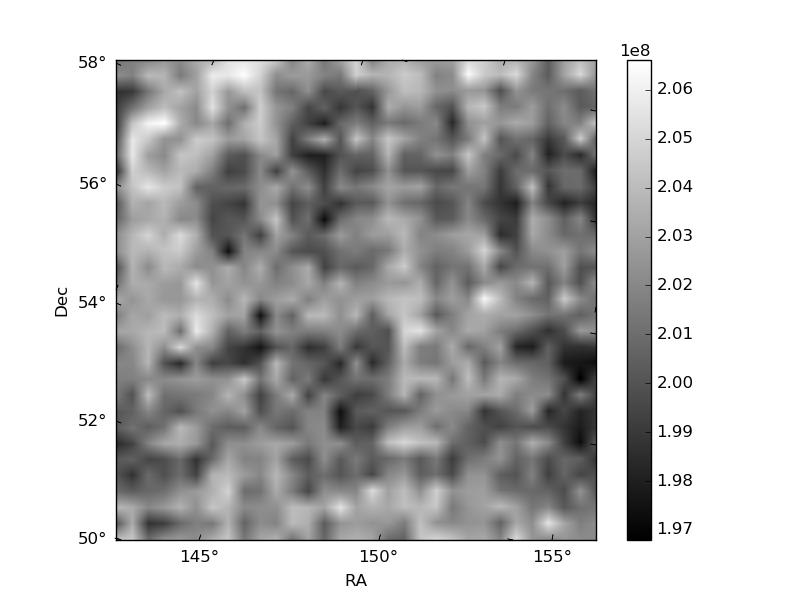
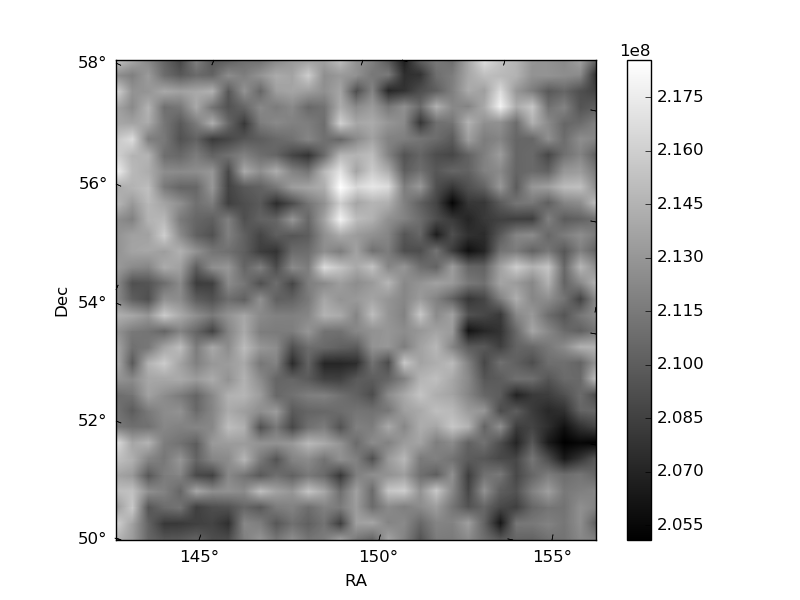
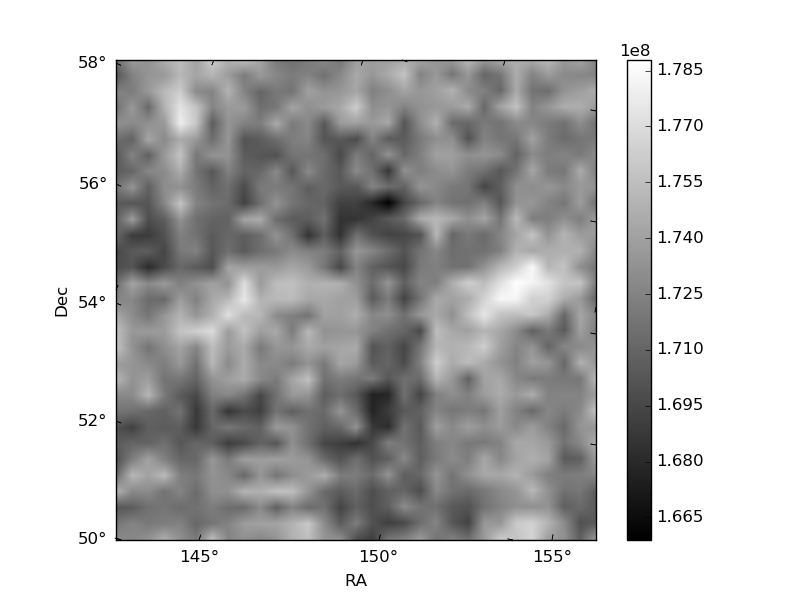
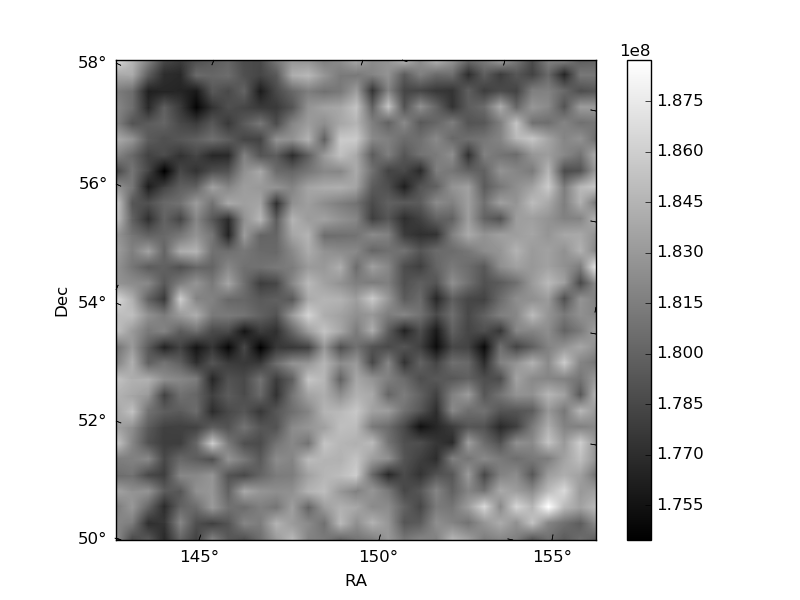
Histogram calculated using DETX and DETY for each event in the final _common_clean file
| Quadrant A | 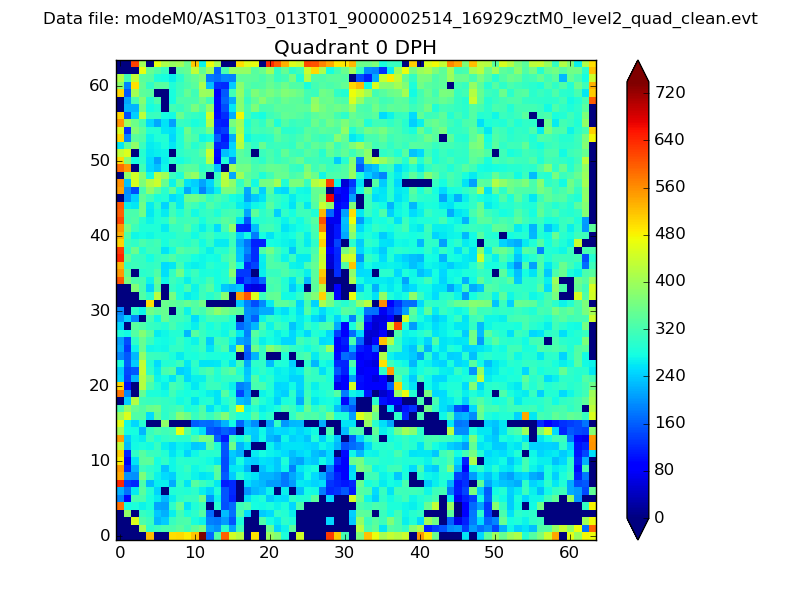 |
 |
Quadrant B |
|---|---|---|---|
| Quadrant D | 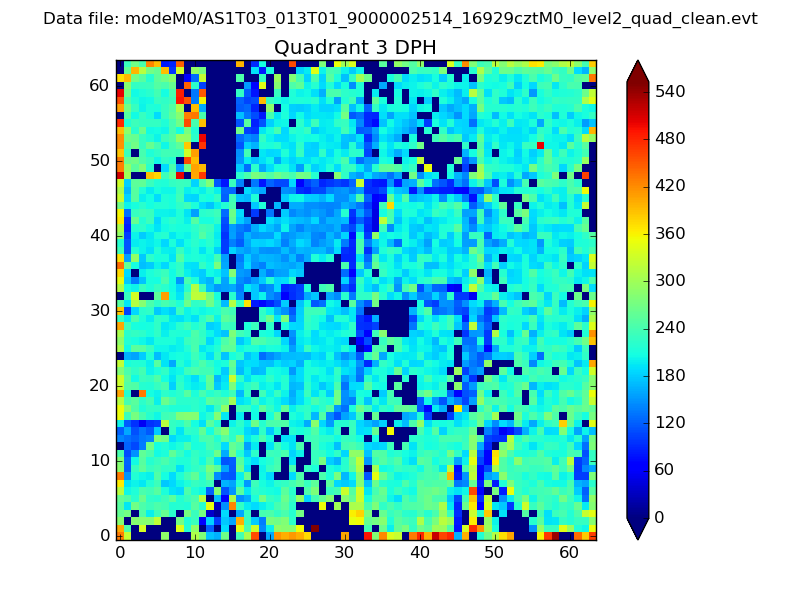 |
 |
Quadrant C |
| Plot type | Count rate plots | Images |
|---|---|---|
| Comparison with Poisson distribution Blue bars denote a histogram of data divided into 1 sec bins. Red curve is a Poisson curve with rate = median count rate of data. |
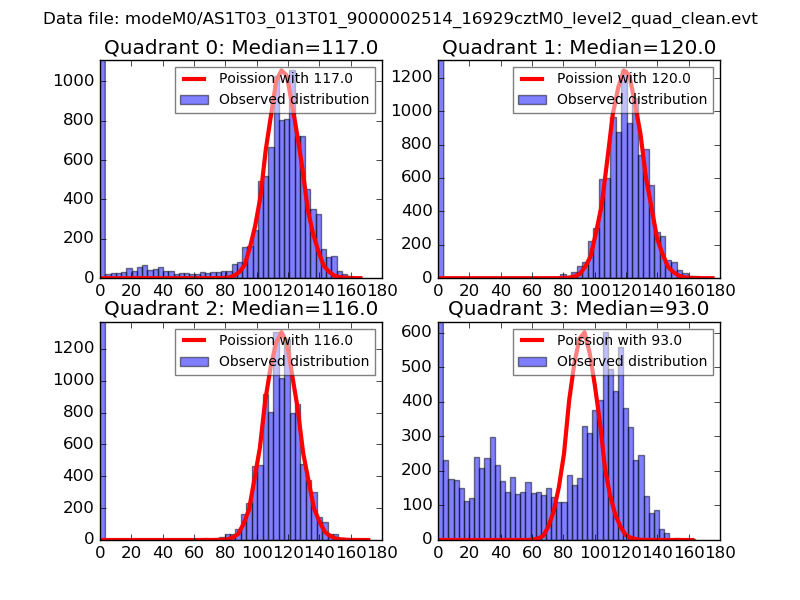 |
 |
| Quadrant-wise count rates Data is divided into 100 sec bins |
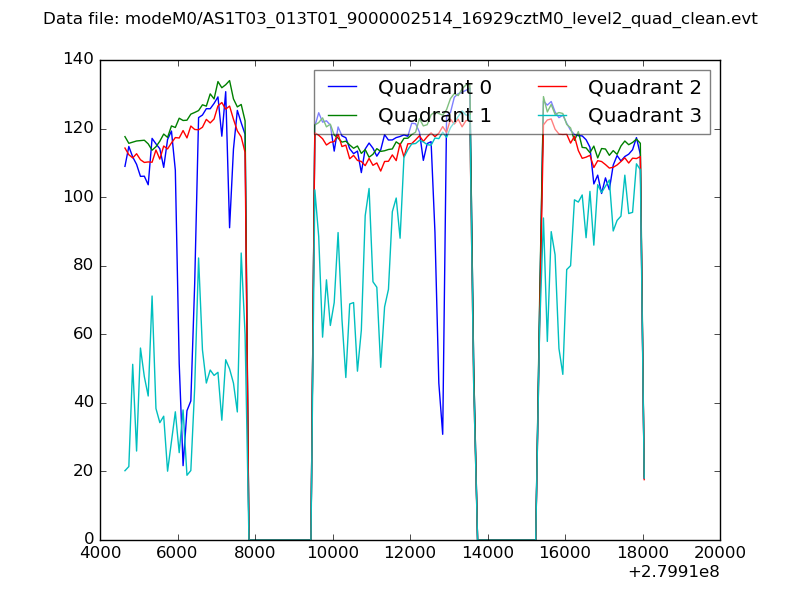 |
|
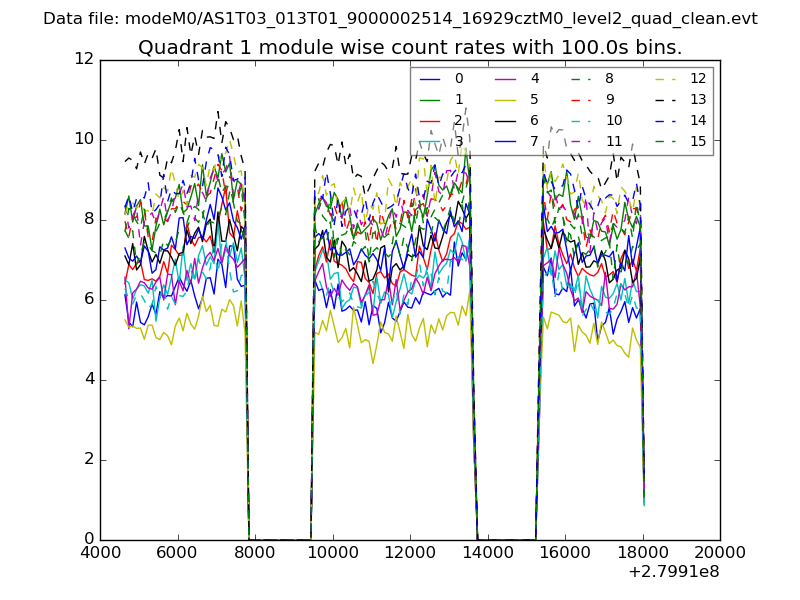
| Module-wise count rates for Quadrant A Data is divided into 100 sec bins |
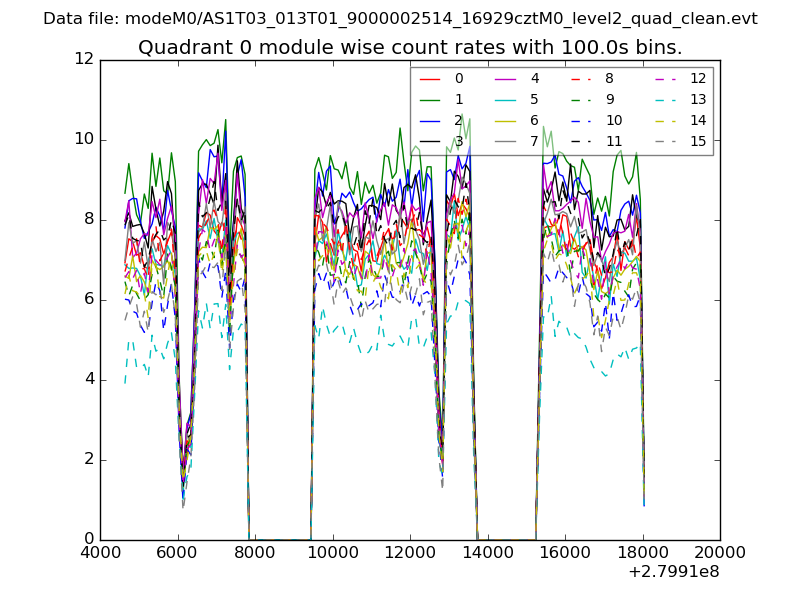 |
 |
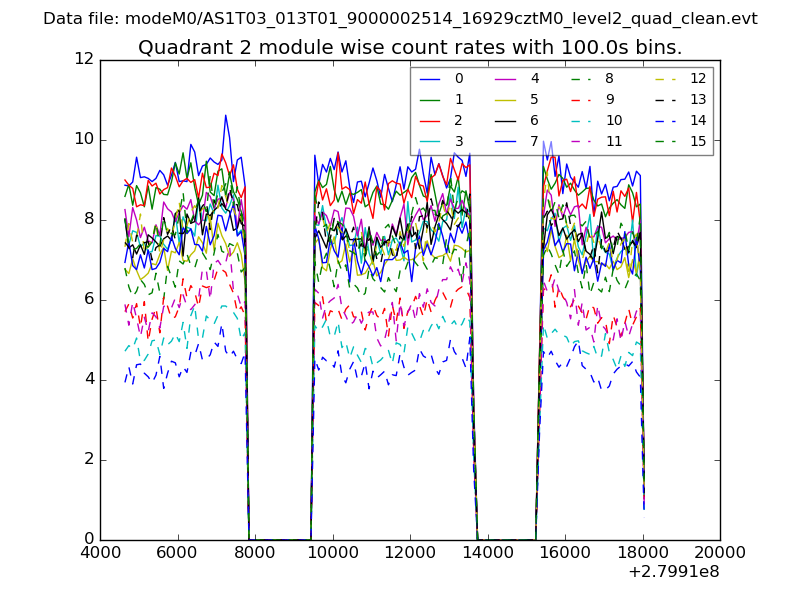
| Module-wise count rates for Quadrant B Data is divided into 100 sec bins |
 |
 |
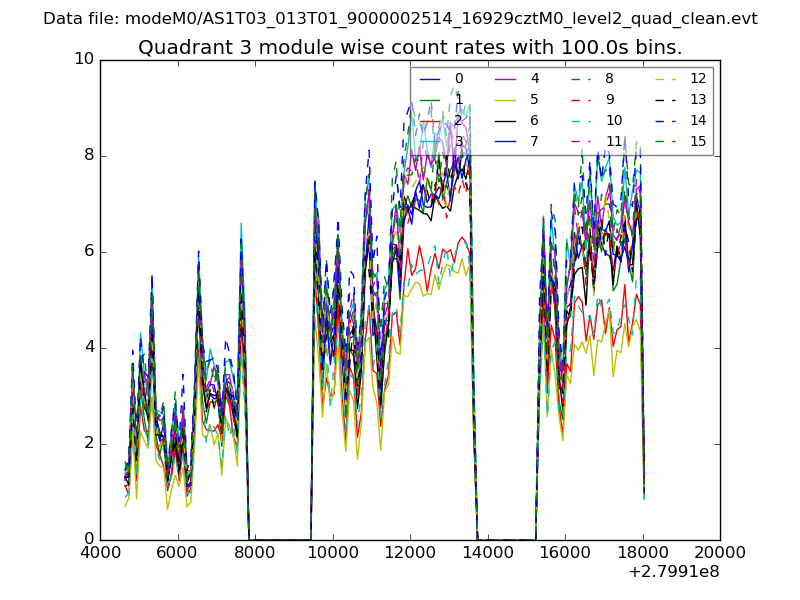
| Module-wise count rates for Quadrant C Data is divided into 100 sec bins |
 |
 |
| Module-wise count rates for Quadrant D Data is divided into 100 sec bins |
 |
 |
| Parameter | Plot |
|---|---|
| CZT HV Monitor | 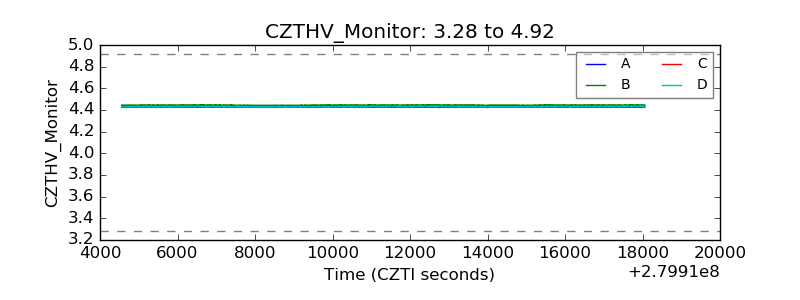 |
| D_VDD | 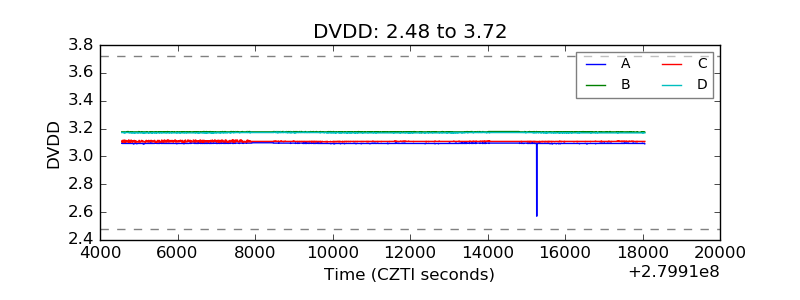 |
| Temperature 1 | 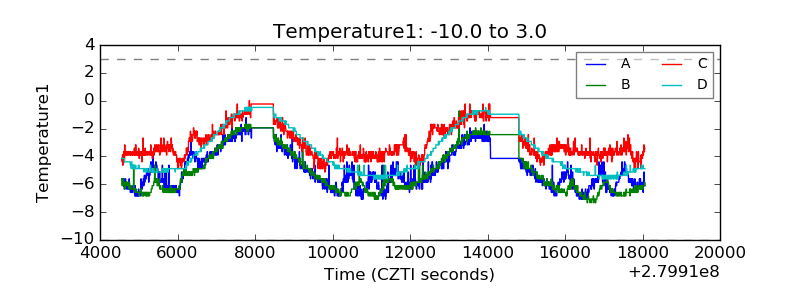 |
| Veto HV Monitor | 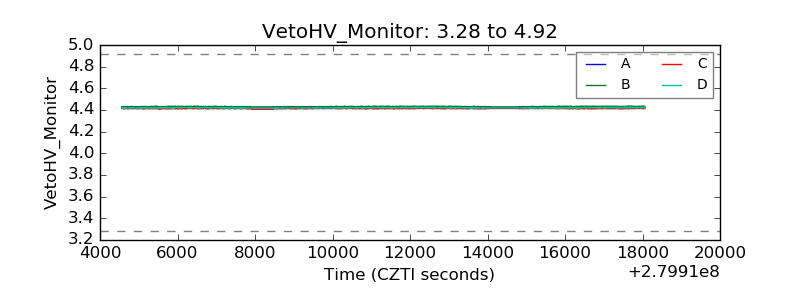 |
| Veto LLD | 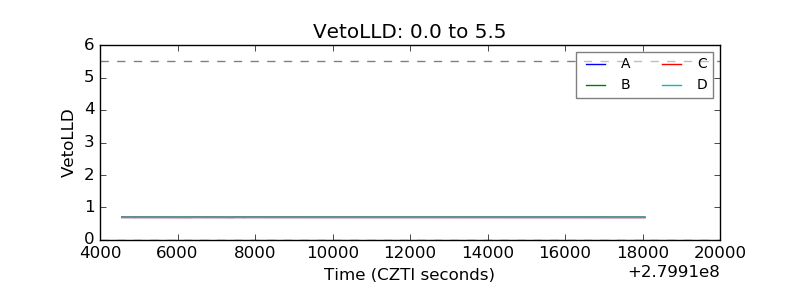 |
| Alpha Counter | 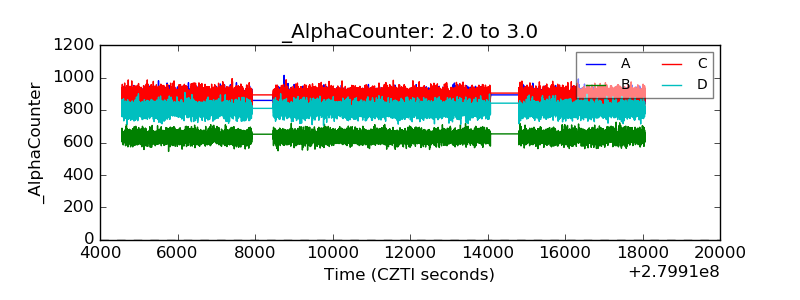 |
| _CPM_Rate | 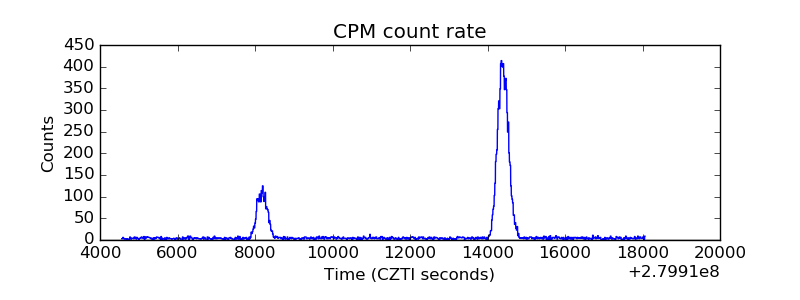 |
| CZT Counter | 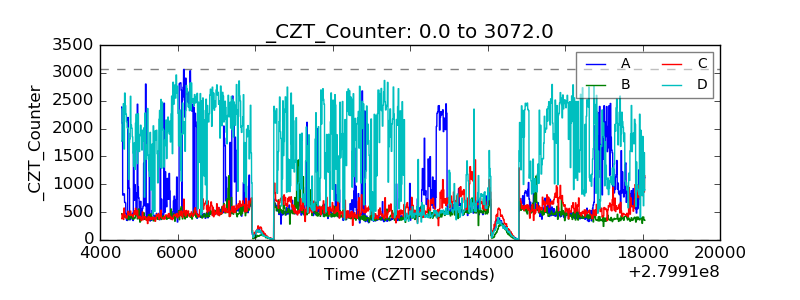 |
| +2.5 Volts monitor |  |
| +5 Volts monitor | 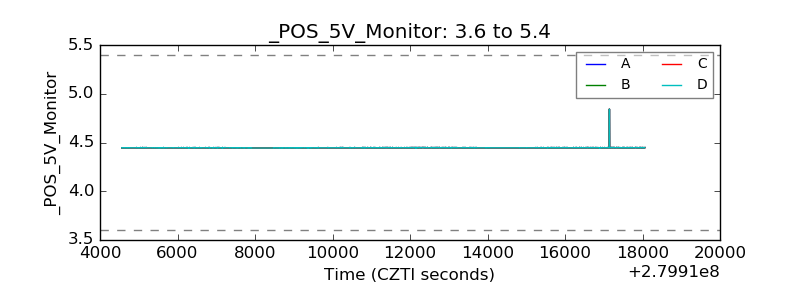 |
| _ROLL_ROT | 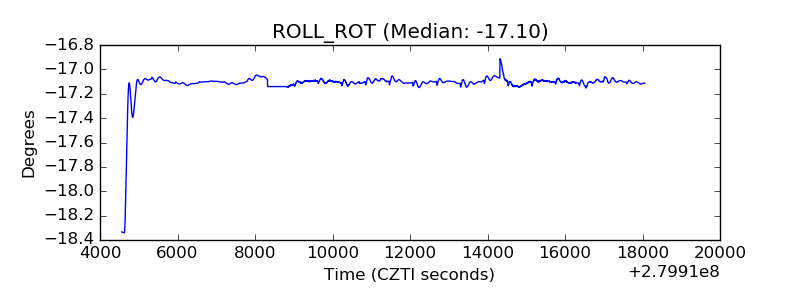 |
| _Roll_DEC | 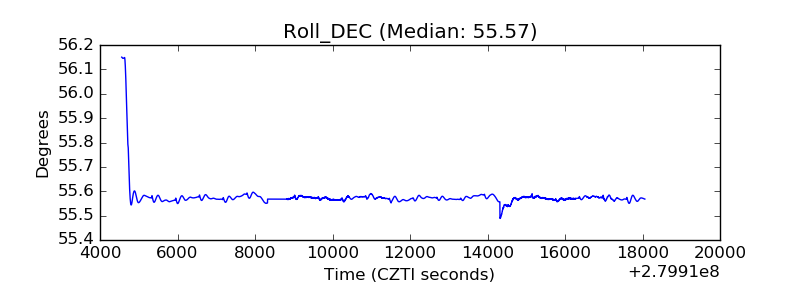 |
| _Roll_RA | 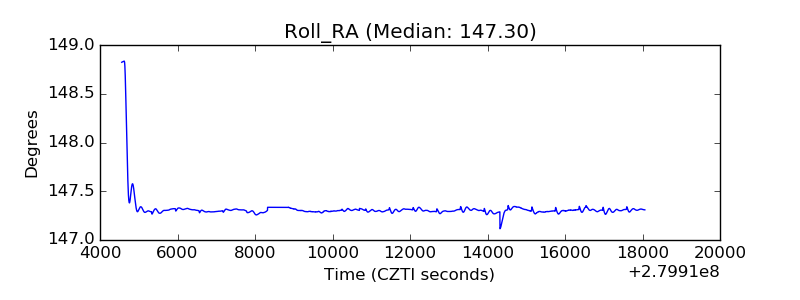 |
| Veto Counter | 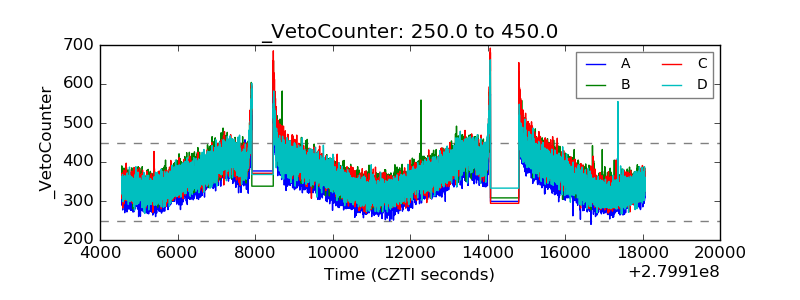 |