| Param | Original file | Final file |
|---|---|---|
| Filename | modeM0/AS1T03_013T01_9000002514_16930cztM0_level2.evt | modeM0/AS1T03_013T01_9000002514_16930cztM0_level2_quad_clean.evt |
| Size (bytes) | 864,887,040 | 134,130,240 |
| Size | 824.8 MB | 127.9 MB |
| Events in quadrant A | 6,394,569 | 883,996 |
| Events in quadrant B | 4,315,830 | 912,250 |
| Events in quadrant C | 7,847,326 | 857,725 |
| Events in quadrant D | 7,025,817 | 781,270 |
| Mode M0 | |||
|---|---|---|---|
| Quadrant | BADHDUFLAG | Total packets | Discarded packets |
| A | 0 | 24932 | 2 |
| B | 0 | 18840 | 2 |
| C | 0 | 29735 | 2 |
| D | 0 | 27256 | 2 |
| Mode M9 | |||
|---|---|---|---|
| Quadrant | BADHDUFLAG | Total packets | Discarded packets |
| A | 0 | 19 | 0 |
| B | 0 | 19 | 0 |
| C | 0 | 19 | 0 |
| D | 0 | 19 | 0 |
| Mode SS | |||
|---|---|---|---|
| Quadrant | BADHDUFLAG | Total packets | Discarded packets |
| A | 0 | 186 | 0 |
| B | 0 | 186 | 0 |
| C | 0 | 186 | 0 |
| D | 0 | 186 | 0 |
| Quadrant | Total seconds | Saturated seconds | Saturation percentage |
|---|---|---|---|
| A | 9025 | 277 | 3.069252% |
| B | 9026 | 73 | 0.808775% |
| C | 9025 | 516 | 5.717452% |
| D | 9025 | 1169 | 12.952909% |
Noise dominated data is calculated using 1-second bins in cleaned event files. If a bin has >2000 counts, and if more than 50% of those come from <1% of pixels, then it is considered to be noise-dominated and hence unusable.
| Quadrant | # 1 sec bins | Bins with >0 counts | Bins with >2000 counts | High rate bins dominated by noise | Noise dominated (total time) | Noise dominated (detector-on time) | Marked lightcurve |
|---|---|---|---|---|---|---|---|
| A | 10951 | 9028 | 111 | 111 | 1.01% | 1.23% | 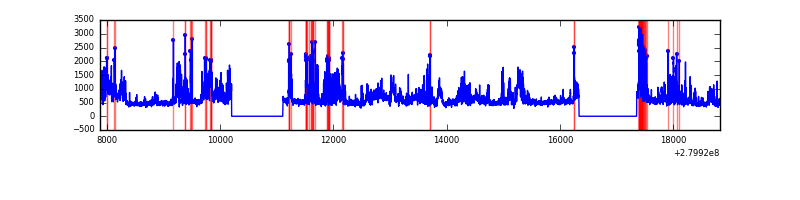 |
| B | 10952 | 9029 | 21 | 21 | 0.19% | 0.23% |  |
| C | 10951 | 9028 | 56 | 56 | 0.51% | 0.62% | 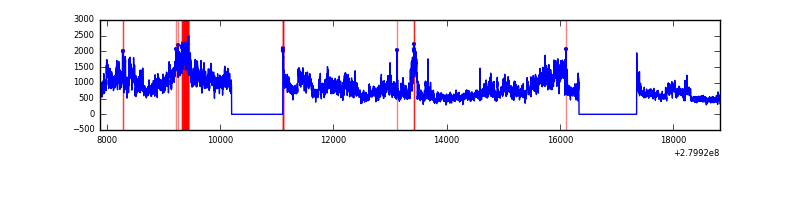 |
| D | 10951 | 9028 | 570 | 570 | 5.21% | 6.31% |  |
Top three noisy pixels from each quadrant. If the there are fewer than three noisy pixels in the level2.evt file, extra rows are filled as -1
| Pixel properties | Quadrant properties | ||||||
|---|---|---|---|---|---|---|---|
| Quadrant | DetID | PixID | Counts | Sigma | Mean | Median | Sigma |
| A | 15 | 174 | 2339067 | 10992.4 | 1055 | 1031 | 212.7 |
| A | 0 | 226 | 9321 | 38.98 | 1055 | 1031 | 212.7 |
| A | 3 | 137 | 7625 | 31.0 | 1055 | 1031 | 212.7 |
| B | 15 | 35 | 107045 | 522.3 | 1060 | 1033 | 203.0 |
| B | 12 | 111 | 24054 | 113.42 | 1060 | 1033 | 203.0 |
| B | 11 | 111 | 21126 | 98.99 | 1060 | 1033 | 203.0 |
| C | 3 | 233 | 3747876 | 16059.6 | 1008 | 1014 | 233.3 |
| C | 14 | 238 | 154595 | 658.27 | 1008 | 1014 | 233.3 |
| C | 14 | 225 | 11031 | 42.93 | 1008 | 1014 | 233.3 |
| D | 1 | 52 | 3366559 | 15024.52 | 929 | 902 | 224.0 |
| D | 2 | 152 | 62246 | 273.84 | 929 | 902 | 224.0 |
| D | 15 | 145 | 48541 | 212.66 | 929 | 902 | 224.0 |
Histogram calculated using DETX and DETY for each event in the final _common_clean file
| Quadrant A | 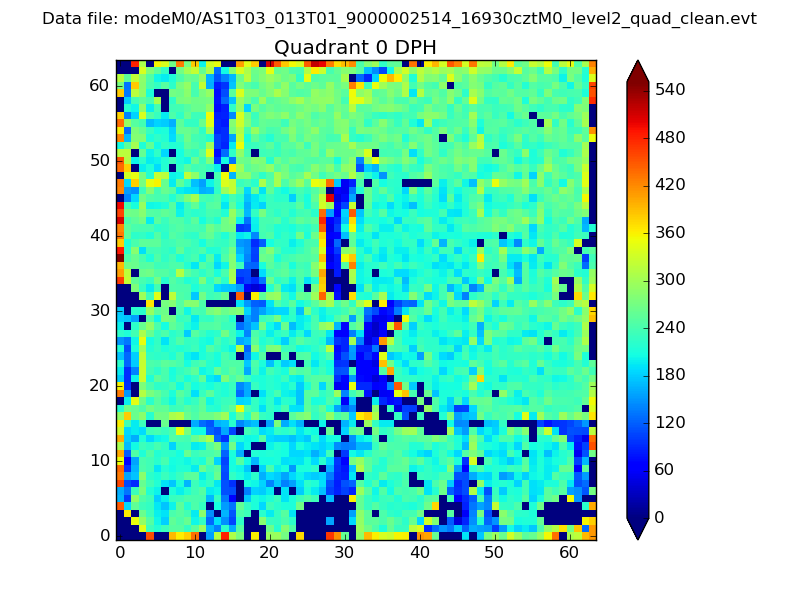 |
 |
Quadrant B |
|---|---|---|---|
| Quadrant D | 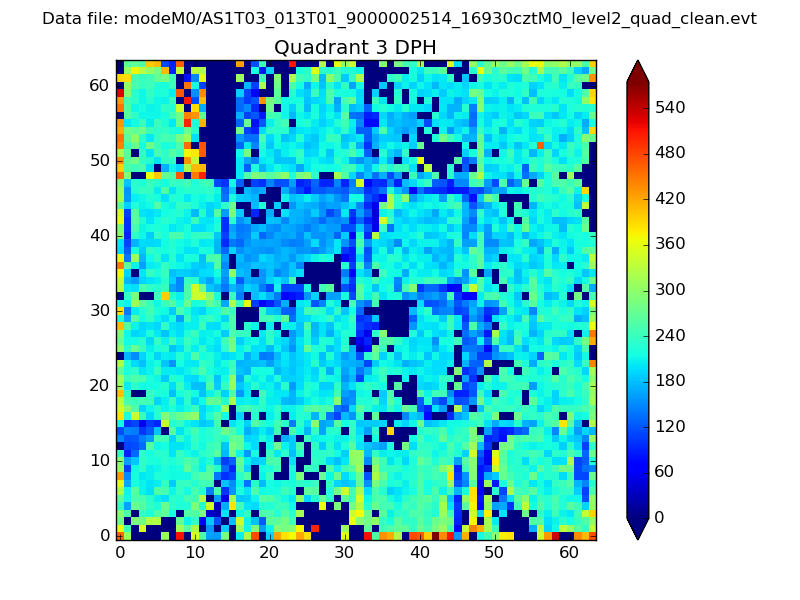 |
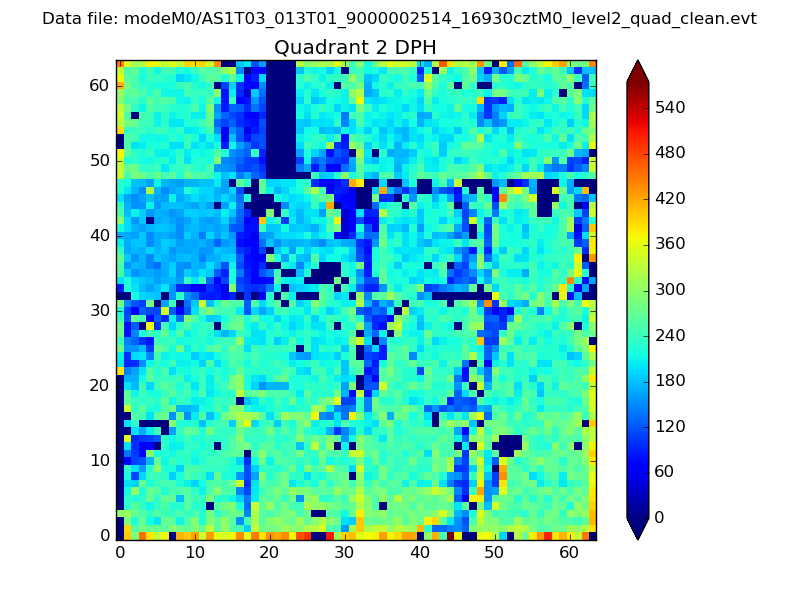 |
Quadrant C |
| Plot type | Count rate plots | Images |
|---|---|---|
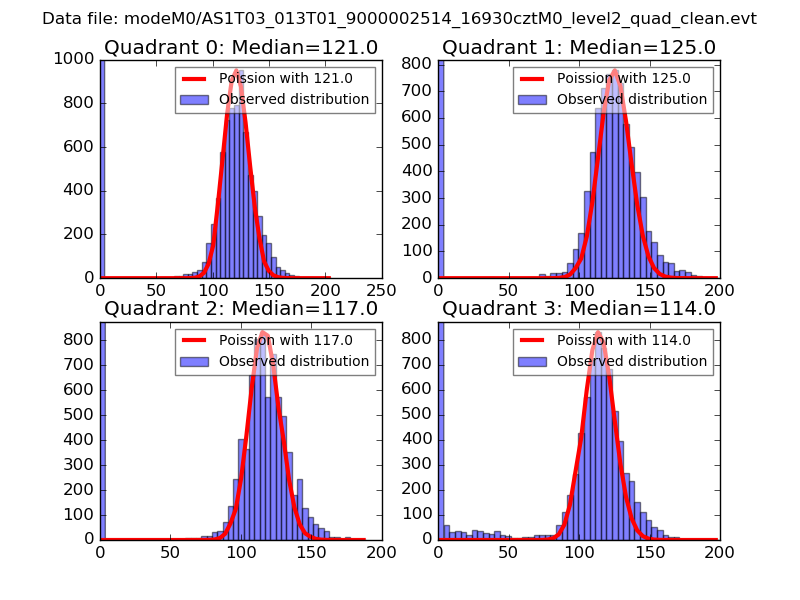
| Comparison with Poisson distribution Blue bars denote a histogram of data divided into 1 sec bins. Red curve is a Poisson curve with rate = median count rate of data. |
 |
 |
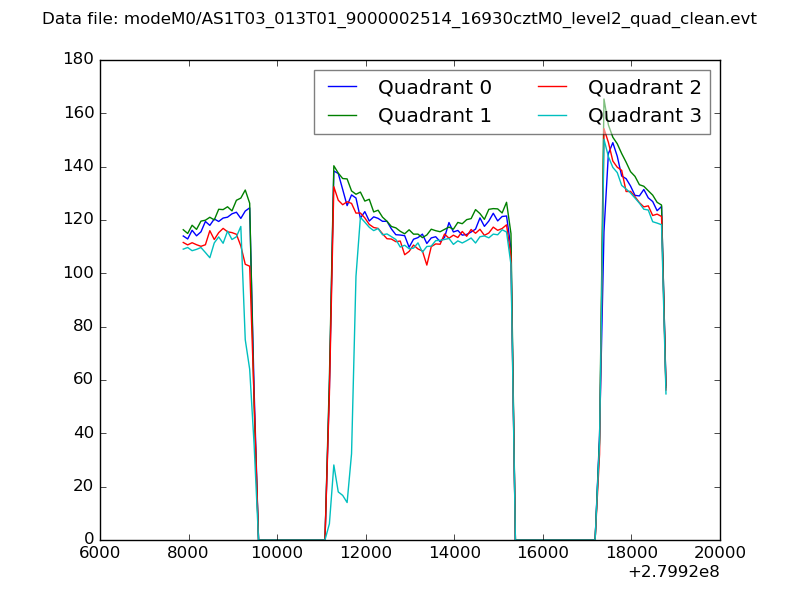
| Quadrant-wise count rates Data is divided into 100 sec bins |
 |
|
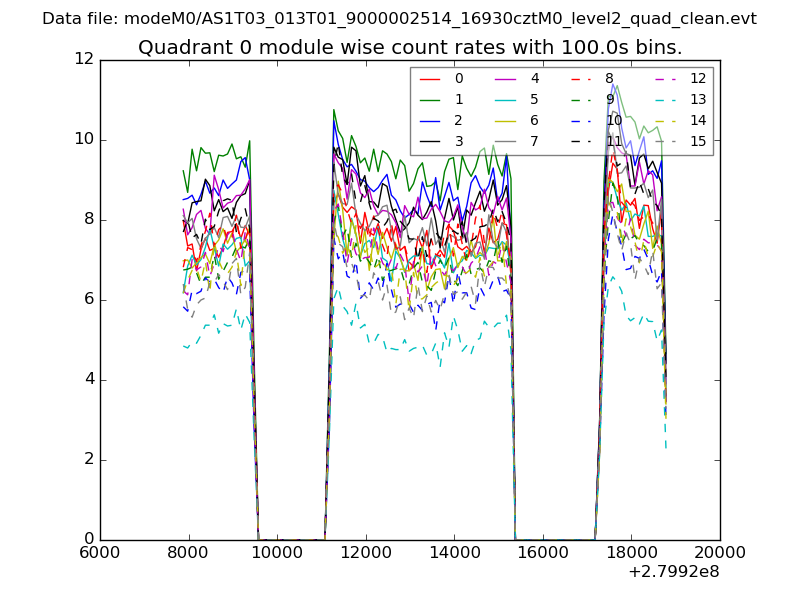
| Module-wise count rates for Quadrant A Data is divided into 100 sec bins |
 |
 |
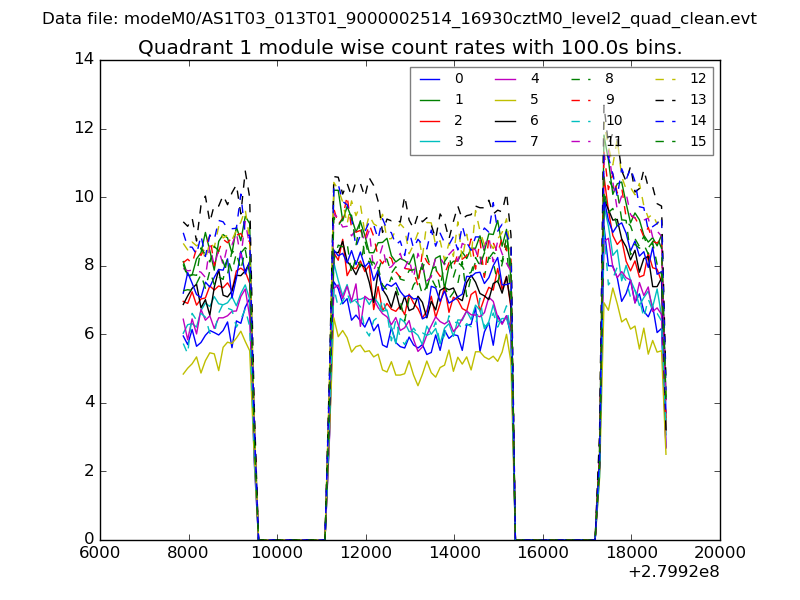
| Module-wise count rates for Quadrant B Data is divided into 100 sec bins |
 |
 |
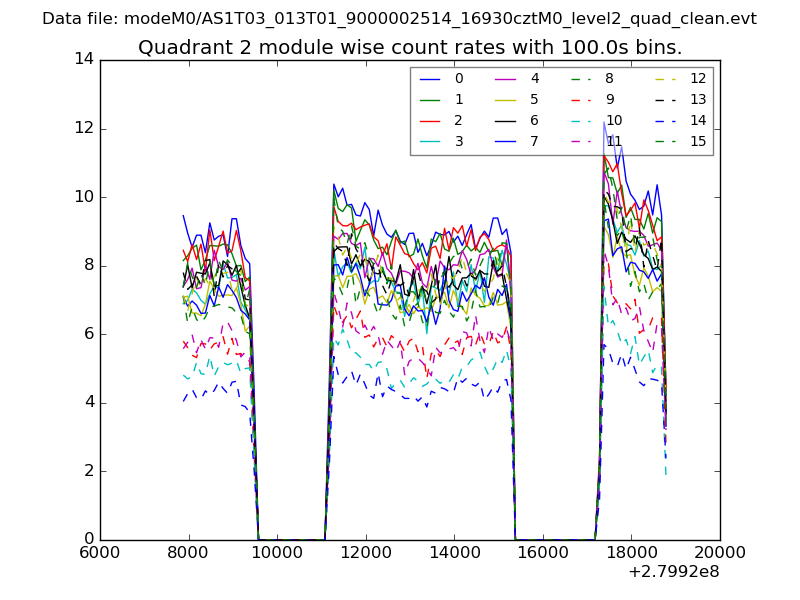
| Module-wise count rates for Quadrant C Data is divided into 100 sec bins |
 |
 |
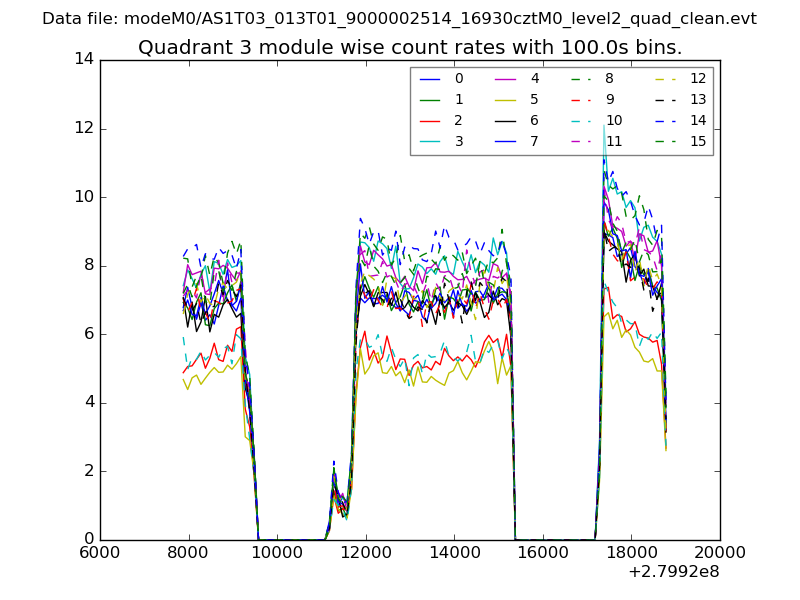
| Module-wise count rates for Quadrant D Data is divided into 100 sec bins |
 |
 |
| Parameter | Plot |
|---|---|
| CZT HV Monitor | 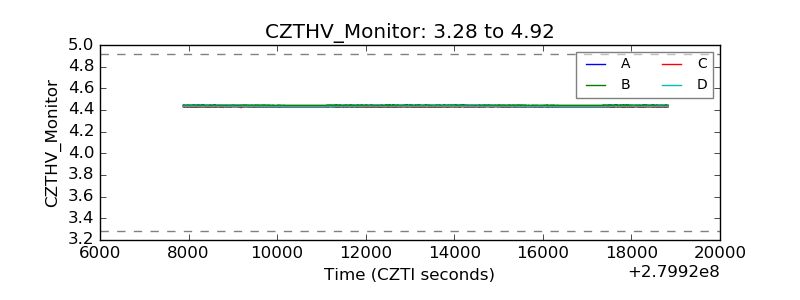 |
| D_VDD | 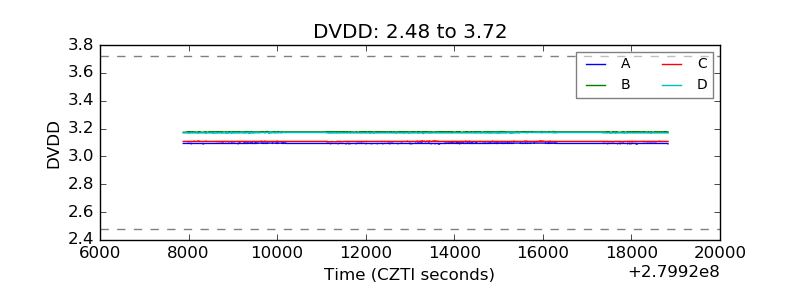 |
| Temperature 1 |  |
| Veto HV Monitor | 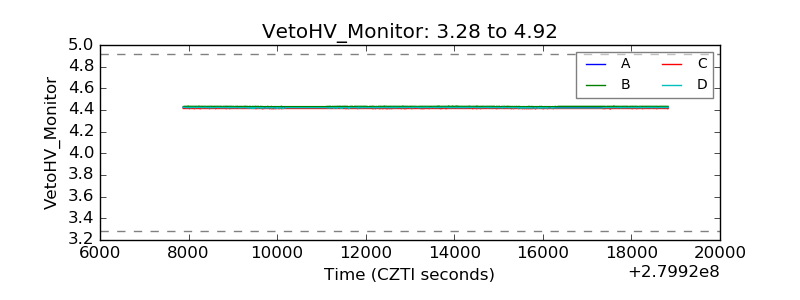 |
| Veto LLD |  |
| Alpha Counter | 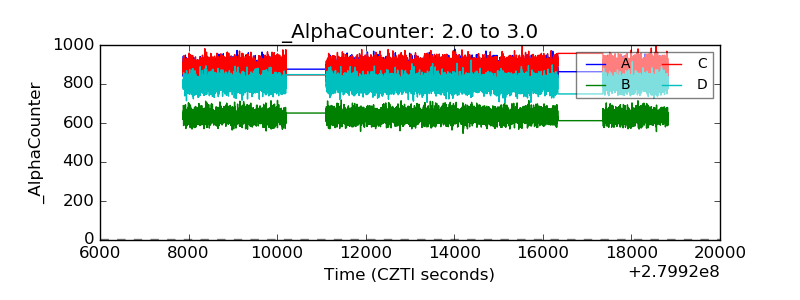 |
| _CPM_Rate | 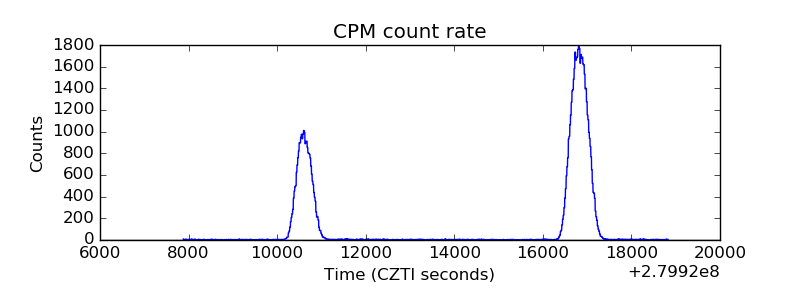 |
| CZT Counter | 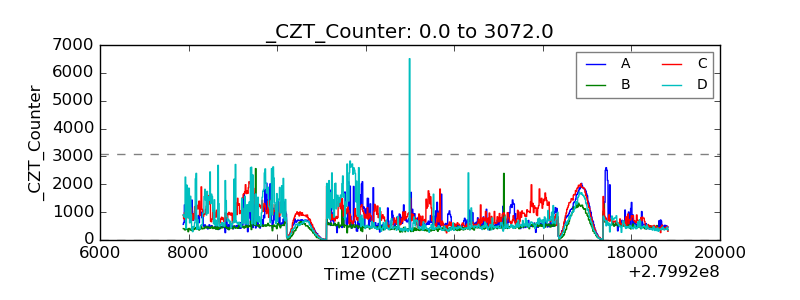 |
| +2.5 Volts monitor |  |
| +5 Volts monitor |  |
| _ROLL_ROT | 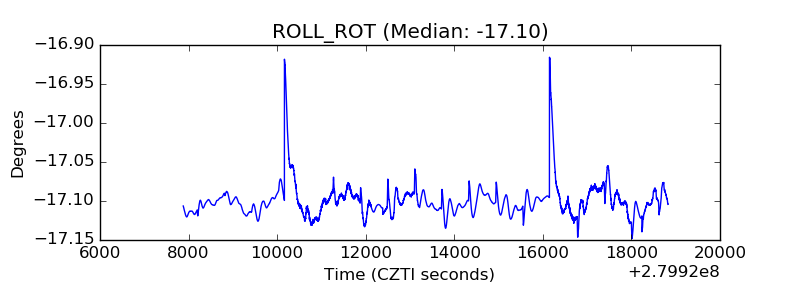 |
| _Roll_DEC | 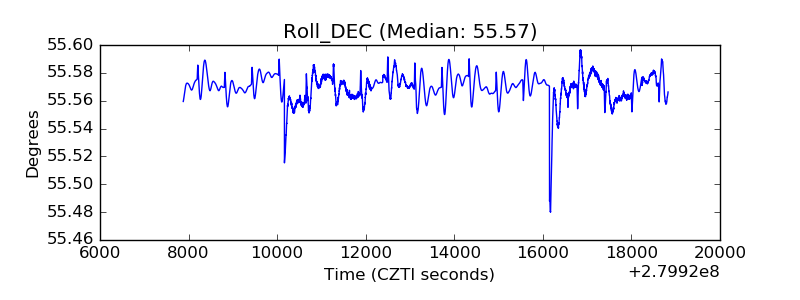 |
| _Roll_RA | 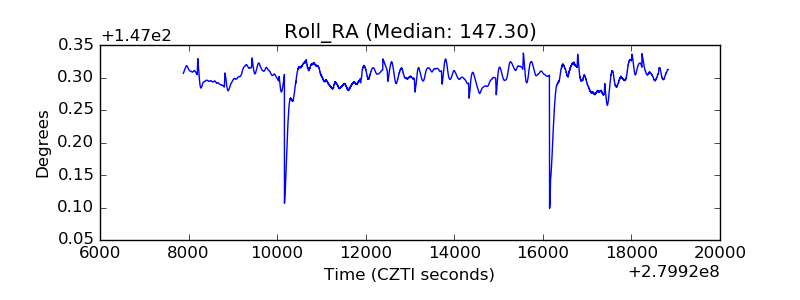 |
| Veto Counter | 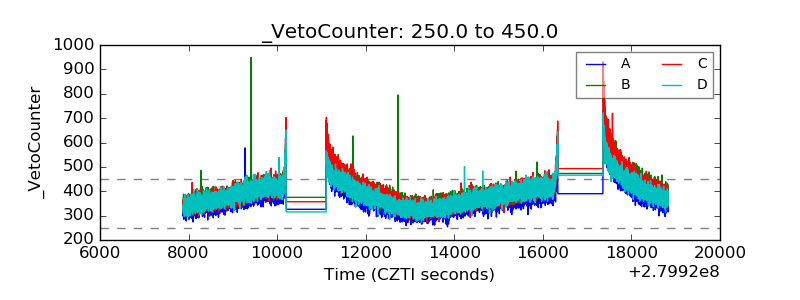 |