| Param | Original file | Final file |
|---|---|---|
| Filename | modeM0/AS1T03_013T01_9000002514_16932cztM0_level2.evt | modeM0/AS1T03_013T01_9000002514_16932cztM0_level2_quad_clean.evt |
| Size (bytes) | 549,342,720 | 104,780,160 |
| Size | 523.9 MB | 99.9 MB |
| Events in quadrant A | 4,381,471 | 684,919 |
| Events in quadrant B | 3,107,581 | 711,868 |
| Events in quadrant C | 4,045,858 | 672,066 |
| Events in quadrant D | 4,659,233 | 648,609 |
| Mode M0 | |||
|---|---|---|---|
| Quadrant | BADHDUFLAG | Total packets | Discarded packets |
| A | 0 | 17351 | 2 |
| B | 0 | 13580 | 2 |
| C | 0 | 16512 | 2 |
| D | 0 | 18600 | 2 |
| Mode M9 | |||
|---|---|---|---|
| Quadrant | BADHDUFLAG | Total packets | Discarded packets |
| A | 0 | 15 | 0 |
| B | 0 | 16 | 0 |
| C | 0 | 16 | 0 |
| D | 0 | 16 | 0 |
| Mode SS | |||
|---|---|---|---|
| Quadrant | BADHDUFLAG | Total packets | Discarded packets |
| A | 0 | 132 | 0 |
| B | 0 | 132 | 0 |
| C | 0 | 132 | 0 |
| D | 0 | 132 | 0 |
| Quadrant | Total seconds | Saturated seconds | Saturation percentage |
|---|---|---|---|
| A | 6538 | 207 | 3.166106% |
| B | 6538 | 23 | 0.351790% |
| C | 6538 | 78 | 1.193025% |
| D | 6538 | 208 | 3.181401% |
Noise dominated data is calculated using 1-second bins in cleaned event files. If a bin has >2000 counts, and if more than 50% of those come from <1% of pixels, then it is considered to be noise-dominated and hence unusable.
| Quadrant | # 1 sec bins | Bins with >0 counts | Bins with >2000 counts | High rate bins dominated by noise | Noise dominated (total time) | Noise dominated (detector-on time) | Marked lightcurve |
|---|---|---|---|---|---|---|---|
| A | 7694 | 6540 | 143 | 143 | 1.86% | 2.19% | 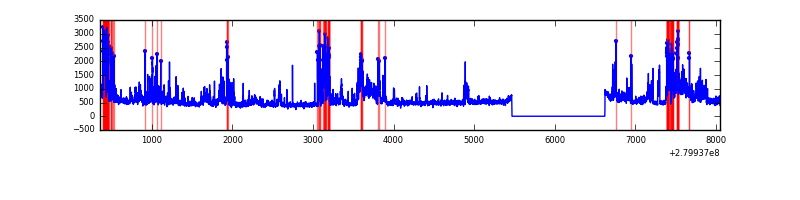 |
| B | 7694 | 6540 | 0 | 0 | 0.00% | 0.00% | 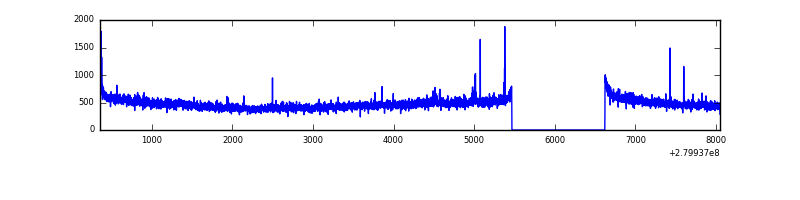 |
| C | 7694 | 6540 | 2 | 2 | 0.03% | 0.03% | 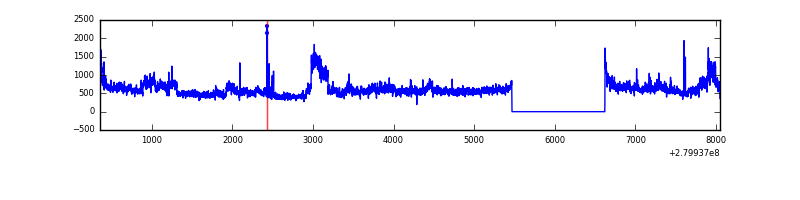 |
| D | 7694 | 6540 | 141 | 141 | 1.83% | 2.16% | 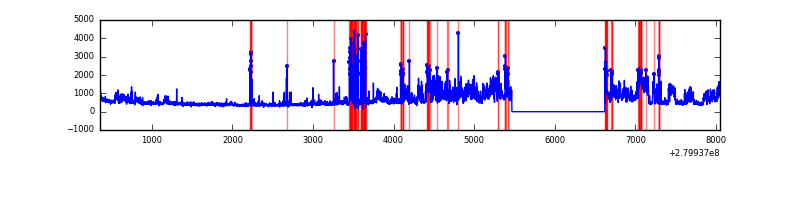 |
Top three noisy pixels from each quadrant. If the there are fewer than three noisy pixels in the level2.evt file, extra rows are filled as -1
| Pixel properties | Quadrant properties | ||||||
|---|---|---|---|---|---|---|---|
| Quadrant | DetID | PixID | Counts | Sigma | Mean | Median | Sigma |
| A | 15 | 174 | 1398851 | 8940.89 | 771 | 755 | 156.4 |
| A | 0 | 8 | 10148 | 60.07 | 771 | 755 | 156.4 |
| A | 0 | 23 | 8611 | 50.24 | 771 | 755 | 156.4 |
| B | 15 | 35 | 22765 | 150.42 | 780 | 762 | 146.3 |
| B | 12 | 111 | 17435 | 113.98 | 780 | 762 | 146.3 |
| B | 11 | 111 | 14950 | 96.99 | 780 | 762 | 146.3 |
| C | 3 | 233 | 996278 | 5817.01 | 742 | 747 | 171.1 |
| C | 14 | 238 | 116569 | 676.76 | 742 | 747 | 171.1 |
| C | 14 | 225 | 37173 | 212.84 | 742 | 747 | 171.1 |
| D | 1 | 52 | 1822401 | 10220.66 | 734 | 710 | 178.2 |
| D | 2 | 152 | 27331 | 149.36 | 734 | 710 | 178.2 |
| D | 2 | 234 | 25027 | 136.43 | 734 | 710 | 178.2 |
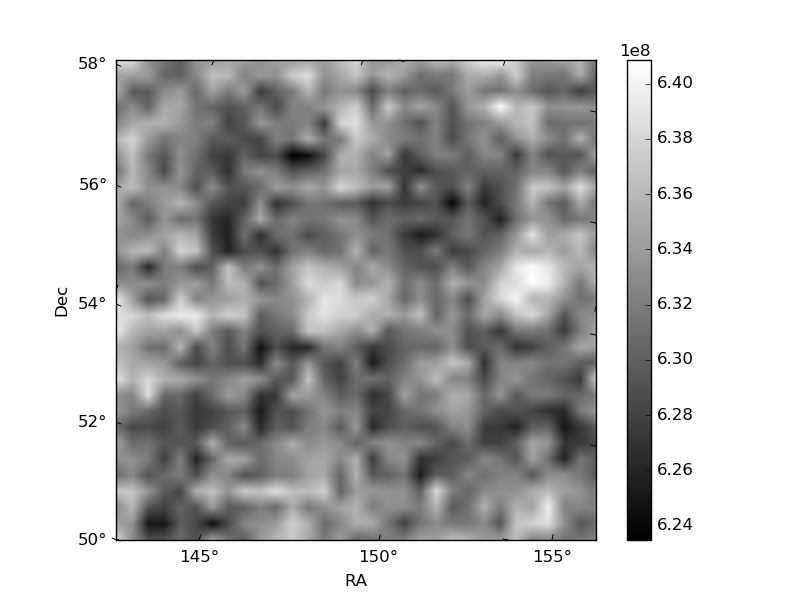
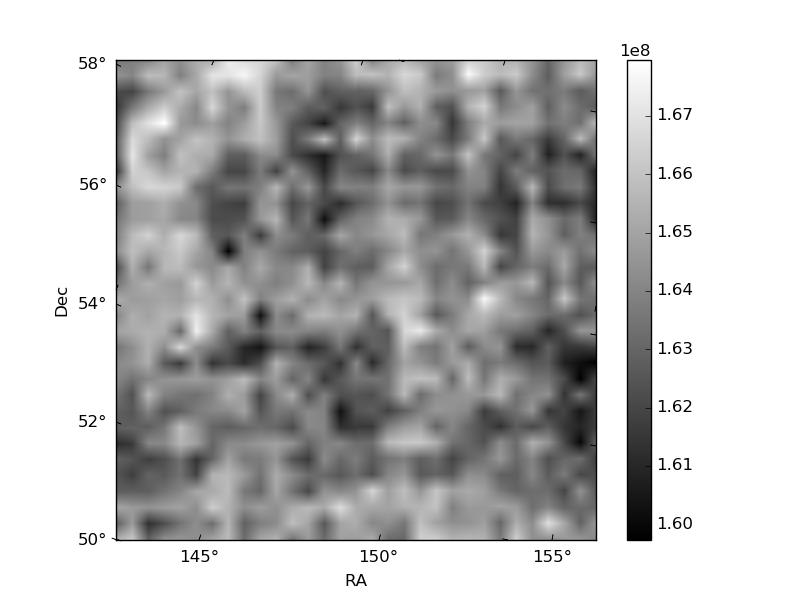
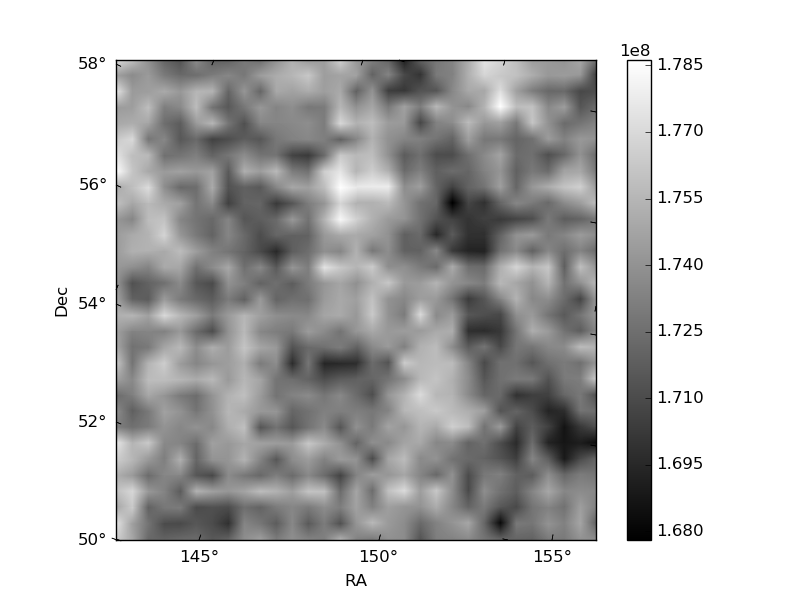
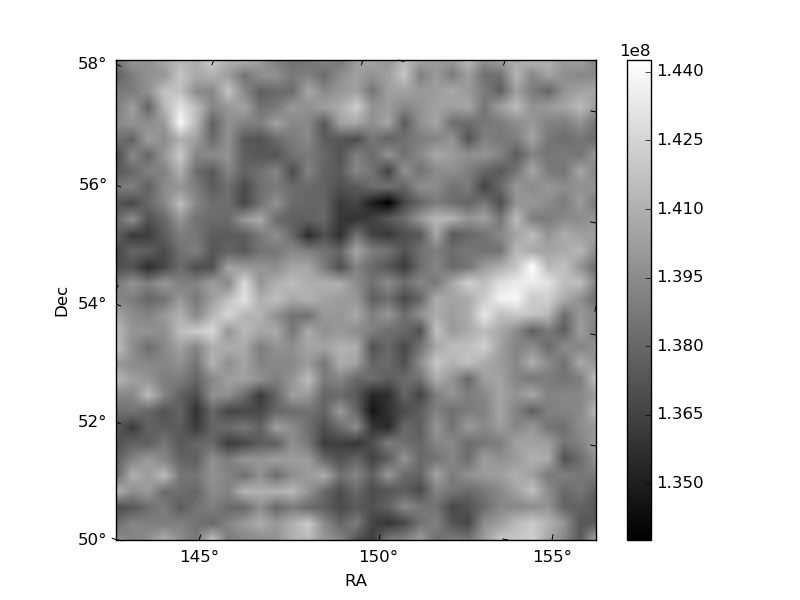
Histogram calculated using DETX and DETY for each event in the final _common_clean file
| Quadrant A | 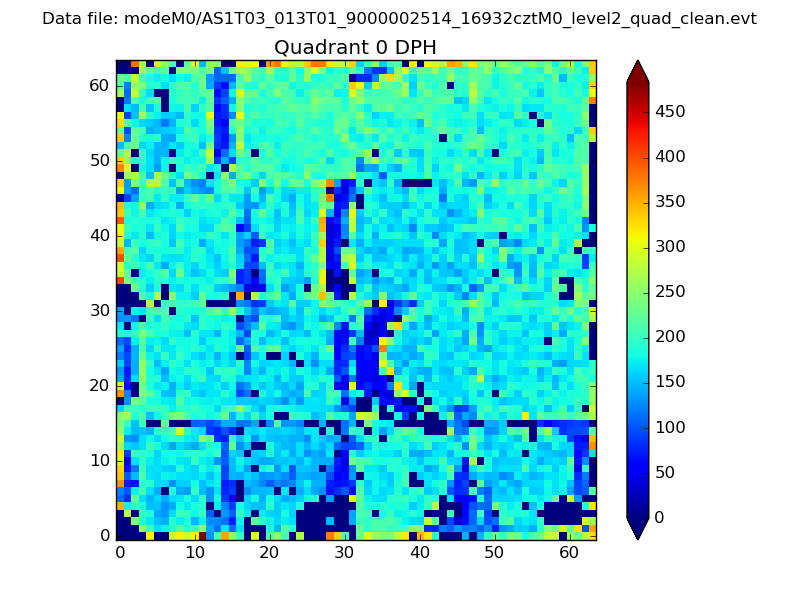 |
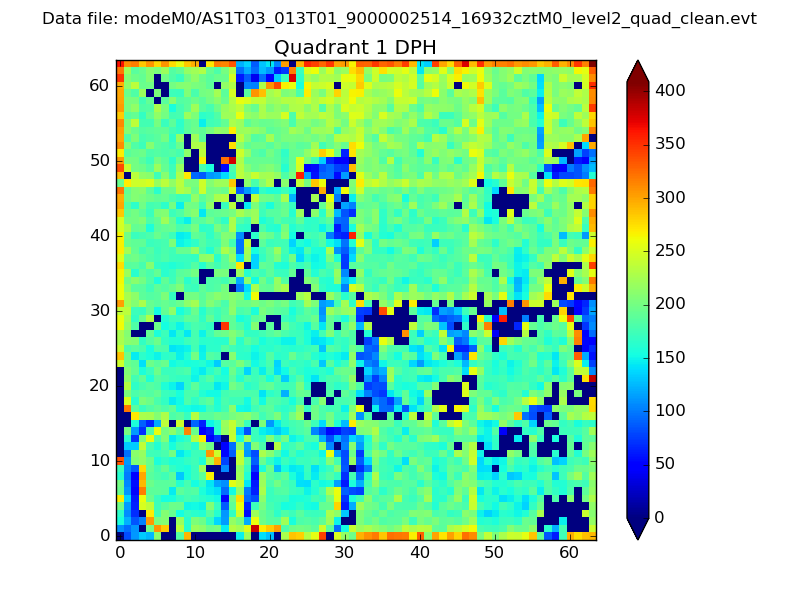 |
Quadrant B |
|---|---|---|---|
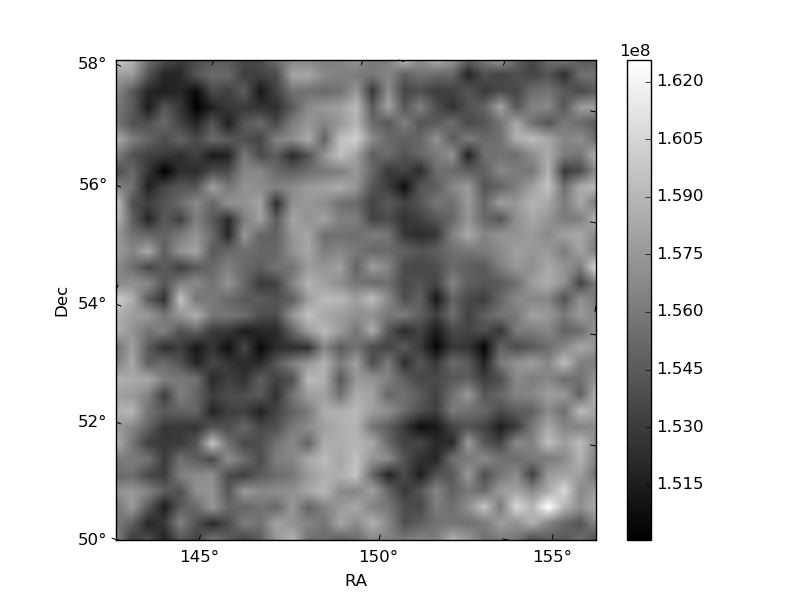
| Quadrant D | 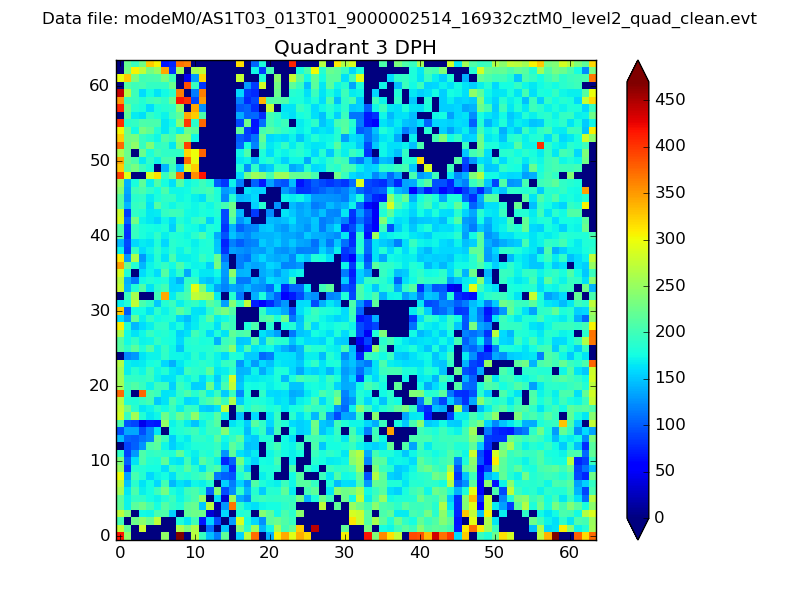 |
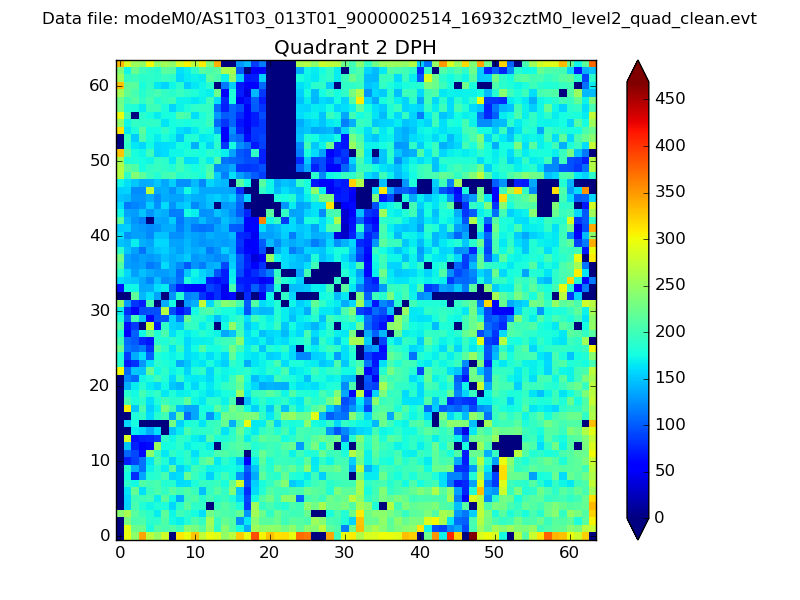 |
Quadrant C |
| Plot type | Count rate plots | Images |
|---|---|---|
| Comparison with Poisson distribution Blue bars denote a histogram of data divided into 1 sec bins. Red curve is a Poisson curve with rate = median count rate of data. |
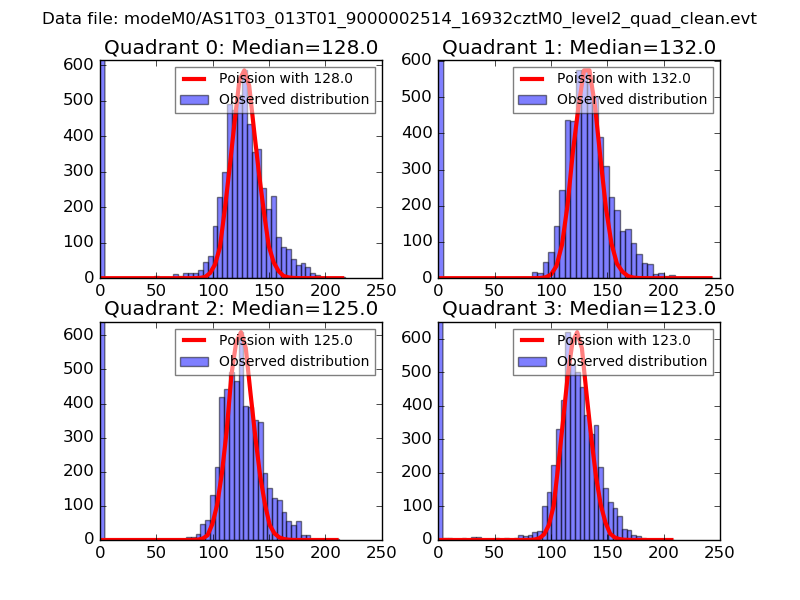 |
 |
| Quadrant-wise count rates Data is divided into 100 sec bins |
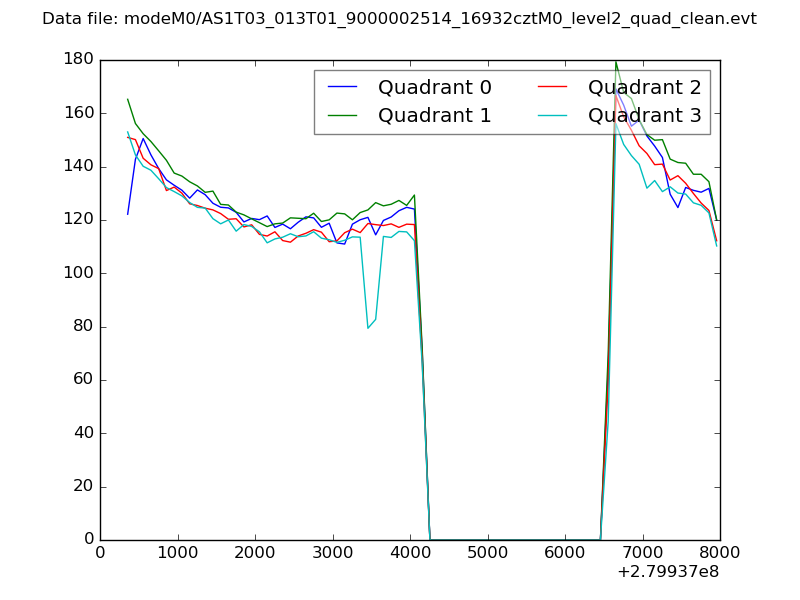 |
|
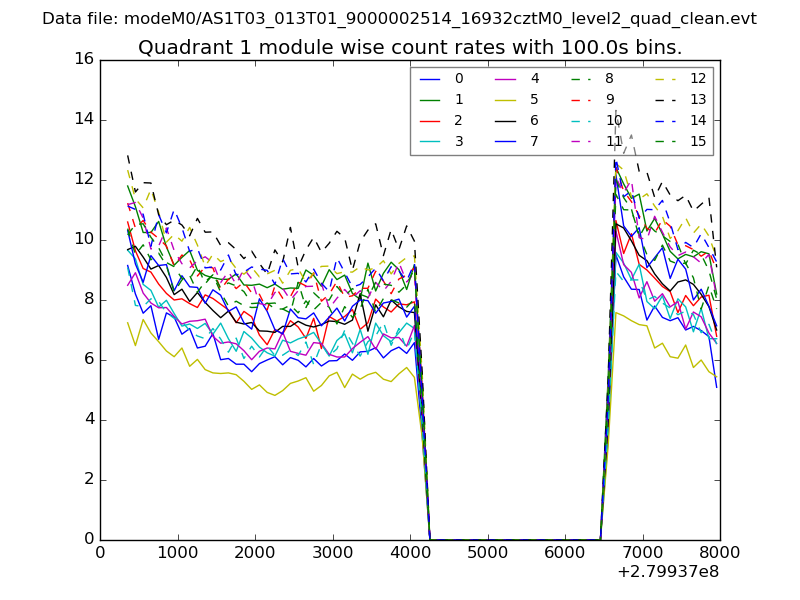
| Module-wise count rates for Quadrant A Data is divided into 100 sec bins |
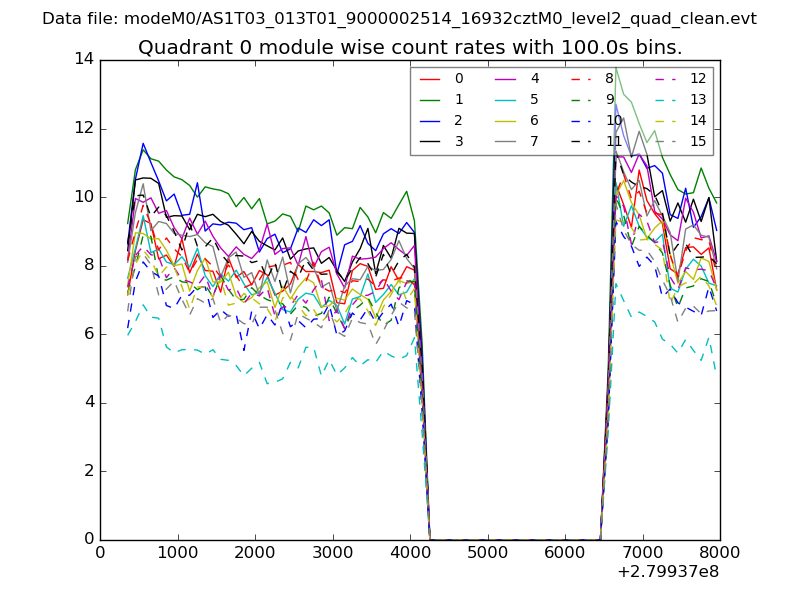 |
 |
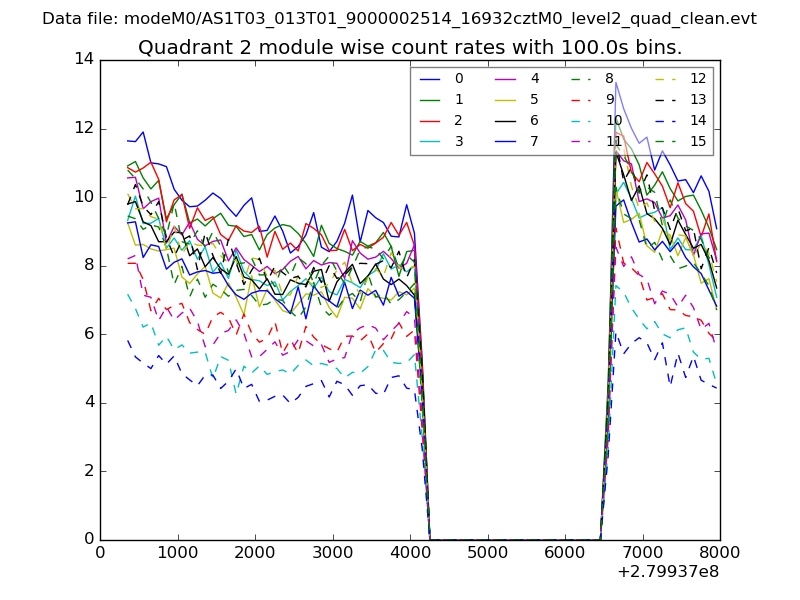
| Module-wise count rates for Quadrant B Data is divided into 100 sec bins |
 |
 |
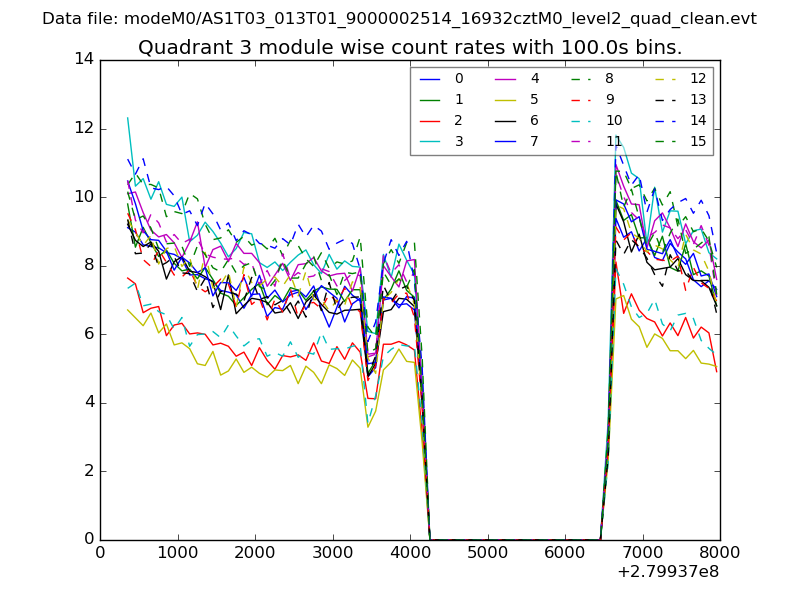
| Module-wise count rates for Quadrant C Data is divided into 100 sec bins |
 |
 |
| Module-wise count rates for Quadrant D Data is divided into 100 sec bins |
 |
 |
| Parameter | Plot |
|---|---|
| CZT HV Monitor | 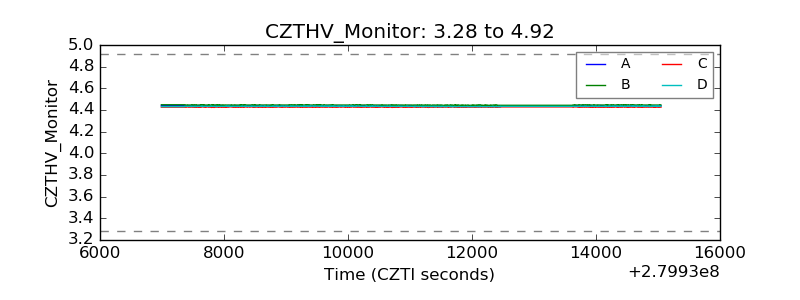 |
| D_VDD | 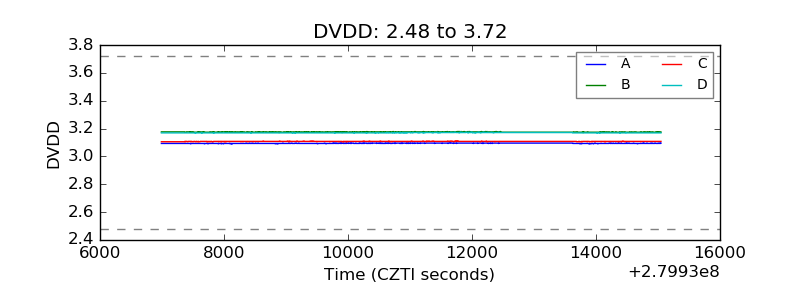 |
| Temperature 1 | 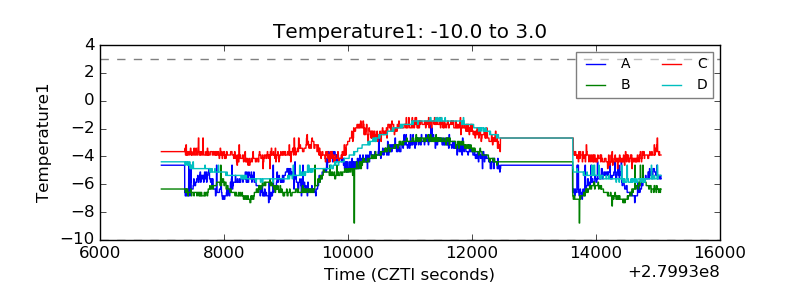 |
| Veto HV Monitor | 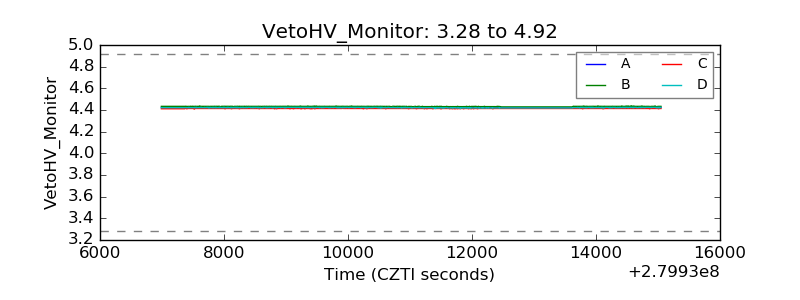 |
| Veto LLD | 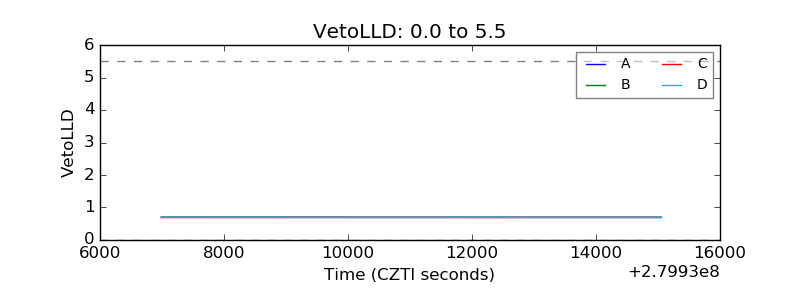 |
| Alpha Counter | 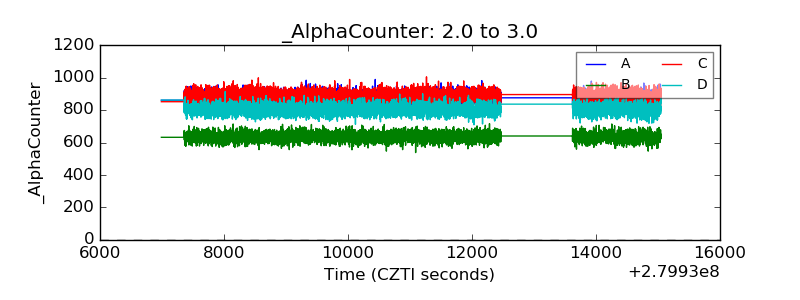 |
| _CPM_Rate |  |
| CZT Counter | 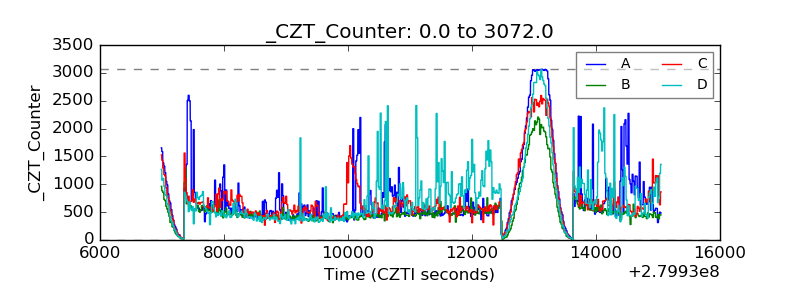 |
| +2.5 Volts monitor | 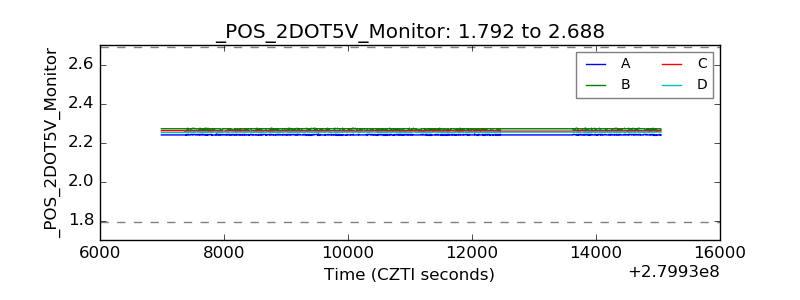 |
| +5 Volts monitor | 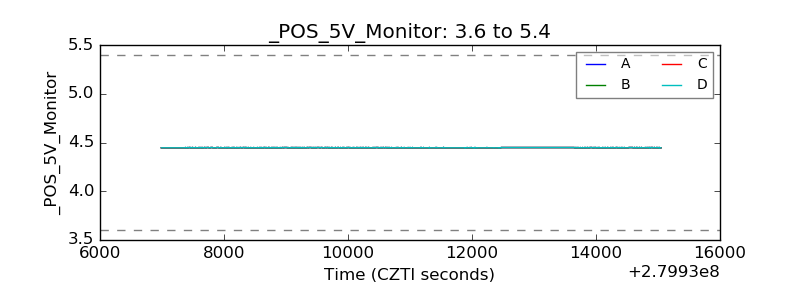 |
| _ROLL_ROT | 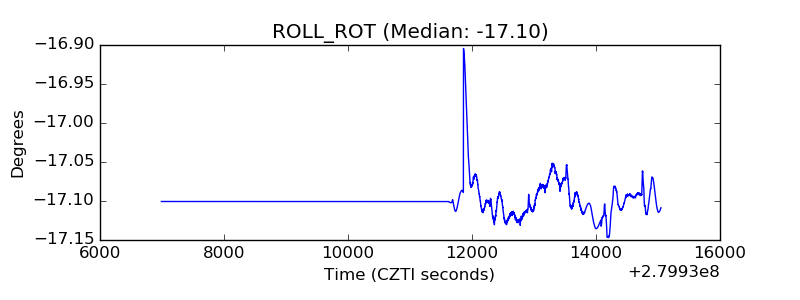 |
| _Roll_DEC | 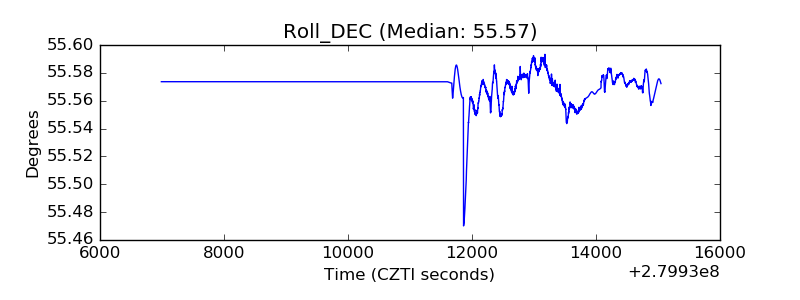 |
| _Roll_RA | 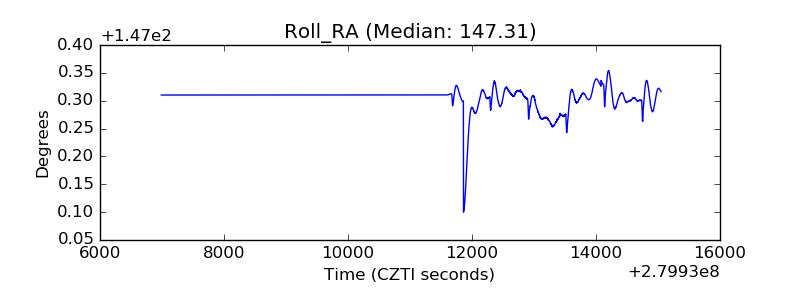 |
| Veto Counter | 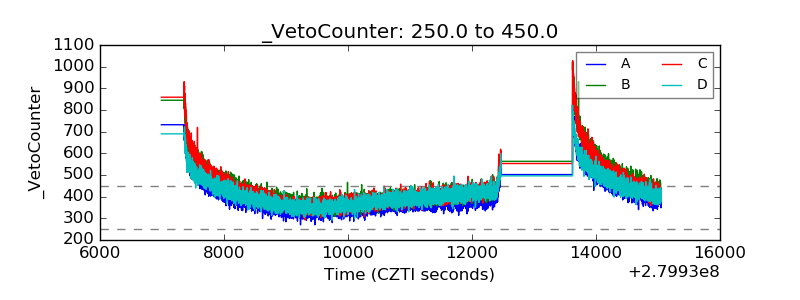 |