| Param | Original file | Final file |
|---|---|---|
| Filename | modeM0/AS1T03_013T01_9000002514_16934cztM0_level2.evt | modeM0/AS1T03_013T01_9000002514_16934cztM0_level2_quad_clean.evt |
| Size (bytes) | 619,381,440 | 94,086,720 |
| Size | 590.7 MB | 89.7 MB |
| Events in quadrant A | 4,847,639 | 628,841 |
| Events in quadrant B | 3,366,017 | 641,965 |
| Events in quadrant C | 3,822,732 | 600,237 |
| Events in quadrant D | 6,285,397 | 528,434 |
| Mode M0 | |||
|---|---|---|---|
| Quadrant | BADHDUFLAG | Total packets | Discarded packets |
| A | 0 | 37084 | 18446 |
| B | 0 | 27716 | 13763 |
| C | 0 | 31417 | 15612 |
| D | 0 | 45941 | 22873 |
| Mode M9 | |||
|---|---|---|---|
| Quadrant | BADHDUFLAG | Total packets | Discarded packets |
| A | 0 | 31 | 16 |
| B | 0 | 32 | 16 |
| C | 0 | 32 | 16 |
| D | 0 | 32 | 16 |
| Mode SS | |||
|---|---|---|---|
| Quadrant | BADHDUFLAG | Total packets | Discarded packets |
| A | 0 | 258 | 128 |
| B | 0 | 258 | 128 |
| C | 0 | 258 | 128 |
| D | 0 | 258 | 128 |
| Quadrant | Total seconds | Saturated seconds | Saturation percentage |
|---|---|---|---|
| A | 6445 | 666 | 10.333592% |
| B | 6444 | 124 | 1.924271% |
| C | 6444 | 89 | 1.381130% |
| D | 6444 | 963 | 14.944134% |
Noise dominated data is calculated using 1-second bins in cleaned event files. If a bin has >2000 counts, and if more than 50% of those come from <1% of pixels, then it is considered to be noise-dominated and hence unusable.
| Quadrant | # 1 sec bins | Bins with >0 counts | Bins with >2000 counts | High rate bins dominated by noise | Noise dominated (total time) | Noise dominated (detector-on time) | Marked lightcurve |
|---|---|---|---|---|---|---|---|
| A | 7726 | 6447 | 457 | 457 | 5.92% | 7.09% | 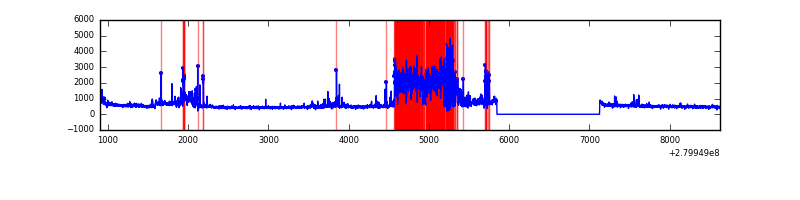 |
| B | 7725 | 6446 | 44 | 44 | 0.57% | 0.68% | 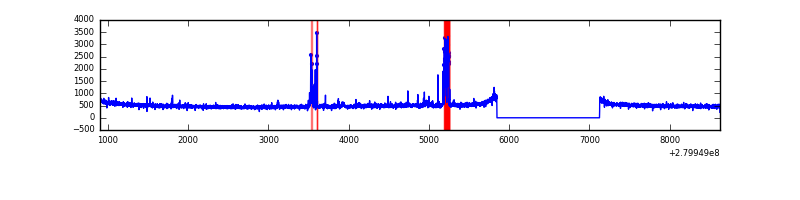 |
| C | 7725 | 6446 | 0 | 0 | 0.00% | 0.00% | 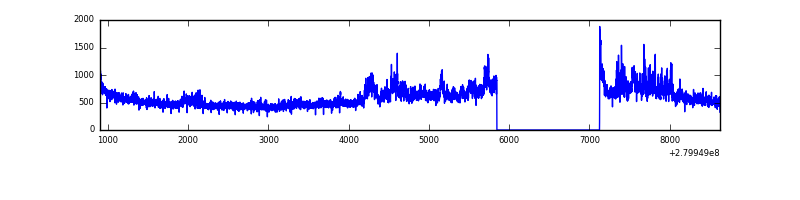 |
| D | 7725 | 6446 | 712 | 712 | 9.22% | 11.05% | 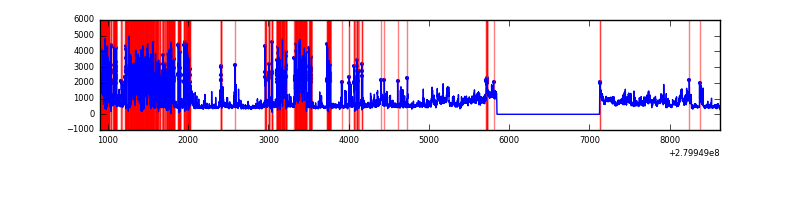 |
Top three noisy pixels from each quadrant. If the there are fewer than three noisy pixels in the level2.evt file, extra rows are filled as -1
| Pixel properties | Quadrant properties | ||||||
|---|---|---|---|---|---|---|---|
| Quadrant | DetID | PixID | Counts | Sigma | Mean | Median | Sigma |
| A | 15 | 174 | 1800530 | 11626.64 | 784 | 770 | 154.8 |
| A | 0 | 23 | 30278 | 190.62 | 784 | 770 | 154.8 |
| A | 0 | 226 | 8812 | 51.95 | 784 | 770 | 154.8 |
| B | 15 | 35 | 192724 | 1290.4 | 803 | 785 | 148.7 |
| B | 12 | 111 | 17452 | 112.05 | 803 | 785 | 148.7 |
| B | 11 | 111 | 14933 | 95.12 | 803 | 785 | 148.7 |
| C | 3 | 233 | 731373 | 4207.08 | 760 | 766 | 173.7 |
| C | 14 | 238 | 119855 | 685.75 | 760 | 766 | 173.7 |
| C | 5 | 112 | 6329 | 32.03 | 760 | 766 | 173.7 |
| D | 1 | 52 | 3520476 | 20627.02 | 712 | 692 | 170.6 |
| D | 2 | 152 | 47932 | 276.84 | 712 | 692 | 170.6 |
| D | 2 | 234 | 24744 | 140.95 | 712 | 692 | 170.6 |
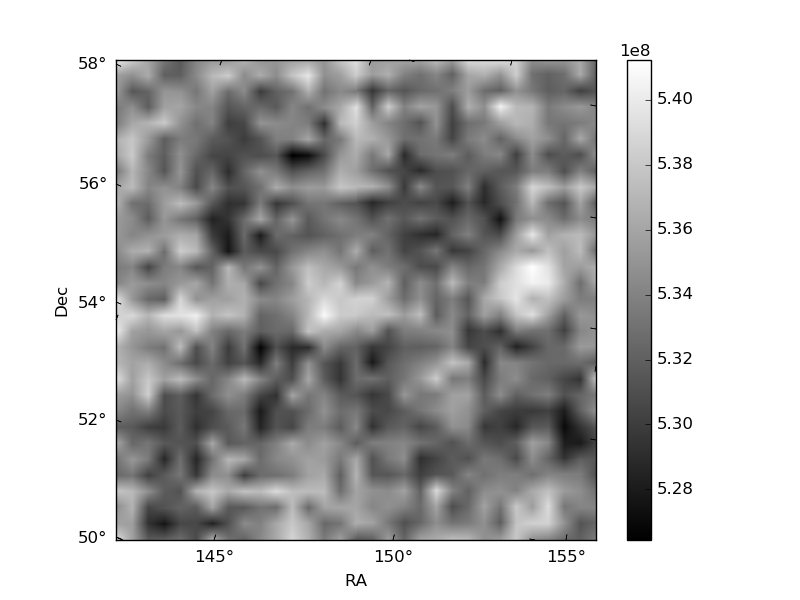
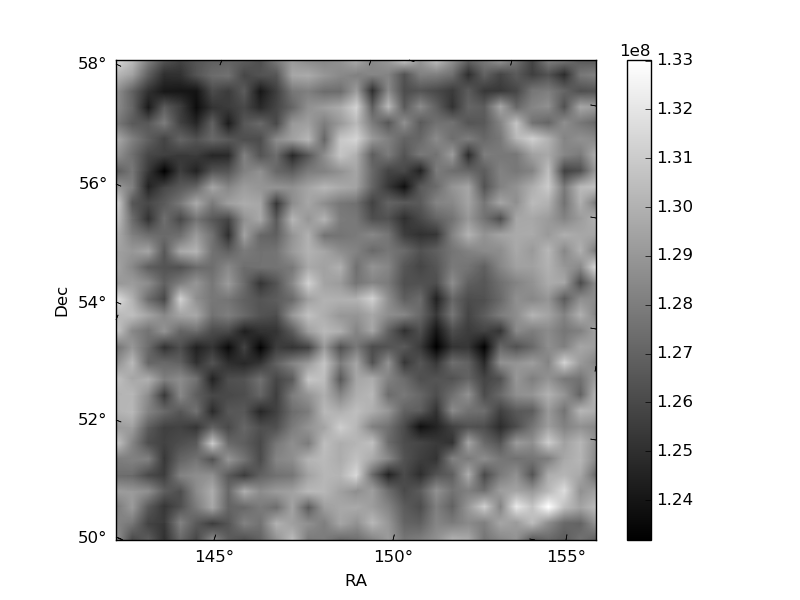
Histogram calculated using DETX and DETY for each event in the final _common_clean file
| Quadrant A | 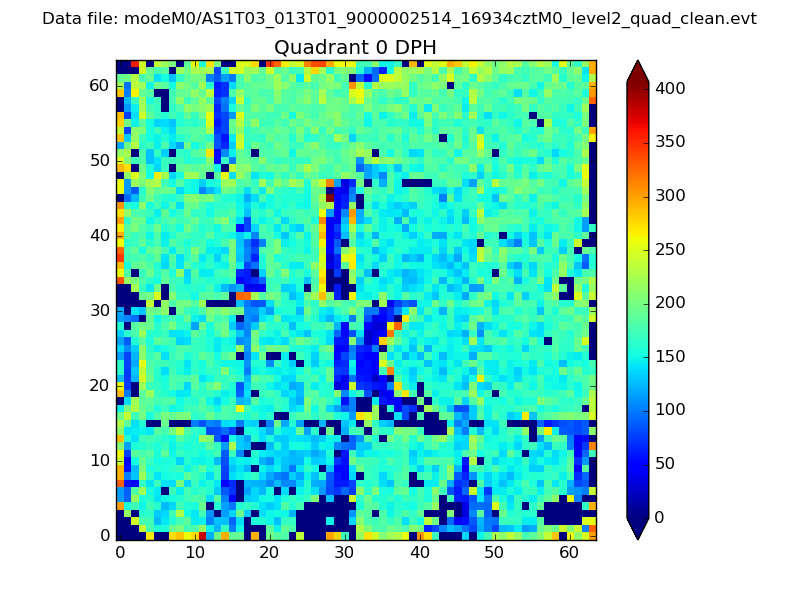 |
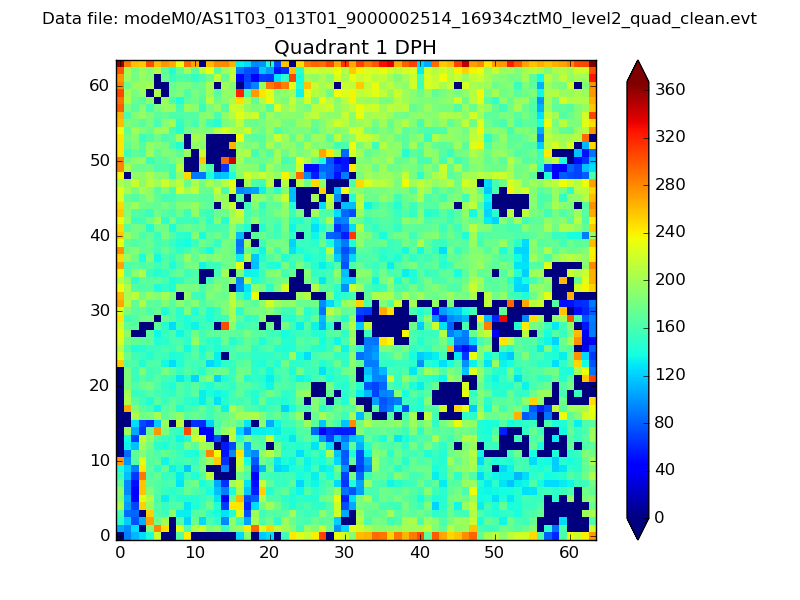 |
Quadrant B |
|---|---|---|---|
| Quadrant D |  |
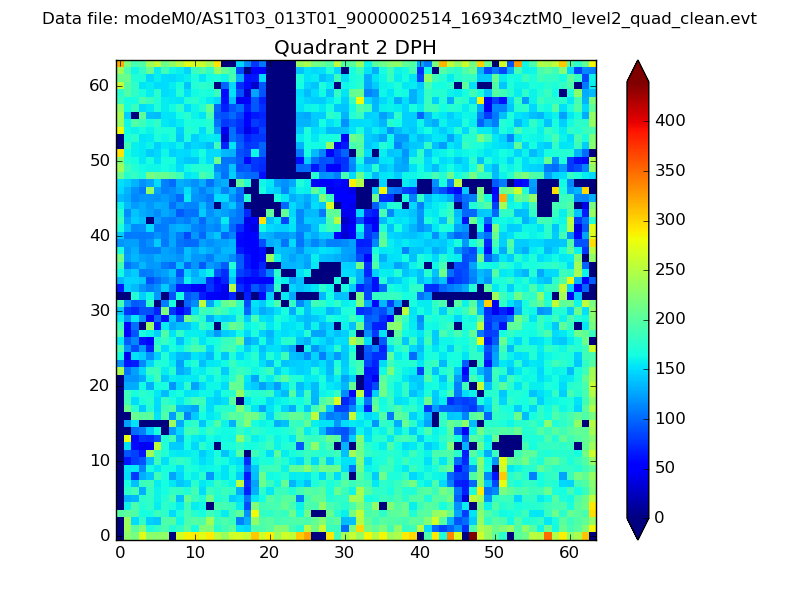 |
Quadrant C |
| Plot type | Count rate plots | Images |
|---|---|---|
| Comparison with Poisson distribution Blue bars denote a histogram of data divided into 1 sec bins. Red curve is a Poisson curve with rate = median count rate of data. |
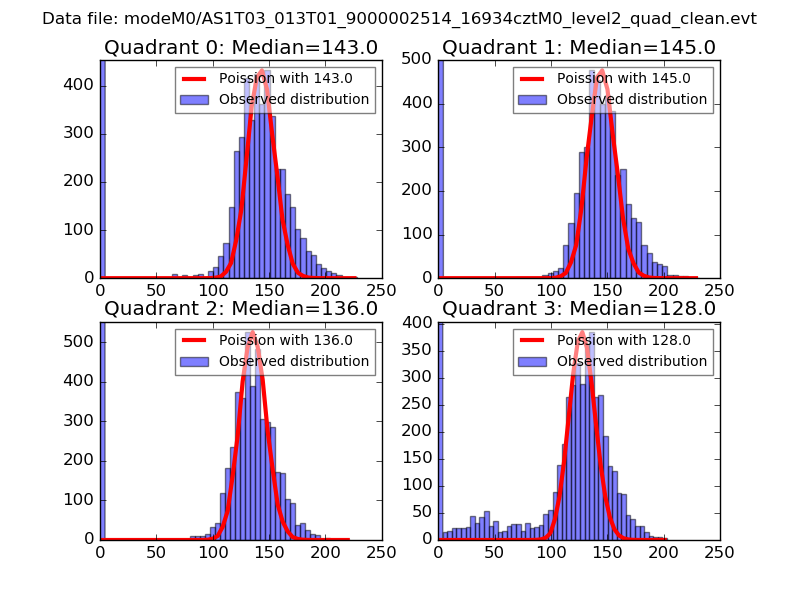 |
 |
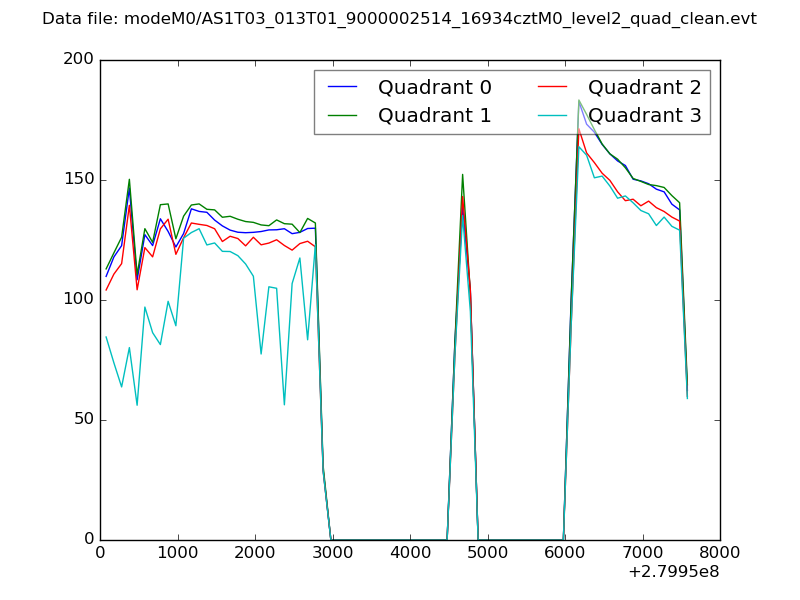
| Quadrant-wise count rates Data is divided into 100 sec bins |
 |
|
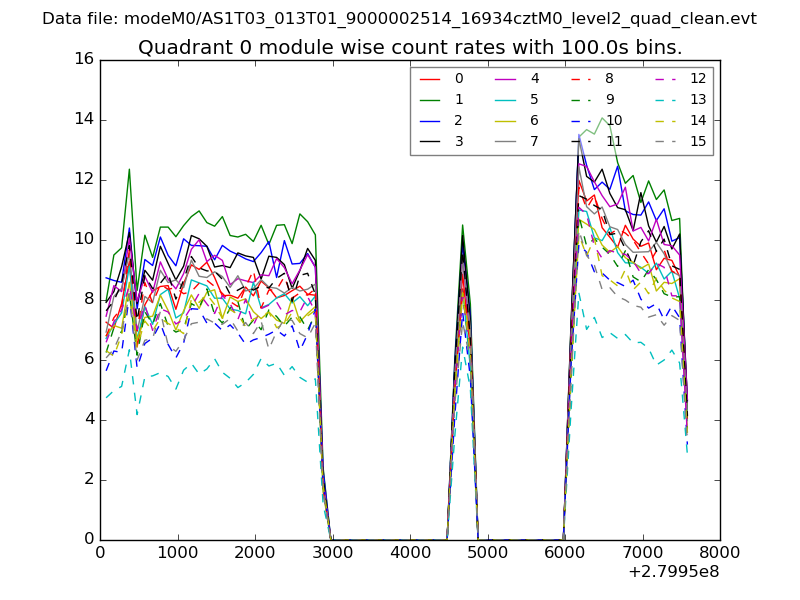
| Module-wise count rates for Quadrant A Data is divided into 100 sec bins |
 |
 |
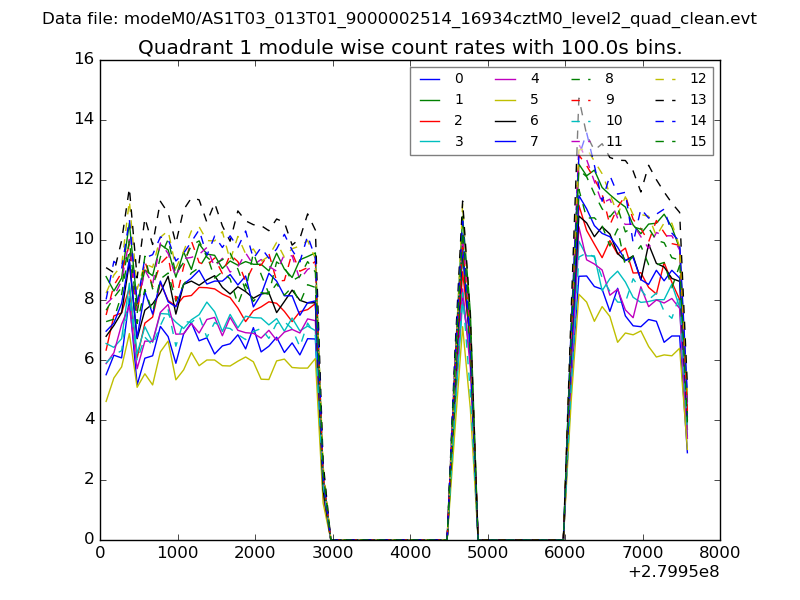
| Module-wise count rates for Quadrant B Data is divided into 100 sec bins |
 |
 |
| Module-wise count rates for Quadrant C Data is divided into 100 sec bins |
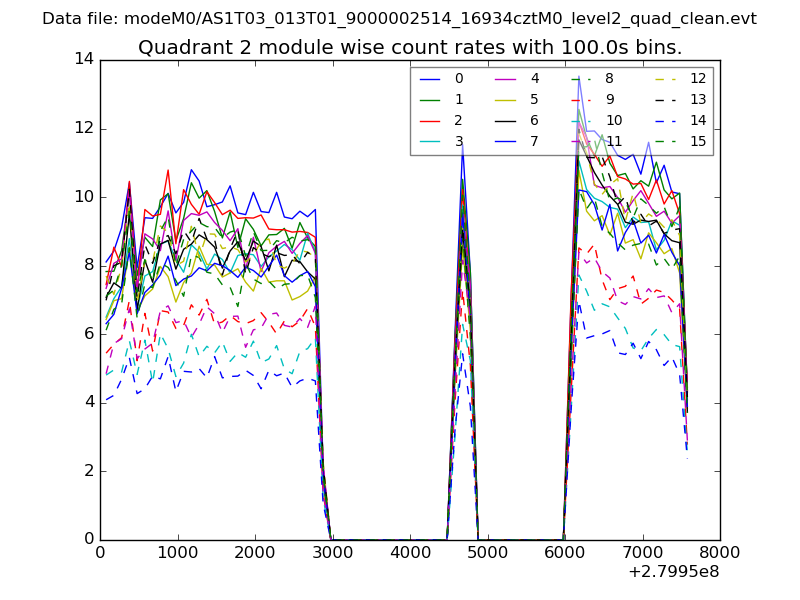 |
 |
| Module-wise count rates for Quadrant D Data is divided into 100 sec bins |
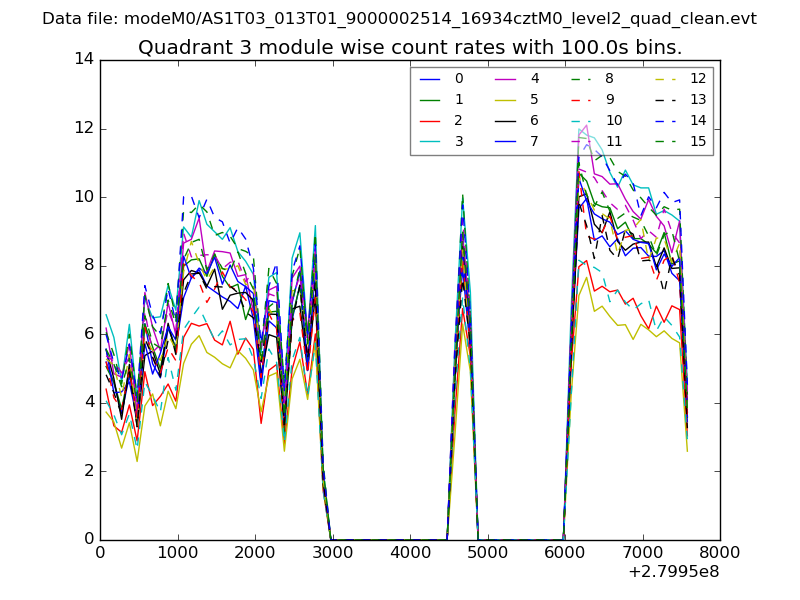 |
 |
| Parameter | Plot |
|---|---|
| CZT HV Monitor | 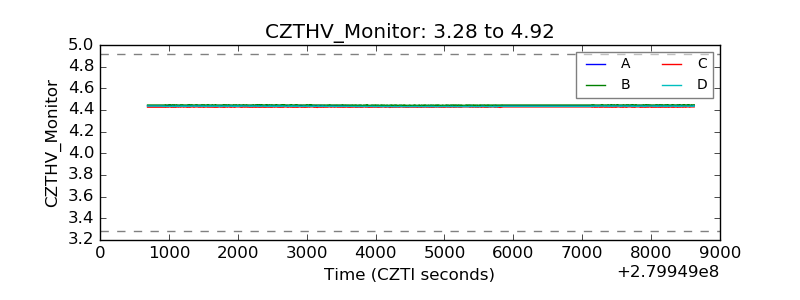 |
| D_VDD | 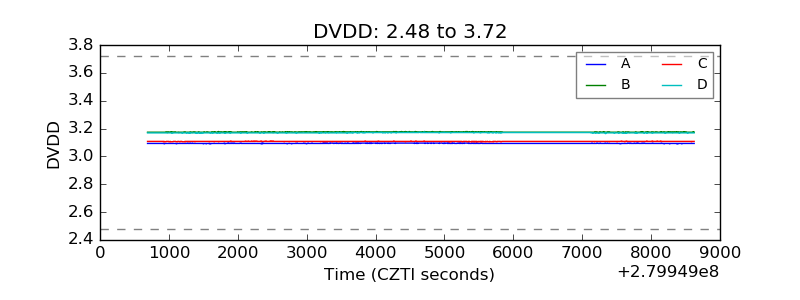 |
| Temperature 1 | 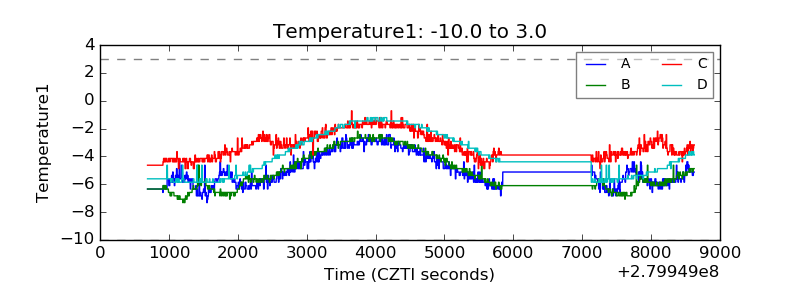 |
| Veto HV Monitor | 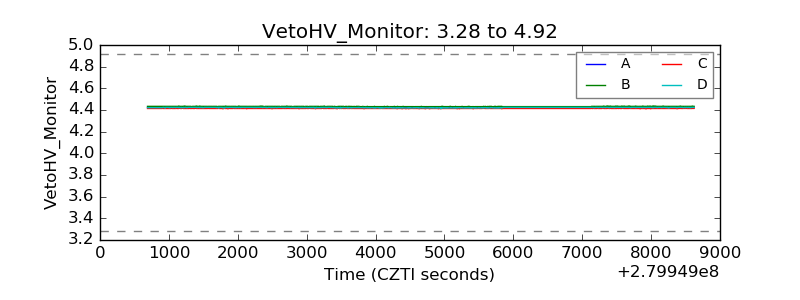 |
| Veto LLD | 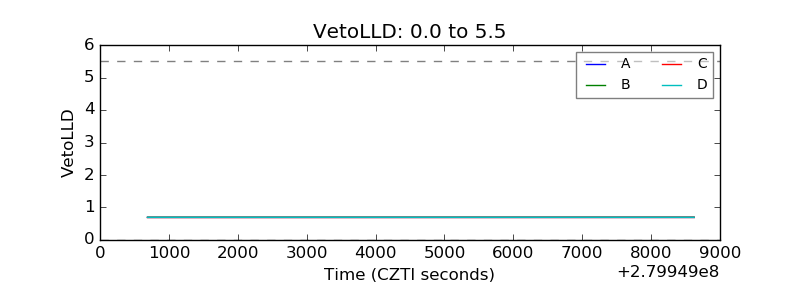 |
| Alpha Counter | 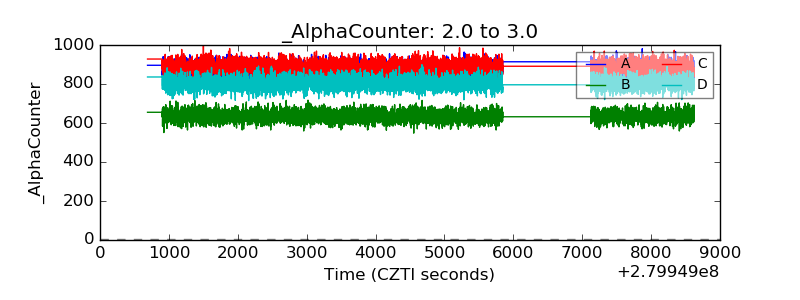 |
| _CPM_Rate | 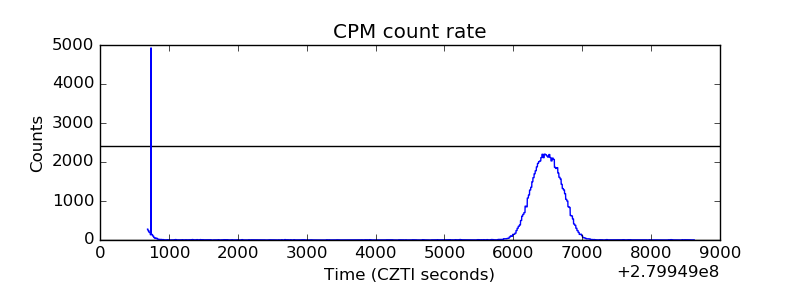 |
| CZT Counter | 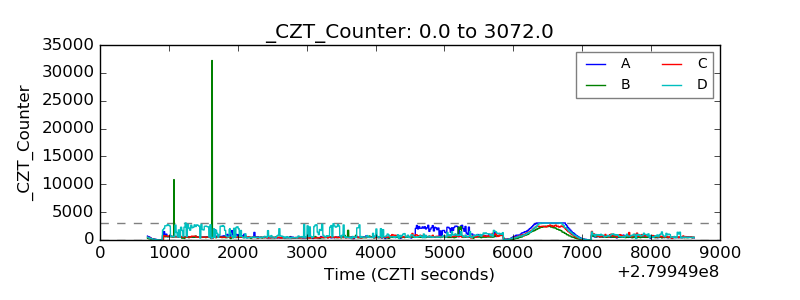 |
| +2.5 Volts monitor |  |
| +5 Volts monitor | 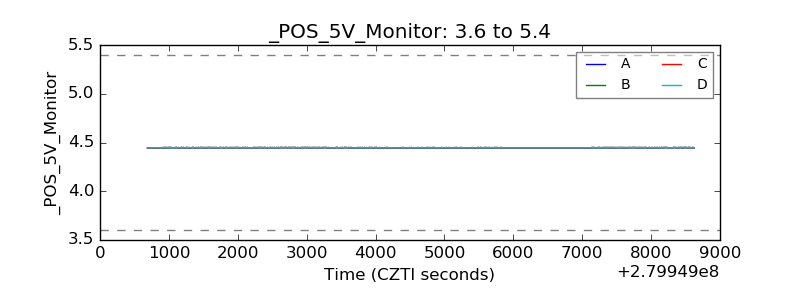 |
| _ROLL_ROT | 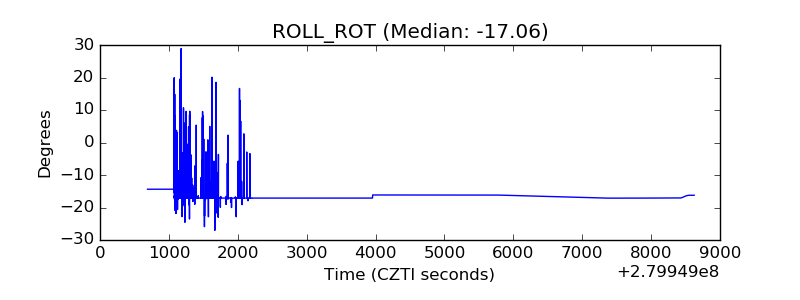 |
| _Roll_DEC | 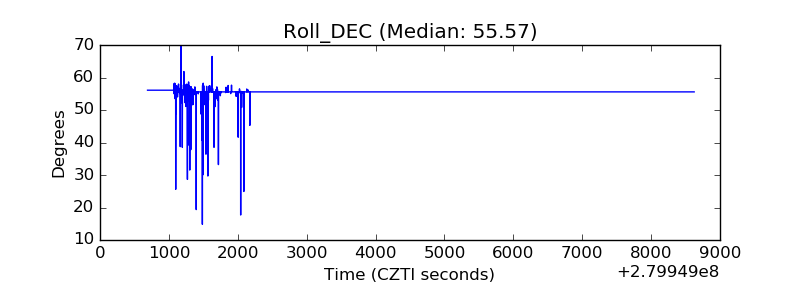 |
| _Roll_RA | 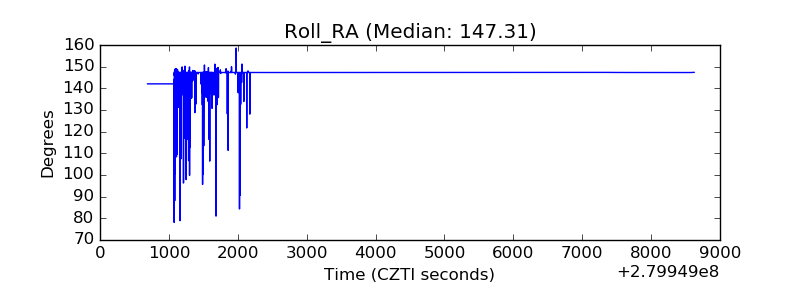 |
| Veto Counter | 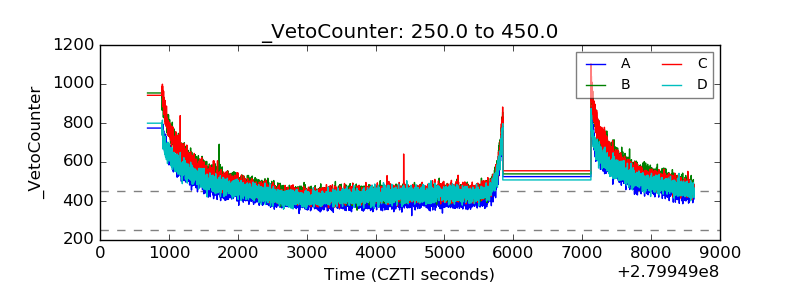 |