| Param | Original file | Final file |
|---|---|---|
| Filename | modeM0/AS1T03_013T01_9000002514_16936cztM0_level2.evt | modeM0/AS1T03_013T01_9000002514_16936cztM0_level2_quad_clean.evt |
| Size (bytes) | 489,741,120 | 85,726,080 |
| Size | 467.1 MB | 81.8 MB |
| Events in quadrant A | 3,448,586 | 561,331 |
| Events in quadrant B | 2,846,576 | 571,432 |
| Events in quadrant C | 2,920,197 | 539,275 |
| Events in quadrant D | 5,223,938 | 519,376 |
| Mode M0 | |||
|---|---|---|---|
| Quadrant | BADHDUFLAG | Total packets | Discarded packets |
| A | 0 | 13870 | 1 |
| B | 0 | 11986 | 1 |
| C | 0 | 12041 | 1 |
| D | 0 | 19413 | 1 |
| Mode M9 | |||
|---|---|---|---|
| Quadrant | BADHDUFLAG | Total packets | Discarded packets |
| A | 0 | 12 | 0 |
| B | 0 | 12 | 0 |
| C | 0 | 12 | 0 |
| D | 0 | 12 | 0 |
| Mode SS | |||
|---|---|---|---|
| Quadrant | BADHDUFLAG | Total packets | Discarded packets |
| A | 0 | 118 | 0 |
| B | 0 | 118 | 0 |
| C | 0 | 118 | 0 |
| D | 0 | 118 | 0 |
| Quadrant | Total seconds | Saturated seconds | Saturation percentage |
|---|---|---|---|
| A | 5787 | 150 | 2.592017% |
| B | 5787 | 58 | 1.002246% |
| C | 5787 | 56 | 0.967686% |
| D | 5787 | 307 | 5.304994% |
Noise dominated data is calculated using 1-second bins in cleaned event files. If a bin has >2000 counts, and if more than 50% of those come from <1% of pixels, then it is considered to be noise-dominated and hence unusable.
| Quadrant | # 1 sec bins | Bins with >0 counts | Bins with >2000 counts | High rate bins dominated by noise | Noise dominated (total time) | Noise dominated (detector-on time) | Marked lightcurve |
|---|---|---|---|---|---|---|---|
| A | 7013 | 5789 | 65 | 65 | 0.93% | 1.12% | 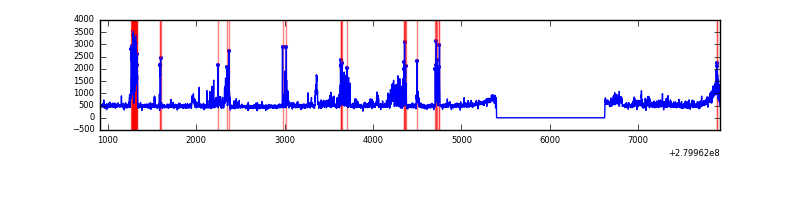 |
| B | 7013 | 5789 | 0 | 0 | 0.00% | 0.00% | 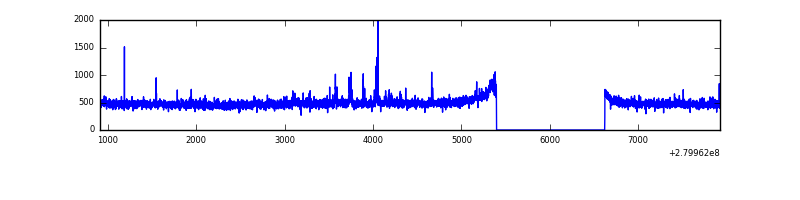 |
| C | 7013 | 5789 | 0 | 0 | 0.00% | 0.00% | 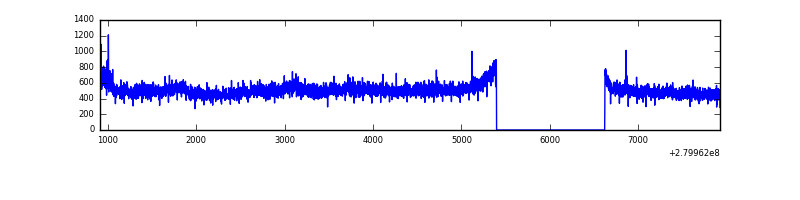 |
| D | 7013 | 5789 | 213 | 213 | 3.04% | 3.68% | 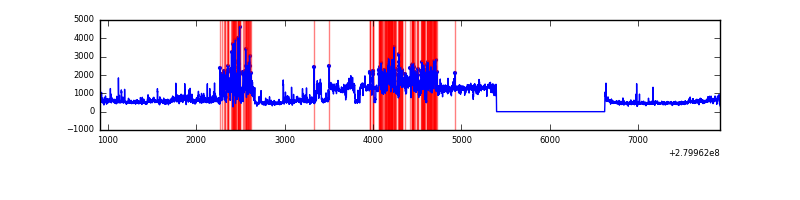 |
Top three noisy pixels from each quadrant. If the there are fewer than three noisy pixels in the level2.evt file, extra rows are filled as -1
| Pixel properties | Quadrant properties | ||||||
|---|---|---|---|---|---|---|---|
| Quadrant | DetID | PixID | Counts | Sigma | Mean | Median | Sigma |
| A | 15 | 174 | 681307 | 4738.53 | 715 | 701 | 143.6 |
| A | 0 | 23 | 18509 | 123.98 | 715 | 701 | 143.6 |
| A | 0 | 226 | 7467 | 47.11 | 715 | 701 | 143.6 |
| B | 0 | 197 | 19841 | 142.66 | 706 | 689 | 134.3 |
| B | 0 | 229 | 18665 | 133.9 | 706 | 689 | 134.3 |
| B | 3 | 209 | 18438 | 132.21 | 706 | 689 | 134.3 |
| C | 3 | 233 | 184733 | 1184.54 | 672 | 677 | 155.4 |
| C | 14 | 238 | 107073 | 684.74 | 672 | 677 | 155.4 |
| C | 13 | 61 | 4701 | 25.9 | 672 | 677 | 155.4 |
| D | 1 | 52 | 2511387 | 15319.78 | 680 | 660 | 163.9 |
| D | 2 | 152 | 92823 | 562.35 | 680 | 660 | 163.9 |
| D | 2 | 234 | 25955 | 154.34 | 680 | 660 | 163.9 |
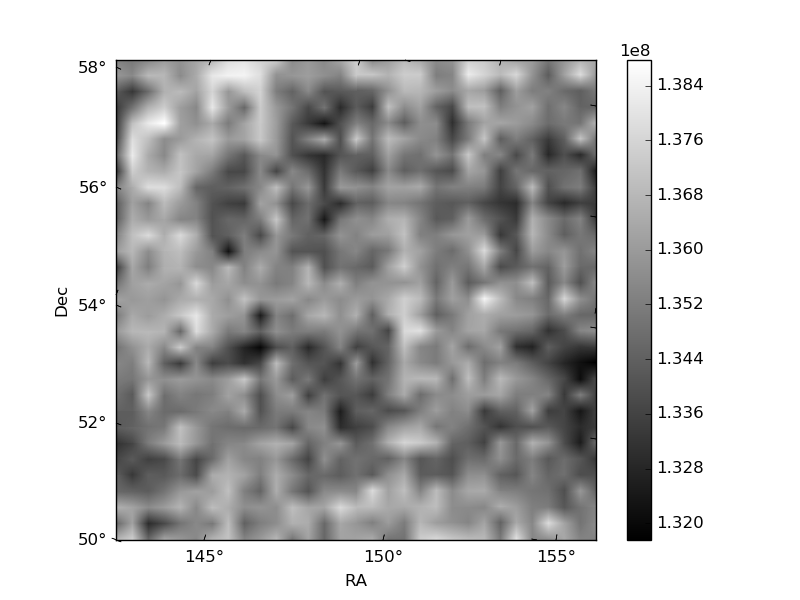
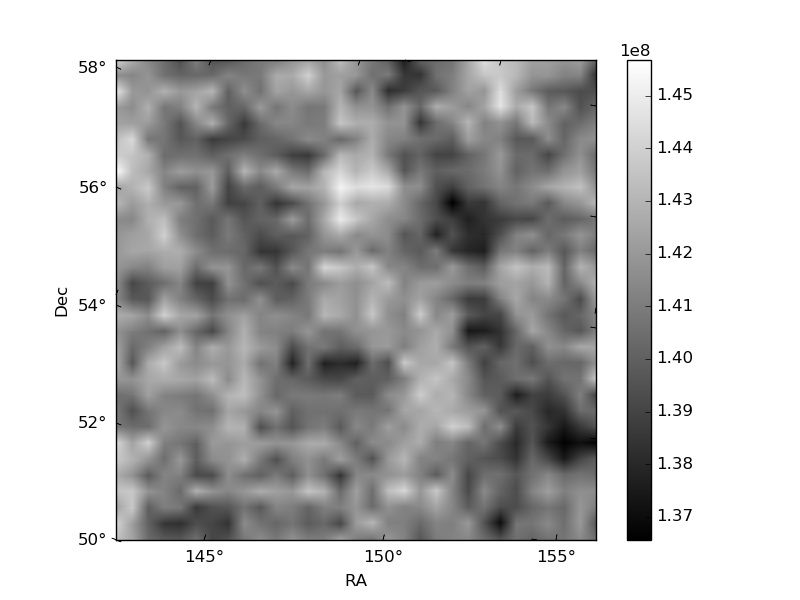
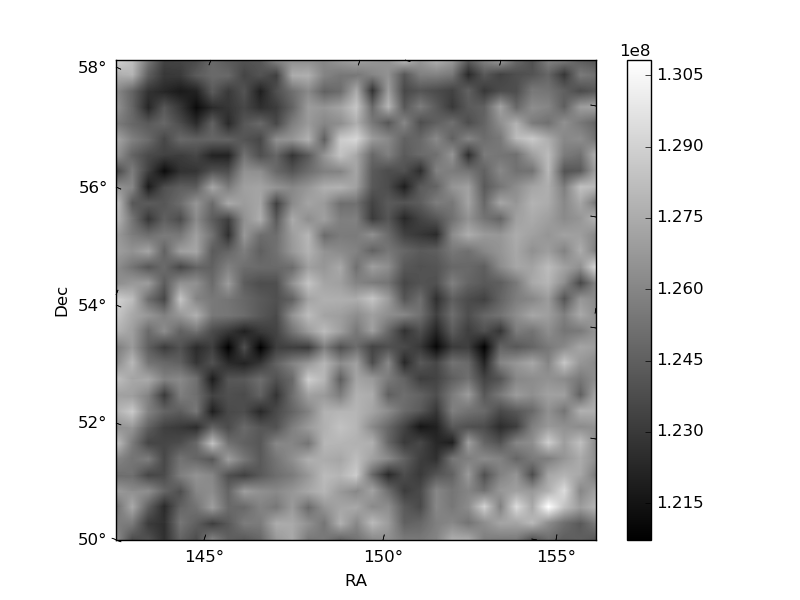
Histogram calculated using DETX and DETY for each event in the final _common_clean file
| Quadrant A | 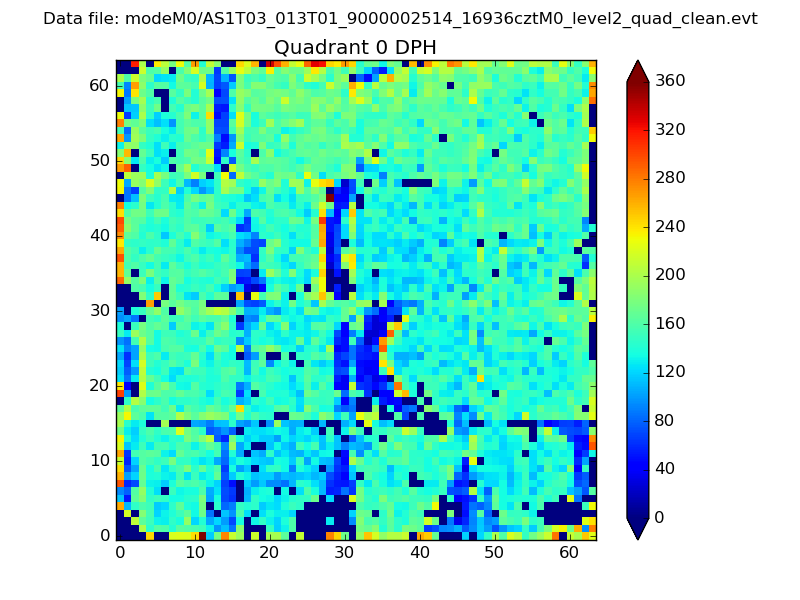 |
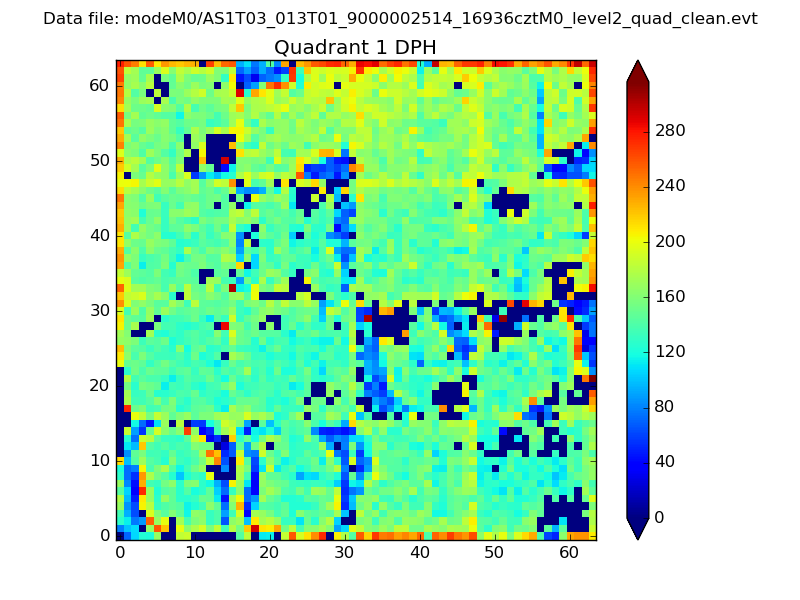 |
Quadrant B |
|---|---|---|---|
| Quadrant D | 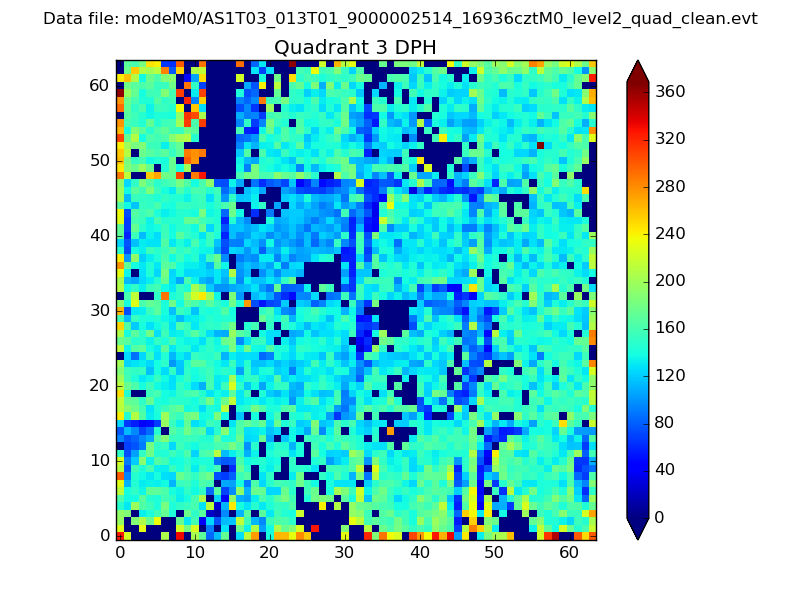 |
 |
Quadrant C |
| Plot type | Count rate plots | Images |
|---|---|---|
| Comparison with Poisson distribution Blue bars denote a histogram of data divided into 1 sec bins. Red curve is a Poisson curve with rate = median count rate of data. |
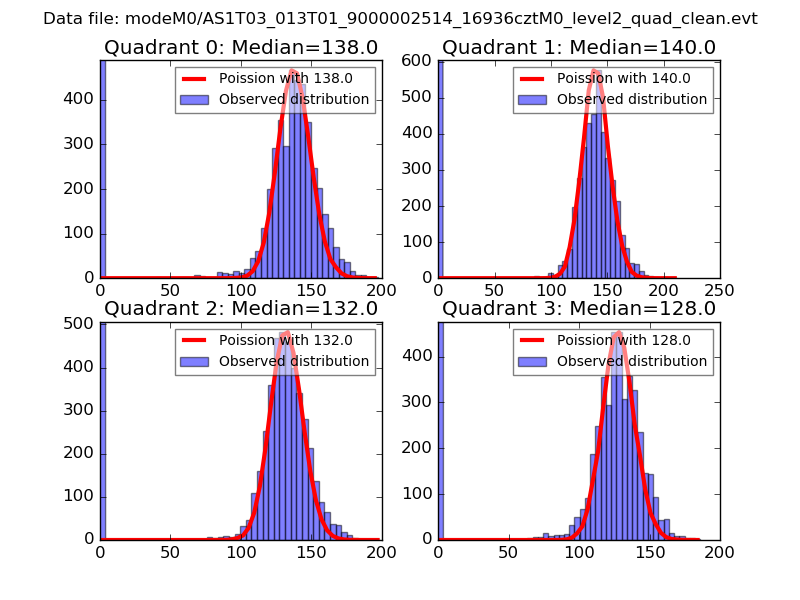 |
 |
| Quadrant-wise count rates Data is divided into 100 sec bins |
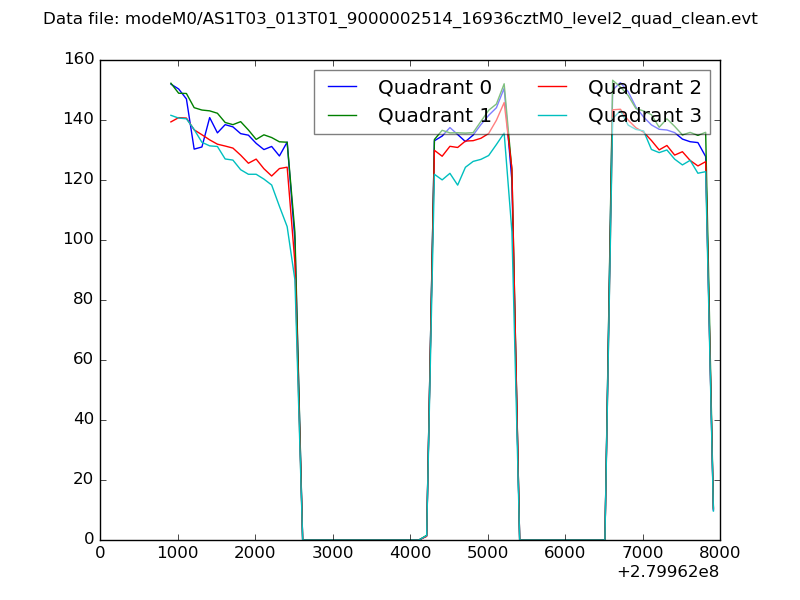 |
|
| Module-wise count rates for Quadrant A Data is divided into 100 sec bins |
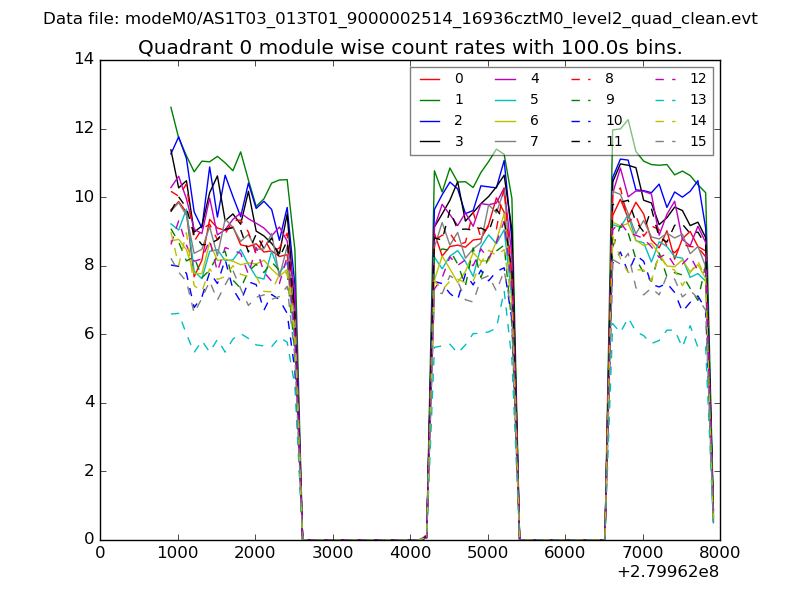 |
 |
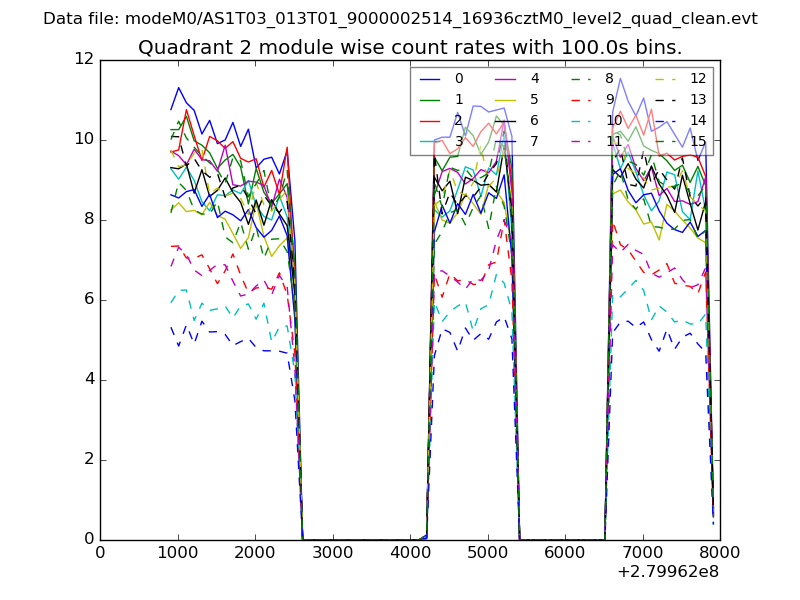
| Module-wise count rates for Quadrant B Data is divided into 100 sec bins |
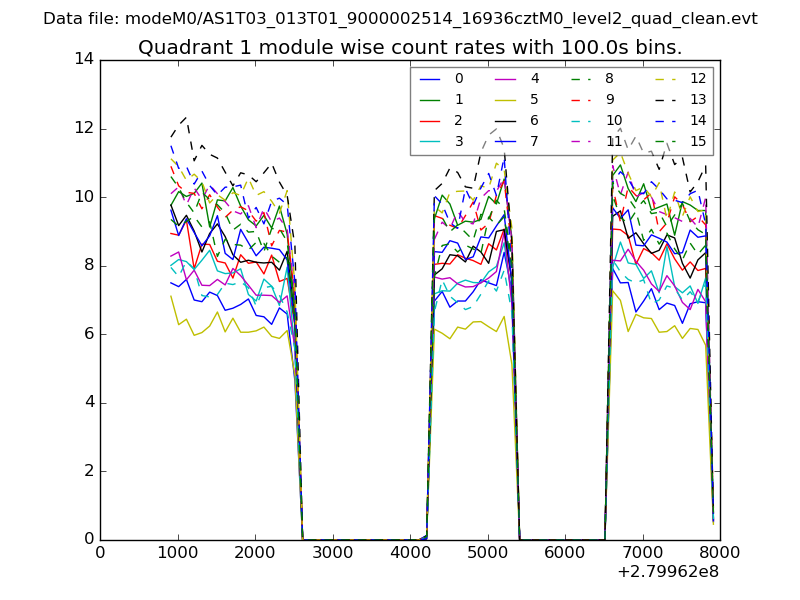 |
 |
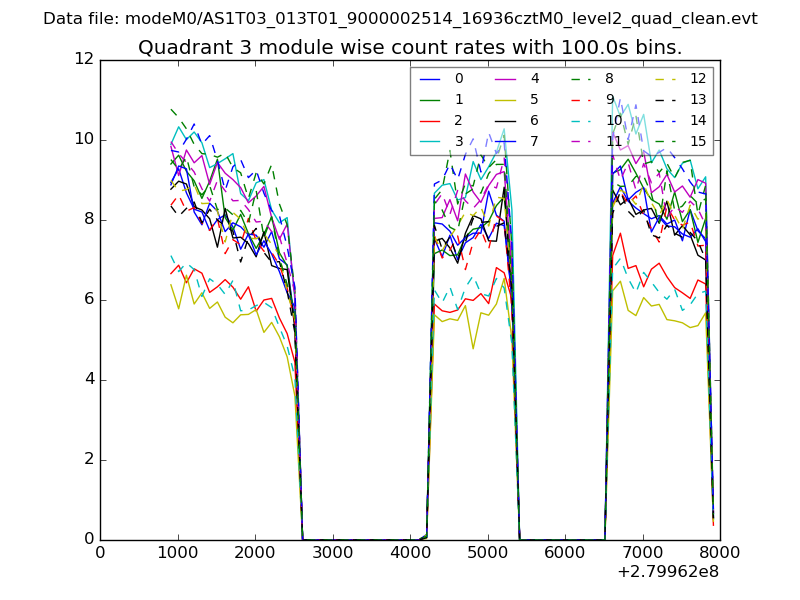
| Module-wise count rates for Quadrant C Data is divided into 100 sec bins |
 |
 |
| Module-wise count rates for Quadrant D Data is divided into 100 sec bins |
 |
 |
| Parameter | Plot |
|---|---|
| CZT HV Monitor |  |
| D_VDD | 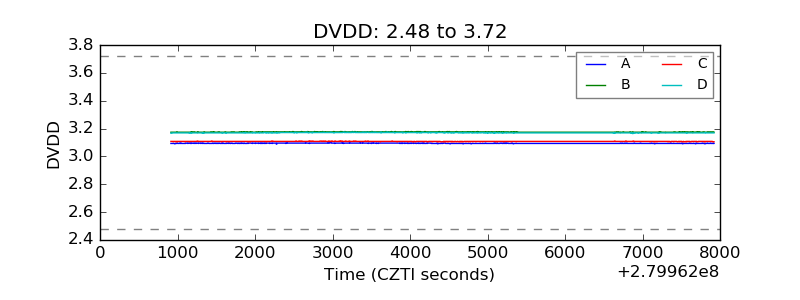 |
| Temperature 1 |  |
| Veto HV Monitor | 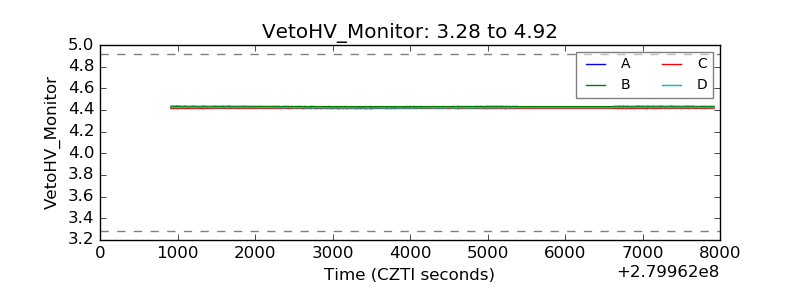 |
| Veto LLD | 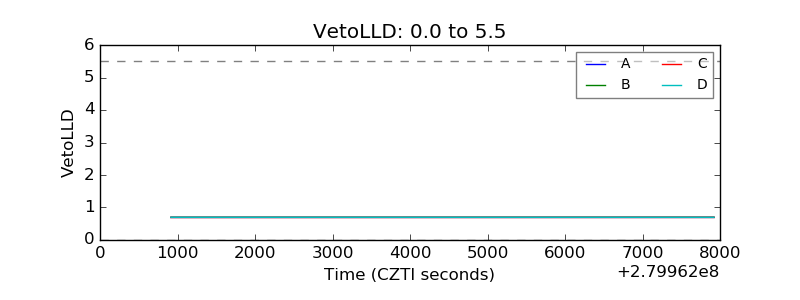 |
| Alpha Counter |  |
| _CPM_Rate | 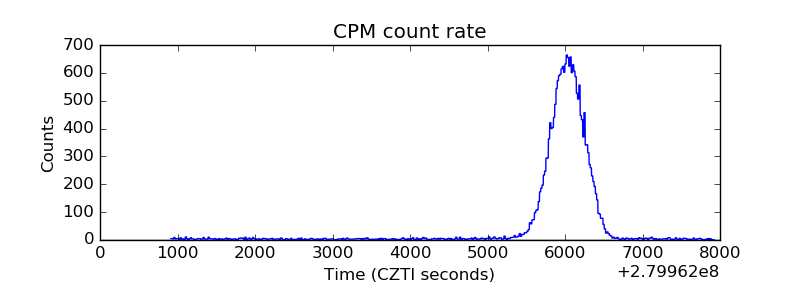 |
| CZT Counter |  |
| +2.5 Volts monitor |  |
| +5 Volts monitor |  |
| _ROLL_ROT | 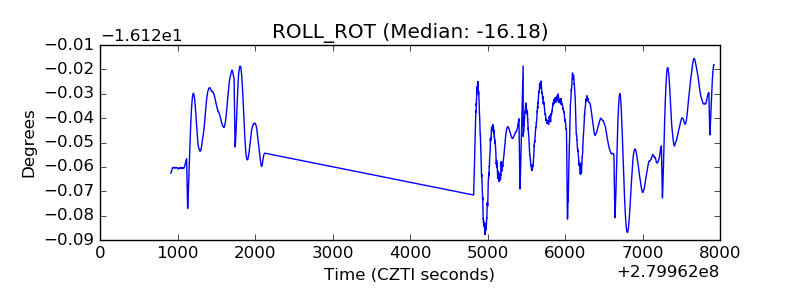 |
| _Roll_DEC |  |
| _Roll_RA | 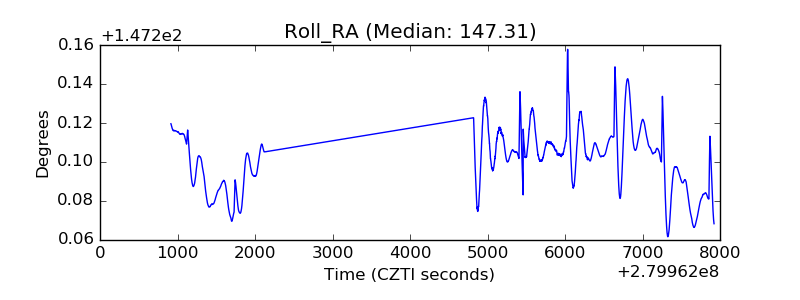 |
| Veto Counter |  |