| Param | Original file | Final file |
|---|---|---|
| Filename | modeM0/AS1T03_013T01_9000002514_16937cztM0_level2.evt | modeM0/AS1T03_013T01_9000002514_16937cztM0_level2_quad_clean.evt |
| Size (bytes) | 477,826,560 | 91,638,720 |
| Size | 455.7 MB | 87.4 MB |
| Events in quadrant A | 3,708,636 | 595,053 |
| Events in quadrant B | 3,063,585 | 602,922 |
| Events in quadrant C | 3,438,396 | 575,287 |
| Events in quadrant D | 3,834,941 | 564,459 |
| Mode M0 | |||
|---|---|---|---|
| Quadrant | BADHDUFLAG | Total packets | Discarded packets |
| A | 0 | 15185 | 1 |
| B | 0 | 13053 | 1 |
| C | 0 | 14207 | 2 |
| D | 0 | 15602 | 1 |
| Mode M9 | |||
|---|---|---|---|
| Quadrant | BADHDUFLAG | Total packets | Discarded packets |
| A | 0 | 10 | 0 |
| B | 0 | 10 | 0 |
| C | 0 | 10 | 0 |
| D | 0 | 10 | 0 |
| Mode SS | |||
|---|---|---|---|
| Quadrant | BADHDUFLAG | Total packets | Discarded packets |
| A | 0 | 128 | 0 |
| B | 0 | 128 | 0 |
| C | 0 | 128 | 0 |
| D | 0 | 128 | 0 |
| Quadrant | Total seconds | Saturated seconds | Saturation percentage |
|---|---|---|---|
| A | 6274 | 171 | 2.725534% |
| B | 6275 | 88 | 1.402390% |
| C | 6274 | 114 | 1.817023% |
| D | 6274 | 81 | 1.291042% |
Noise dominated data is calculated using 1-second bins in cleaned event files. If a bin has >2000 counts, and if more than 50% of those come from <1% of pixels, then it is considered to be noise-dominated and hence unusable.
| Quadrant | # 1 sec bins | Bins with >0 counts | Bins with >2000 counts | High rate bins dominated by noise | Noise dominated (total time) | Noise dominated (detector-on time) | Marked lightcurve |
|---|---|---|---|---|---|---|---|
| A | 7220 | 6277 | 51 | 51 | 0.71% | 0.81% | 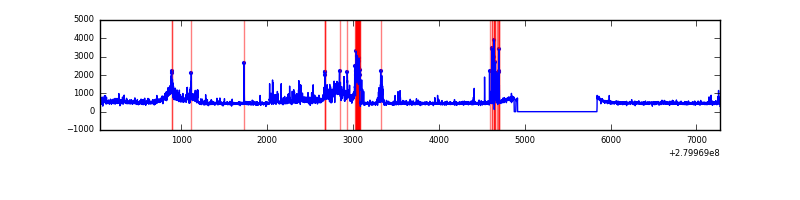 |
| B | 7221 | 6278 | 2 | 2 | 0.03% | 0.03% | 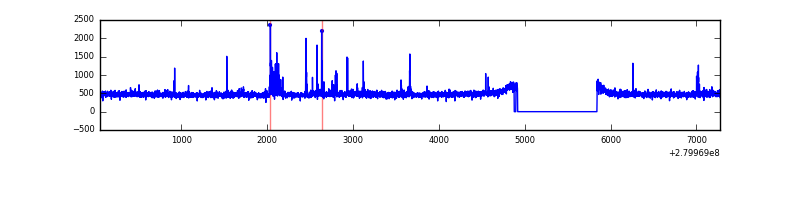 |
| C | 7220 | 6277 | 0 | 0 | 0.00% | 0.00% | 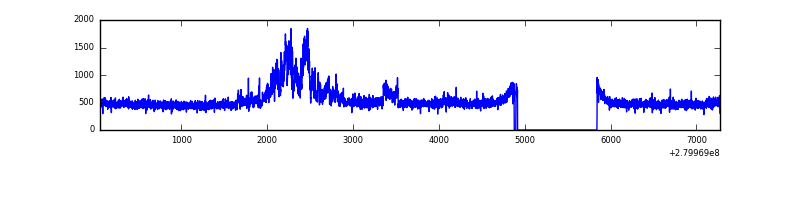 |
| D | 7220 | 6277 | 2 | 2 | 0.03% | 0.03% | 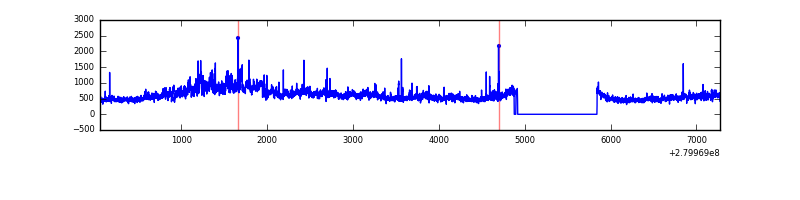 |
Top three noisy pixels from each quadrant. If the there are fewer than three noisy pixels in the level2.evt file, extra rows are filled as -1
| Pixel properties | Quadrant properties | ||||||
|---|---|---|---|---|---|---|---|
| Quadrant | DetID | PixID | Counts | Sigma | Mean | Median | Sigma |
| A | 15 | 174 | 772751 | 5036.02 | 755 | 738 | 153.3 |
| A | 0 | 23 | 31847 | 202.93 | 755 | 738 | 153.3 |
| A | 0 | 226 | 8613 | 51.37 | 755 | 738 | 153.3 |
| B | 0 | 197 | 47732 | 333.46 | 747 | 728 | 141.0 |
| B | 15 | 35 | 28138 | 194.45 | 747 | 728 | 141.0 |
| B | 0 | 229 | 24250 | 166.87 | 747 | 728 | 141.0 |
| C | 3 | 233 | 542550 | 3303.74 | 713 | 716 | 164.0 |
| C | 14 | 238 | 111030 | 672.62 | 713 | 716 | 164.0 |
| C | 13 | 61 | 5068 | 26.54 | 713 | 716 | 164.0 |
| D | 1 | 52 | 1005785 | 5679.05 | 730 | 709 | 177.0 |
| D | 2 | 152 | 30729 | 169.62 | 730 | 709 | 177.0 |
| D | 2 | 234 | 30123 | 166.2 | 730 | 709 | 177.0 |
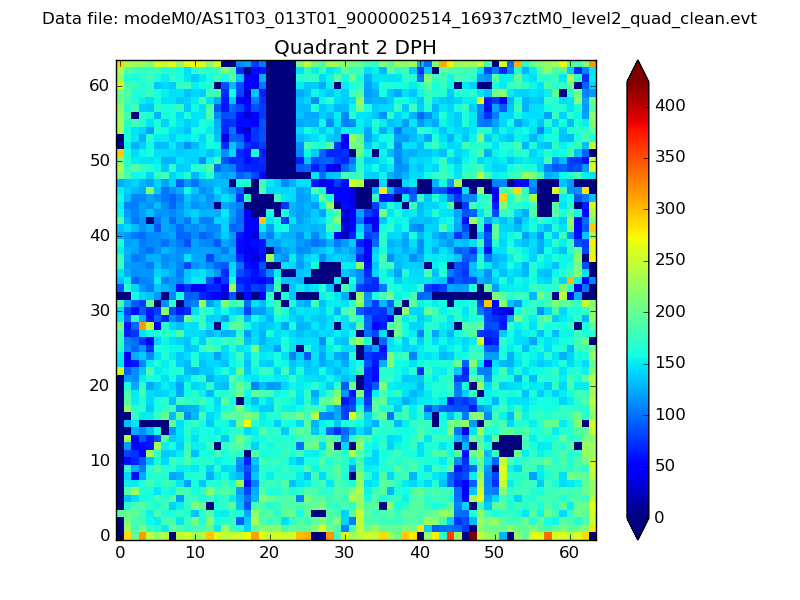
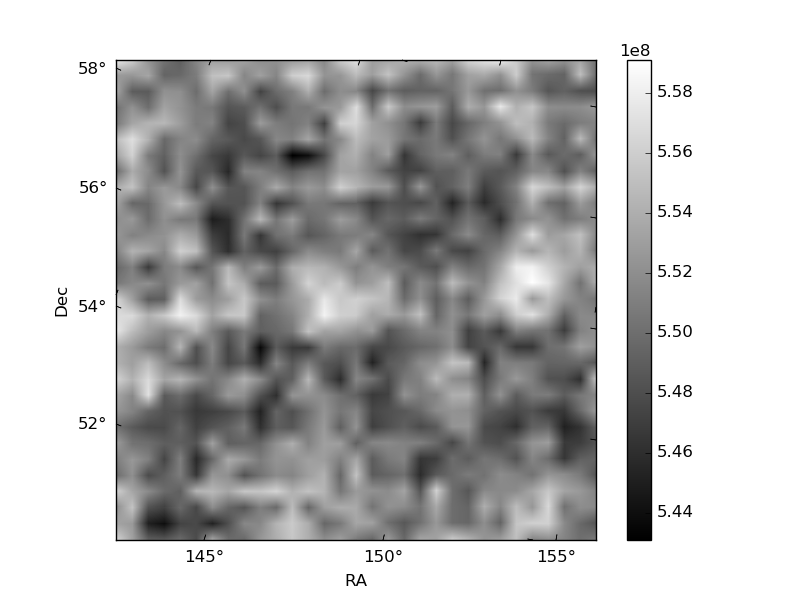
Histogram calculated using DETX and DETY for each event in the final _common_clean file
| Quadrant A | 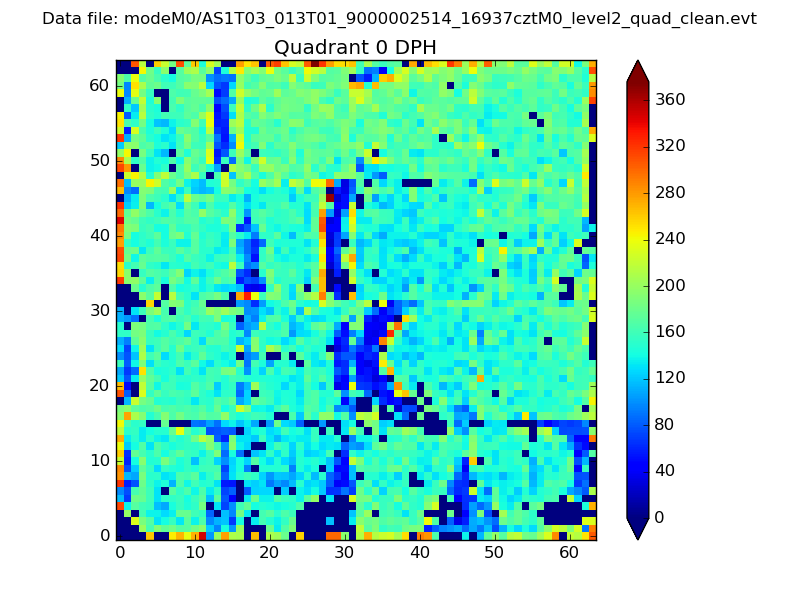 |
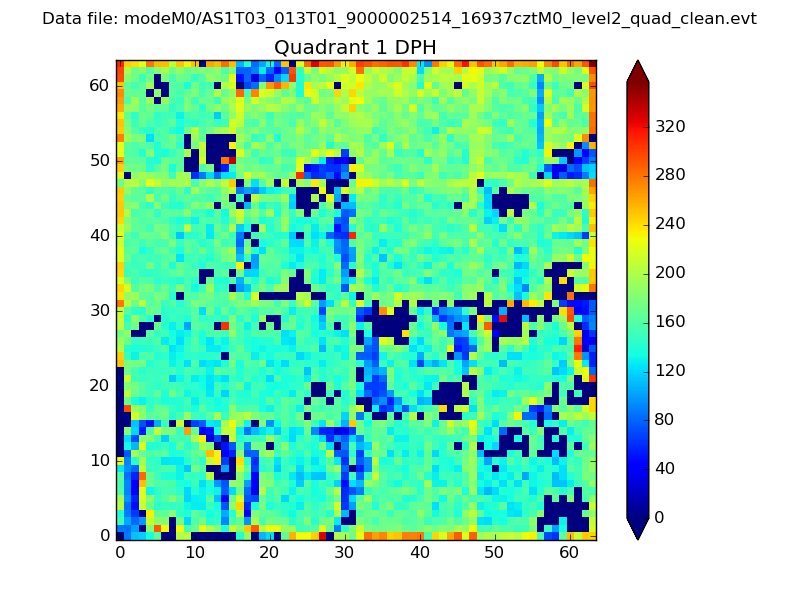 |
Quadrant B |
|---|---|---|---|
| Quadrant D | 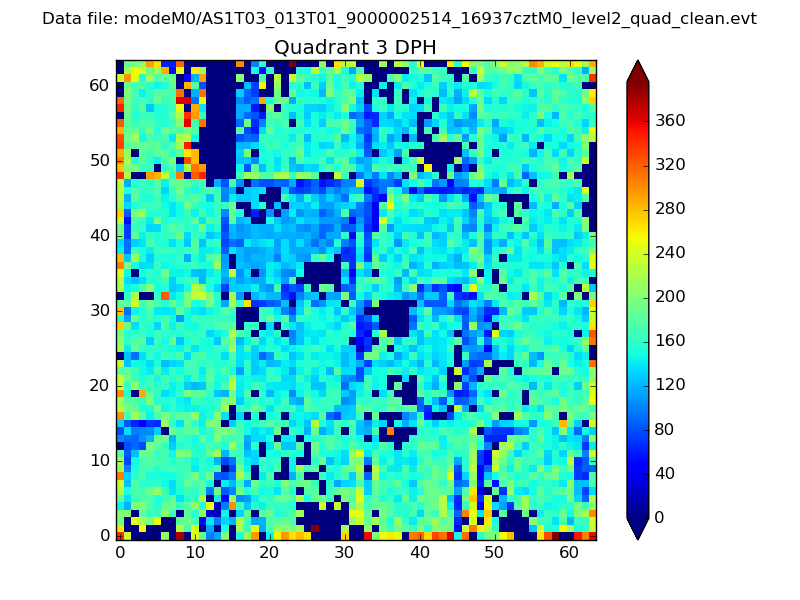 |
 |
Quadrant C |
| Plot type | Count rate plots | Images |
|---|---|---|
| Comparison with Poisson distribution Blue bars denote a histogram of data divided into 1 sec bins. Red curve is a Poisson curve with rate = median count rate of data. |
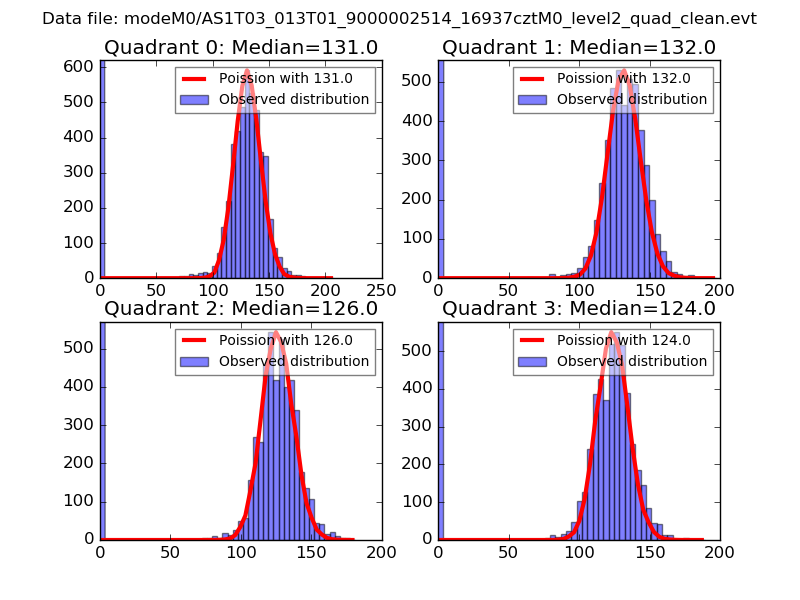 |
 |
| Quadrant-wise count rates Data is divided into 100 sec bins |
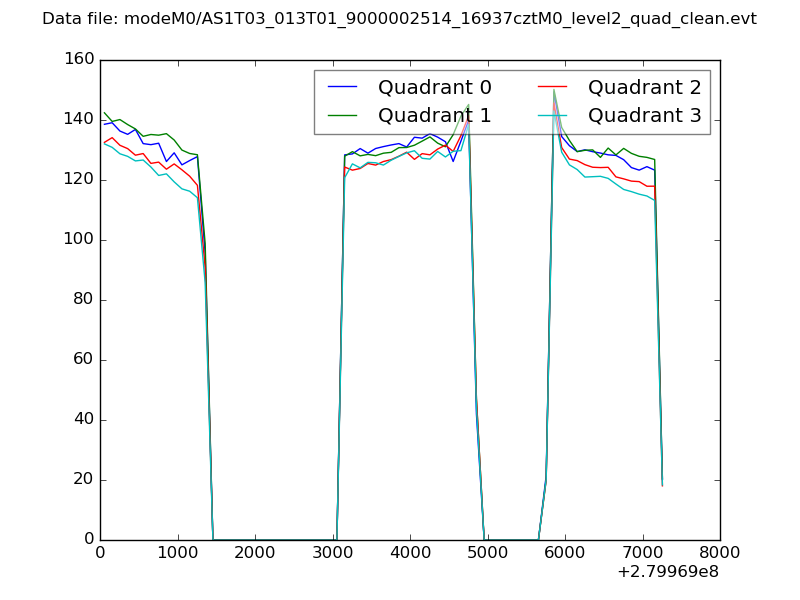 |
|
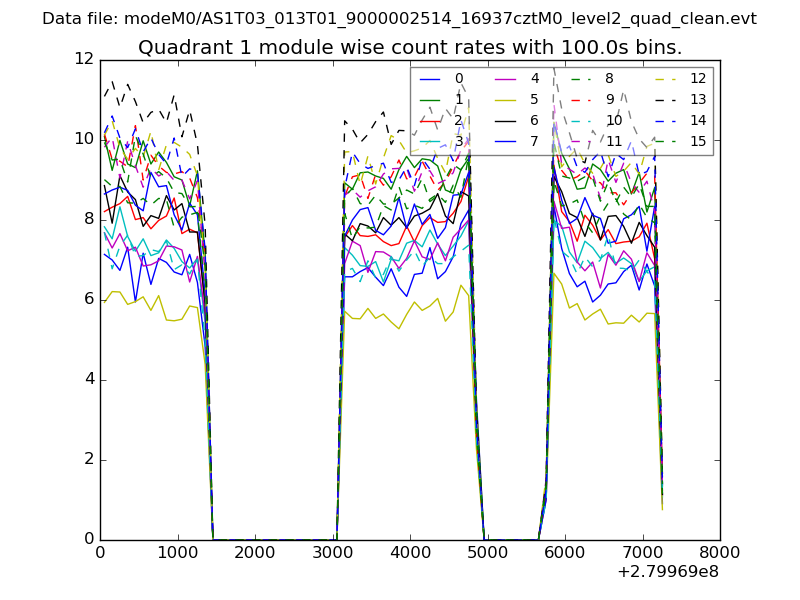
| Module-wise count rates for Quadrant A Data is divided into 100 sec bins |
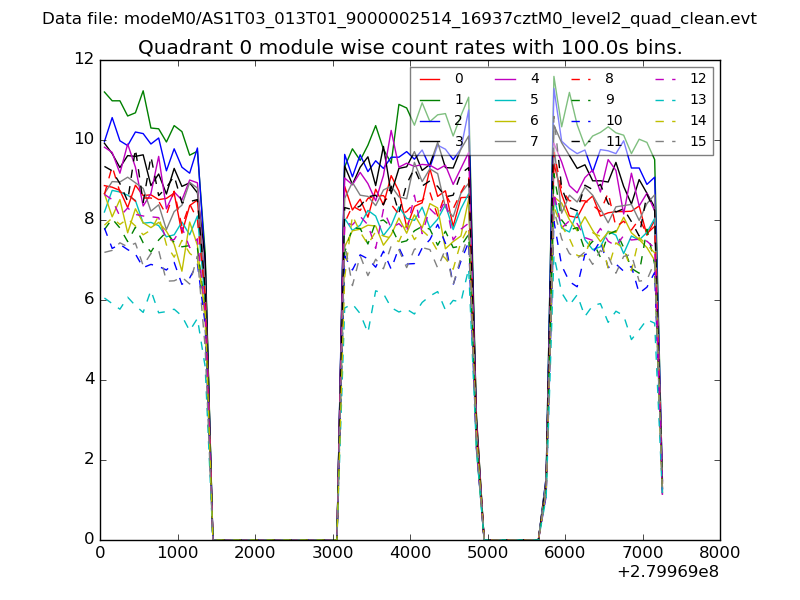 |
 |
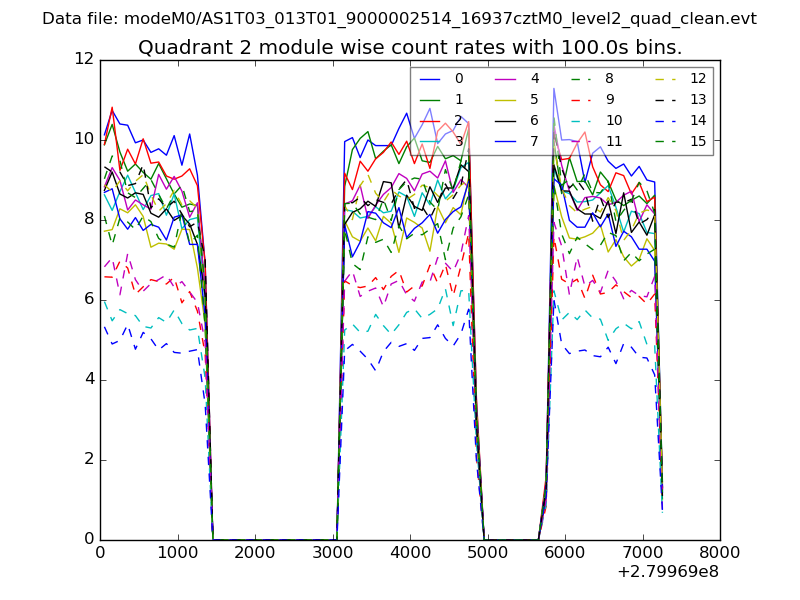
| Module-wise count rates for Quadrant B Data is divided into 100 sec bins |
 |
 |
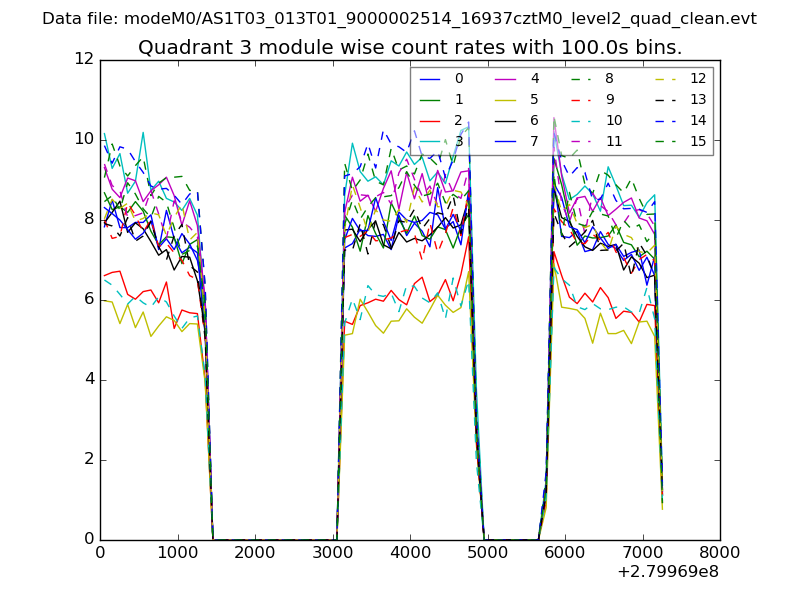
| Module-wise count rates for Quadrant C Data is divided into 100 sec bins |
 |
 |
| Module-wise count rates for Quadrant D Data is divided into 100 sec bins |
 |
 |
| Parameter | Plot |
|---|---|
| CZT HV Monitor | 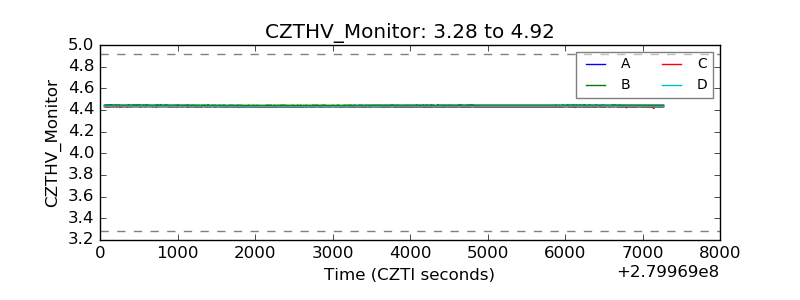 |
| D_VDD | 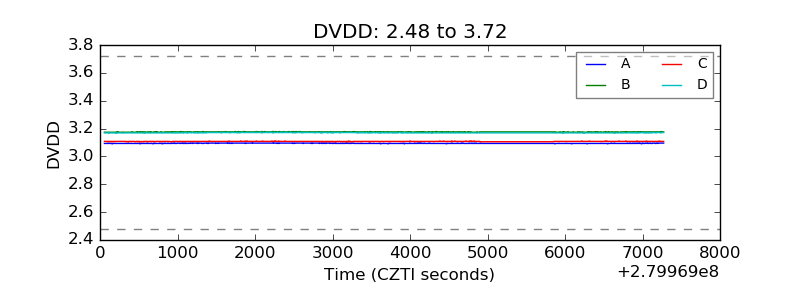 |
| Temperature 1 | 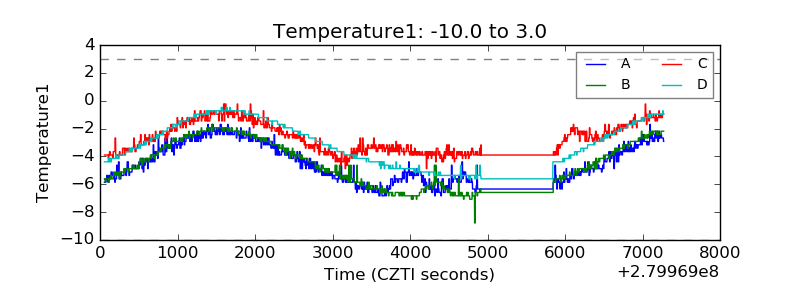 |
| Veto HV Monitor | 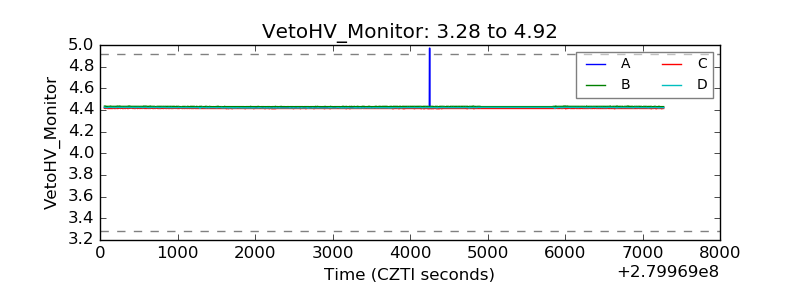 |
| Veto LLD | 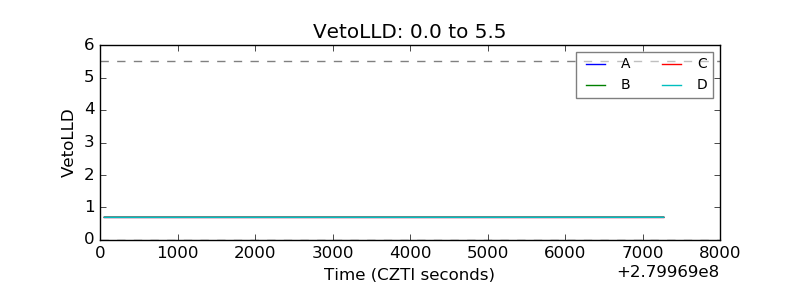 |
| Alpha Counter | 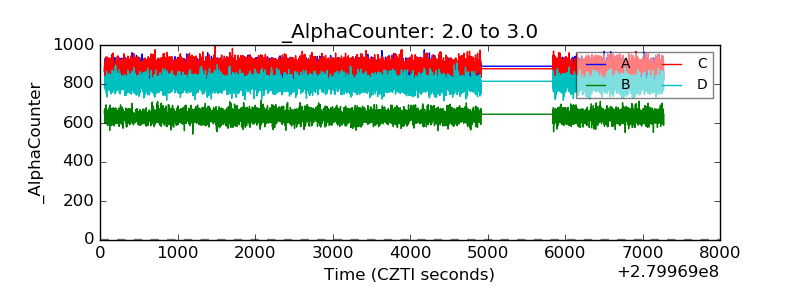 |
| _CPM_Rate | 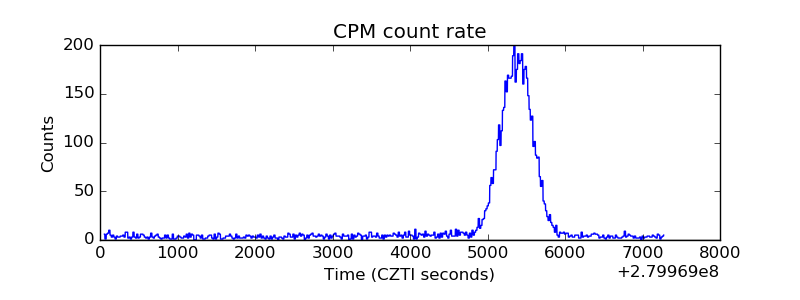 |
| CZT Counter |  |
| +2.5 Volts monitor | 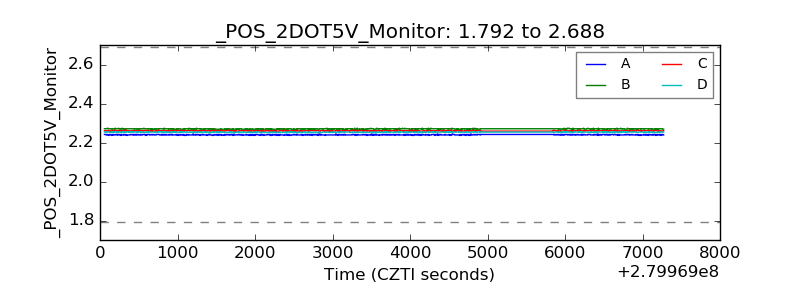 |
| +5 Volts monitor |  |
| _ROLL_ROT | 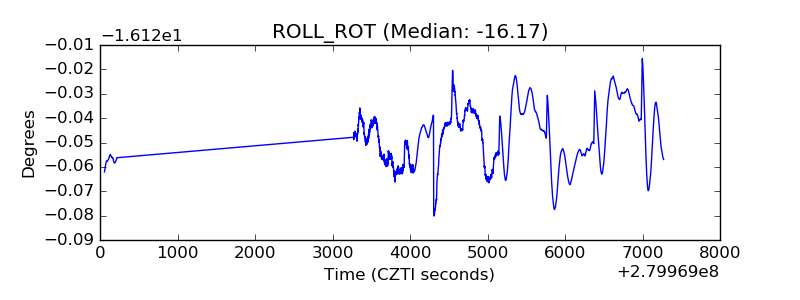 |
| _Roll_DEC | 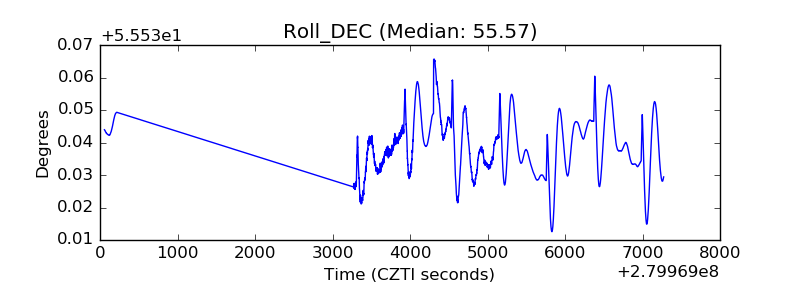 |
| _Roll_RA | 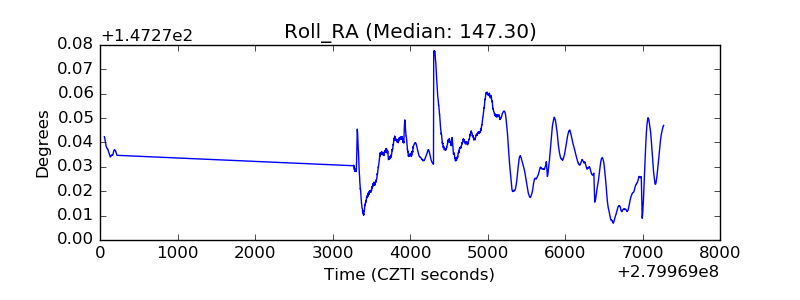 |
| Veto Counter | 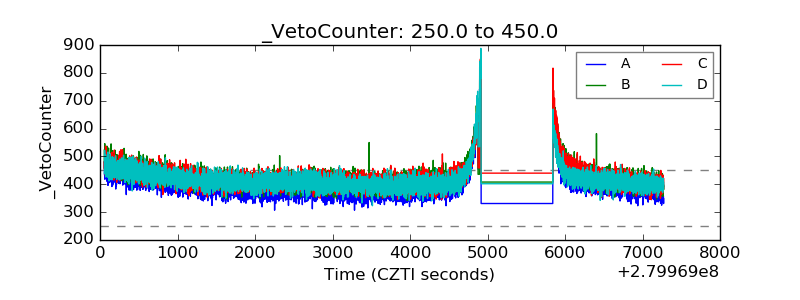 |