| Param | Original file | Final file |
|---|---|---|
| Filename | modeM0/AS1T03_013T01_9000002514_16938cztM0_level2.evt | modeM0/AS1T03_013T01_9000002514_16938cztM0_level2_quad_clean.evt |
| Size (bytes) | 284,693,760 | 47,208,960 |
| Size | 271.5 MB | 45.0 MB |
| Events in quadrant A | 2,158,575 | 290,599 |
| Events in quadrant B | 1,938,519 | 292,593 |
| Events in quadrant C | 1,922,789 | 281,377 |
| Events in quadrant D | 2,325,508 | 278,923 |
| Mode M0 | |||
|---|---|---|---|
| Quadrant | BADHDUFLAG | Total packets | Discarded packets |
| A | 0 | 9156 | 0 |
| B | 0 | 8395 | 0 |
| C | 0 | 8233 | 0 |
| D | 0 | 9801 | 0 |
| Mode SS | |||
|---|---|---|---|
| Quadrant | BADHDUFLAG | Total packets | Discarded packets |
| A | 0 | 80 | 0 |
| B | 0 | 80 | 0 |
| C | 0 | 80 | 0 |
| D | 0 | 80 | 0 |
| Quadrant | Total seconds | Saturated seconds | Saturation percentage |
|---|---|---|---|
| A | 4053 | 58 | 1.431039% |
| B | 4053 | 11 | 0.271404% |
| C | 4053 | 11 | 0.271404% |
| D | 4054 | 3 | 0.074001% |
Noise dominated data is calculated using 1-second bins in cleaned event files. If a bin has >2000 counts, and if more than 50% of those come from <1% of pixels, then it is considered to be noise-dominated and hence unusable.
| Quadrant | # 1 sec bins | Bins with >0 counts | Bins with >2000 counts | High rate bins dominated by noise | Noise dominated (total time) | Noise dominated (detector-on time) | Marked lightcurve |
|---|---|---|---|---|---|---|---|
| A | 4054 | 4054 | 43 | 43 | 1.06% | 1.06% |  |
| B | 4054 | 4054 | 6 | 6 | 0.15% | 0.15% |  |
| C | 4054 | 4054 | 0 | 0 | 0.00% | 0.00% |  |
| D | 4055 | 4055 | 1 | 1 | 0.02% | 0.02% |  |
Top three noisy pixels from each quadrant. If the there are fewer than three noisy pixels in the level2.evt file, extra rows are filled as -1
| Pixel properties | Quadrant properties | ||||||
|---|---|---|---|---|---|---|---|
| Quadrant | DetID | PixID | Counts | Sigma | Mean | Median | Sigma |
| A | 15 | 174 | 377294 | 3970.52 | 461 | 452 | 94.9 |
| A | 0 | 23 | 6018 | 58.65 | 461 | 452 | 94.9 |
| A | 0 | 226 | 4340 | 40.97 | 461 | 452 | 94.9 |
| B | 0 | 197 | 39115 | 442.33 | 458 | 448 | 87.4 |
| B | 0 | 230 | 33305 | 375.87 | 458 | 448 | 87.4 |
| B | 0 | 229 | 23414 | 262.72 | 458 | 448 | 87.4 |
| C | 3 | 233 | 127360 | 1214.79 | 442 | 445 | 104.5 |
| C | 14 | 238 | 69744 | 663.31 | 442 | 445 | 104.5 |
| C | 13 | 61 | 3198 | 26.35 | 442 | 445 | 104.5 |
| D | 1 | 52 | 539826 | 4893.7 | 450 | 436 | 110.2 |
| D | 12 | 225 | 26658 | 237.9 | 450 | 436 | 110.2 |
| D | 2 | 152 | 22231 | 197.74 | 450 | 436 | 110.2 |
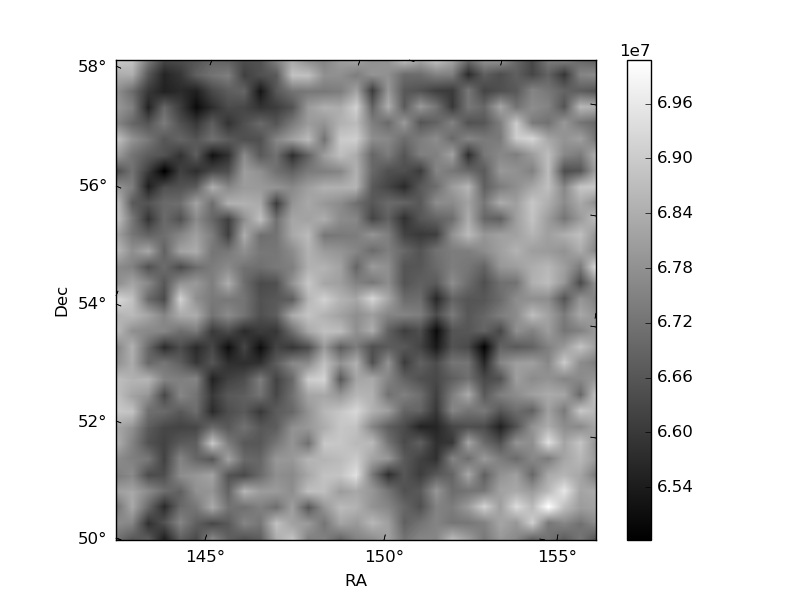
Histogram calculated using DETX and DETY for each event in the final _common_clean file
| Quadrant A |  |
 |
Quadrant B |
|---|---|---|---|
| Quadrant D |  |
 |
Quadrant C |
| Plot type | Count rate plots | Images |
|---|---|---|
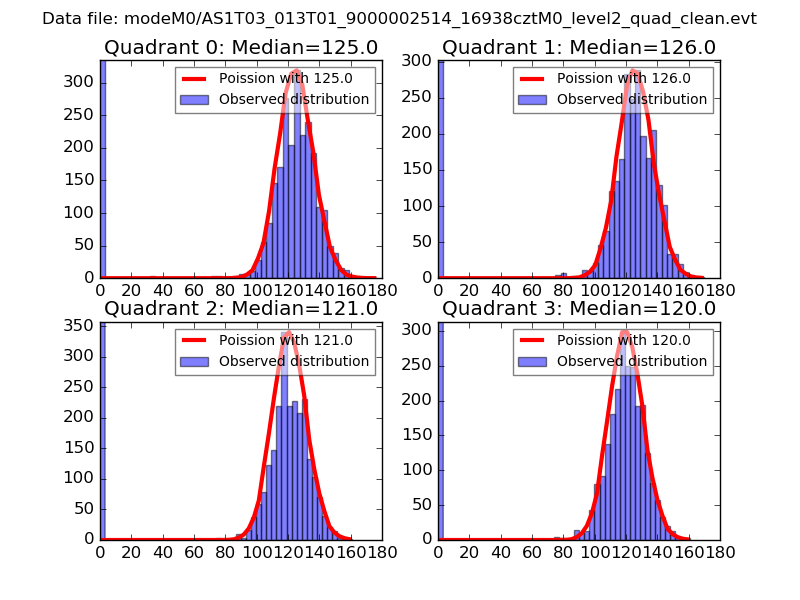
| Comparison with Poisson distribution Blue bars denote a histogram of data divided into 1 sec bins. Red curve is a Poisson curve with rate = median count rate of data. |
 |
 |
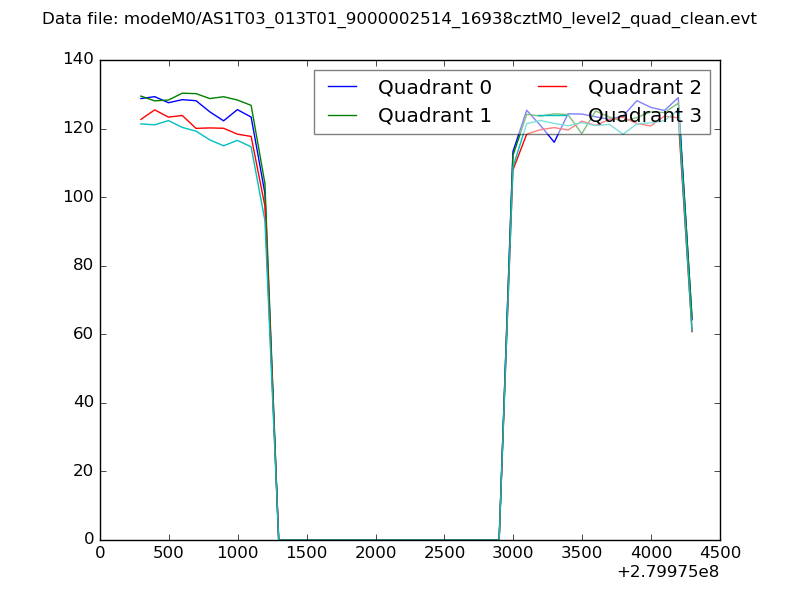
| Quadrant-wise count rates Data is divided into 100 sec bins |
 |
|
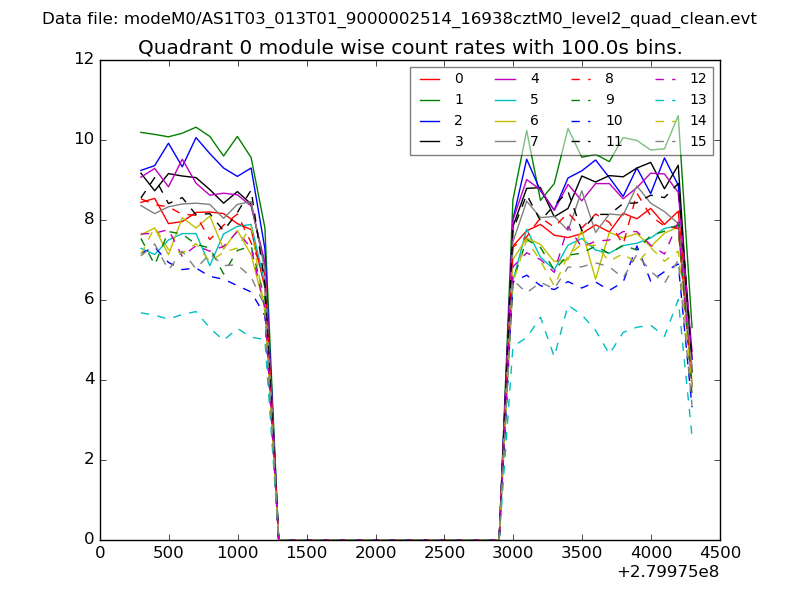
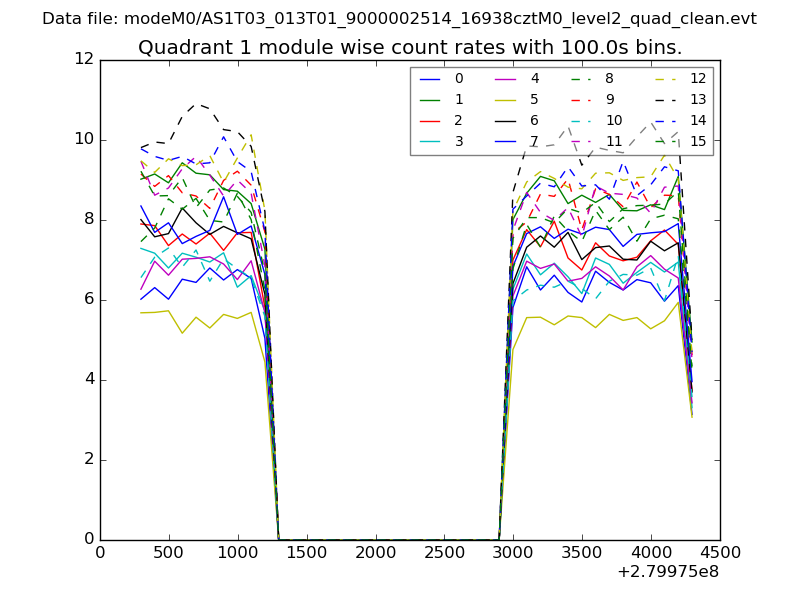
| Module-wise count rates for Quadrant A Data is divided into 100 sec bins |
 |
 |
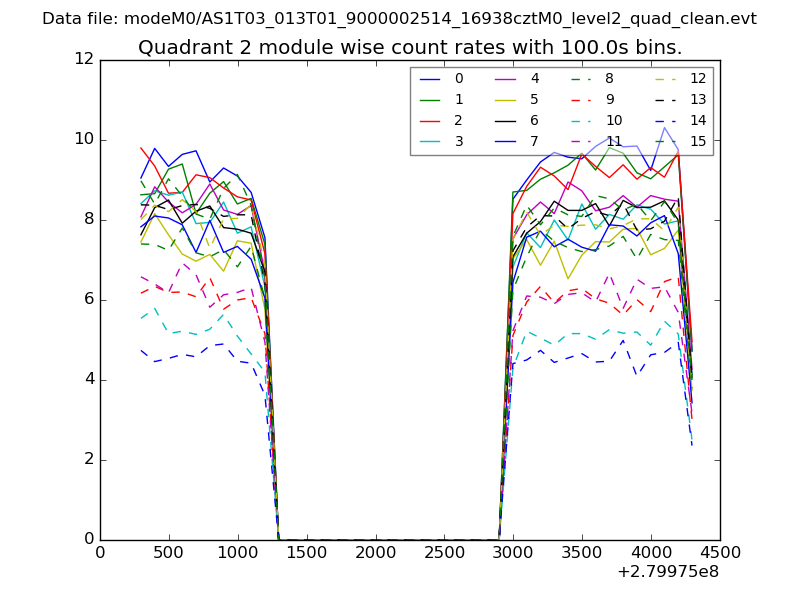
| Module-wise count rates for Quadrant B Data is divided into 100 sec bins |
 |
 |
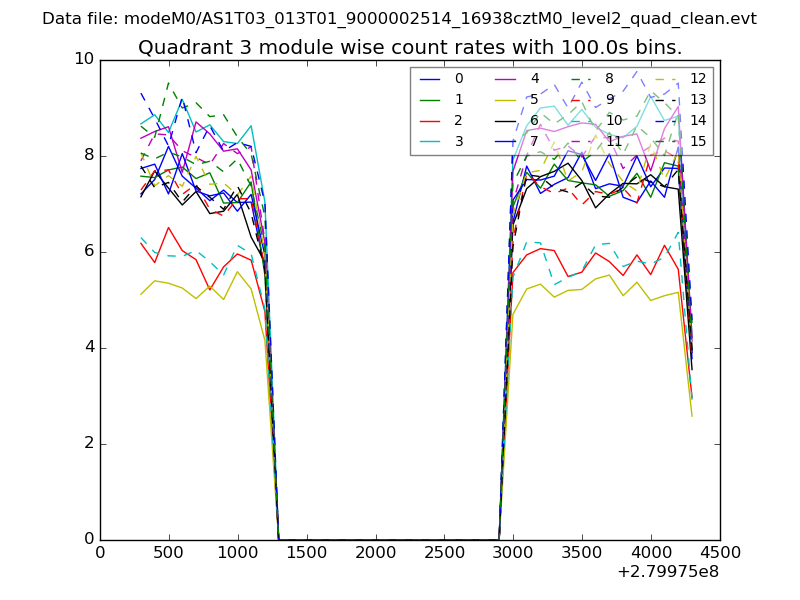
| Module-wise count rates for Quadrant C Data is divided into 100 sec bins |
 |
 |
| Module-wise count rates for Quadrant D Data is divided into 100 sec bins |
 |
 |
| Parameter | Plot |
|---|---|
| CZT HV Monitor | 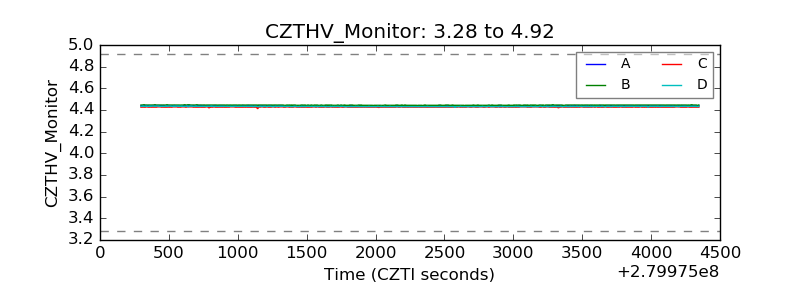 |
| D_VDD | 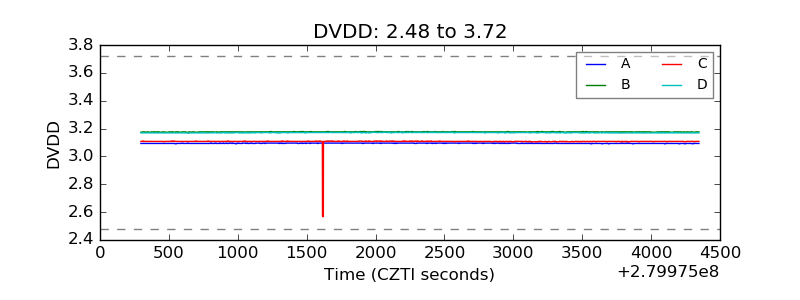 |
| Temperature 1 | 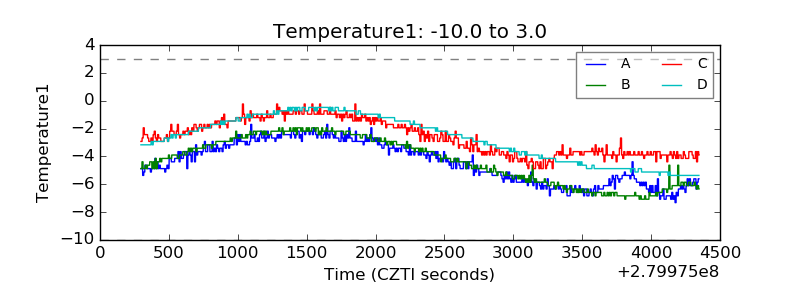 |
| Veto HV Monitor | 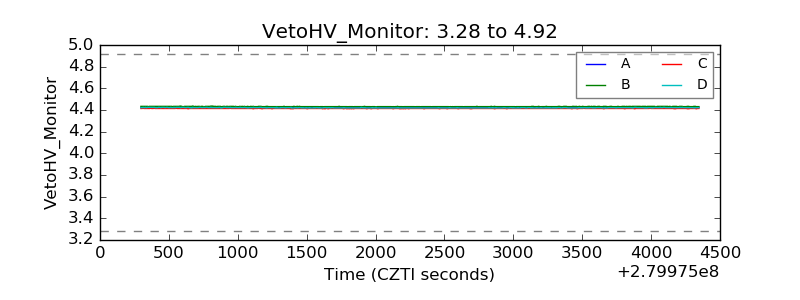 |
| Veto LLD | 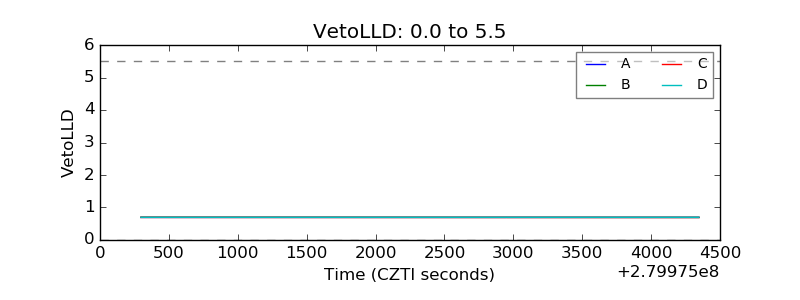 |
| Alpha Counter | 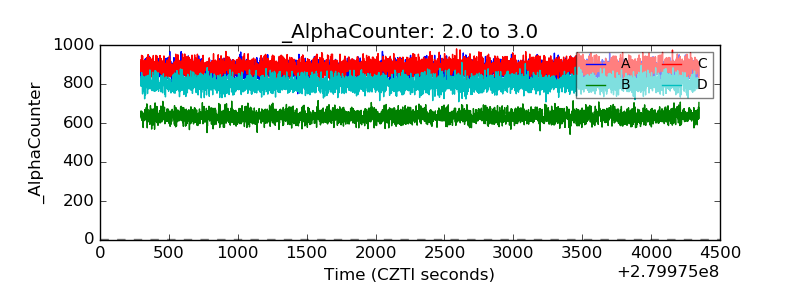 |
| _CPM_Rate | 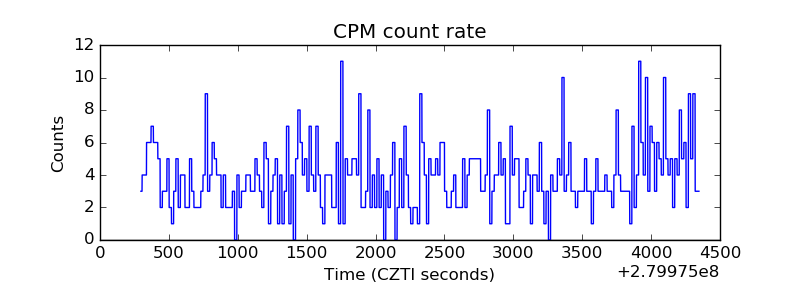 |
| CZT Counter |  |
| +2.5 Volts monitor |  |
| +5 Volts monitor |  |
| _ROLL_ROT | 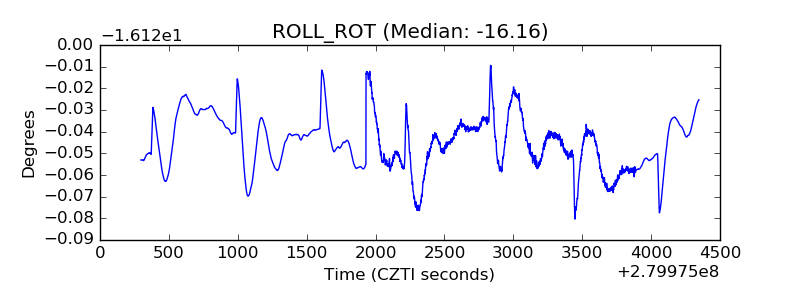 |
| _Roll_DEC | 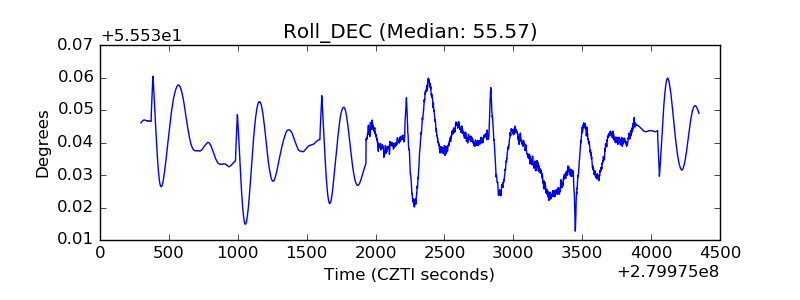 |
| _Roll_RA | 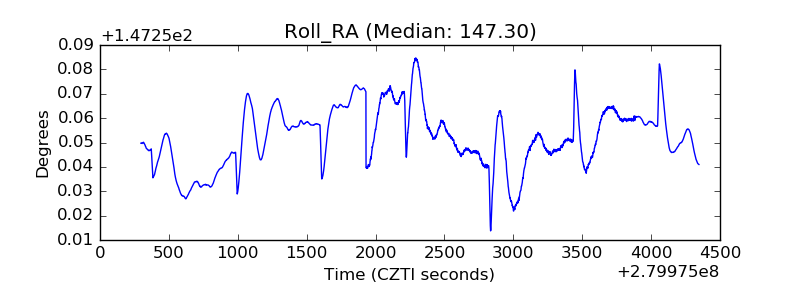 |
| Veto Counter | 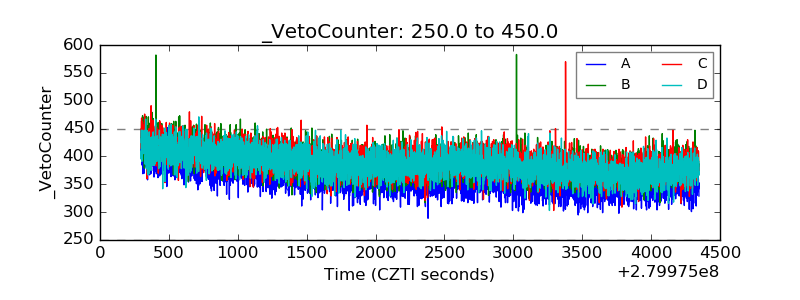 |