| Param | Original file | Final file |
|---|---|---|
| Filename | modeM0/AS1A05_182T03_9000002516cztM0_level2.fits | modeM0/AS1A05_182T03_9000002516cztM0_level2_quad_clean.evt |
| Size (bytes) | 84,625,920 | 77,451,840 |
| Size | 80.7 MB | 73.9 MB |
| Events in quadrant A | 508,928 | 447,887 |
| Events in quadrant B | 489,910 | 448,966 |
| Events in quadrant C | 493,466 | 421,378 |
| Events in quadrant D | 435,948 | 391,869 |
| Mode M0 | |||
|---|---|---|---|
| Quadrant | BADHDUFLAG | Total packets | Discarded packets |
| A | 0 | 22453 | 0 |
| B | 0 | 19989 | 0 |
| C | 0 | 20303 | 0 |
| D | 0 | 19997 | 0 |
| Mode M9 | |||
|---|---|---|---|
| Quadrant | BADHDUFLAG | Total packets | Discarded packets |
| A | 0 | 8 | 0 |
| B | 0 | 8 | 0 |
| C | 0 | 8 | 0 |
| D | 0 | 8 | 0 |
| Mode SS | |||
|---|---|---|---|
| Quadrant | BADHDUFLAG | Total packets | Discarded packets |
| A | 0 | 188 | 0 |
| B | 0 | 188 | 0 |
| C | 0 | 188 | 0 |
| D | 0 | 188 | 0 |
| Quadrant | Total seconds | Saturated seconds | Saturation percentage |
|---|---|---|---|
| A | 9143 | 278 | 3.040577% |
| B | 9143 | 206 | 2.253090% |
| C | 9143 | 223 | 2.439024% |
| D | 9143 | 189 | 2.067155% |
Noise dominated data is calculated using 1-second bins in cleaned event files. If a bin has >2000 counts, and if more than 50% of those come from <1% of pixels, then it is considered to be noise-dominated and hence unusable.
| Quadrant | # 1 sec bins | Bins with >0 counts | Bins with >2000 counts | High rate bins dominated by noise | Noise dominated (total time) | Noise dominated (detector-on time) | Marked lightcurve |
|---|---|---|---|---|---|---|---|
| A | 9948 | 9143 | 0 | 0 | 0.00% | 0.00% |  |
| B | 9948 | 9143 | 0 | 0 | 0.00% | 0.00% |  |
| C | 9948 | 9143 | 0 | 0 | 0.00% | 0.00% |  |
| D | 9948 | 9142 | 0 | 0 | 0.00% | 0.00% |  |
Top three noisy pixels from each quadrant. If the there are fewer than three noisy pixels in the level2.evt file, extra rows are filled as -1
| Pixel properties | Quadrant properties | ||||||
|---|---|---|---|---|---|---|---|
| Quadrant | DetID | PixID | Counts | Sigma | Mean | Median | Sigma |
| A | 0 | 29 | 531 | 11.6 | 132 | 123 | 35.2 |
| A | 14 | 188 | 499 | 10.69 | 132 | 123 | 35.2 |
| A | 14 | 204 | 461 | 9.61 | 132 | 123 | 35.2 |
| B | 2 | 9 | 415 | 10.43 | 129 | 123 | 28.0 |
| B | 3 | 17 | 353 | 8.21 | 129 | 123 | 28.0 |
| B | 2 | 8 | 330 | 7.39 | 129 | 123 | 28.0 |
| C | 3 | 126 | 349 | 6.58 | 130 | 120 | 34.8 |
| C | 2 | 191 | 337 | 6.24 | 130 | 120 | 34.8 |
| C | 9 | 233 | 334 | 6.15 | 130 | 120 | 34.8 |
| D | 3 | 14 | 344 | 6.73 | 124 | 112 | 34.5 |
| D | 1 | 19 | 326 | 6.21 | 124 | 112 | 34.5 |
| D | 6 | 232 | 317 | 5.95 | 124 | 112 | 34.5 |
Histogram calculated using DETX and DETY for each event in the final _common_clean file
| Quadrant A |  |
 |
Quadrant B |
|---|---|---|---|
| Quadrant D | 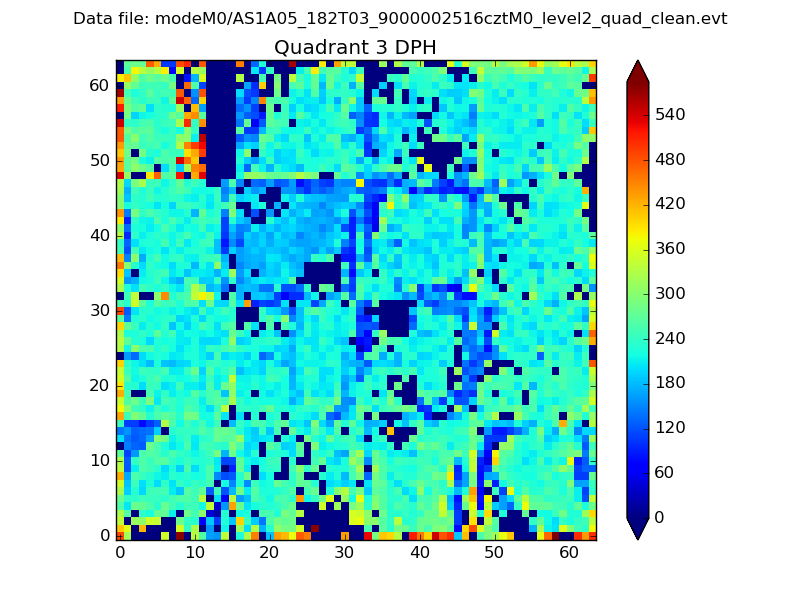 |
 |
Quadrant C |
| Plot type | Count rate plots | Images |
|---|---|---|
| Comparison with Poisson distribution Blue bars denote a histogram of data divided into 1 sec bins. Red curve is a Poisson curve with rate = median count rate of data. |
 |
 |
| Quadrant-wise count rates Data is divided into 100 sec bins |
 |
|
| Module-wise count rates for Quadrant A Data is divided into 100 sec bins |
 |
 |
| Module-wise count rates for Quadrant B Data is divided into 100 sec bins |
 |
 |
| Module-wise count rates for Quadrant C Data is divided into 100 sec bins |
 |
 |
| Module-wise count rates for Quadrant D Data is divided into 100 sec bins |
 |
 |
| Parameter | Plot |
|---|---|
| CZT HV Monitor |  |
| D_VDD | 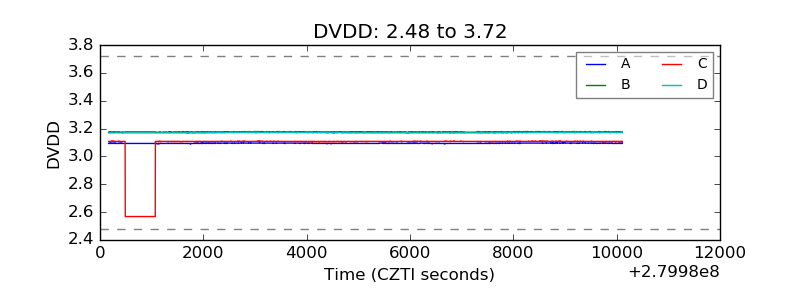 |
| Temperature 1 |  |
| Veto HV Monitor |  |
| Veto LLD |  |
| Alpha Counter |  |
| _CPM_Rate |  |
| CZT Counter |  |
| +2.5 Volts monitor |  |
| +5 Volts monitor |  |
| _ROLL_ROT |  |
| _Roll_DEC |  |
| _Roll_RA |  |
| Veto Counter |  |