| Param | Original file | Final file |
|---|---|---|
| Filename | modeM0/AS1A05_182T03_9000002516_16938cztM0_level2.evt | modeM0/AS1A05_182T03_9000002516_16938cztM0_level2_quad_clean.evt |
| Size (bytes) | 128,931,840 | 27,817,920 |
| Size | 123.0 MB | 26.5 MB |
| Events in quadrant A | 929,376 | 181,128 |
| Events in quadrant B | 932,012 | 184,586 |
| Events in quadrant C | 971,099 | 173,974 |
| Events in quadrant D | 948,708 | 172,064 |
| Mode M0 | |||
|---|---|---|---|
| Quadrant | BADHDUFLAG | Total packets | Discarded packets |
| A | 0 | 3869 | 1 |
| B | 0 | 3883 | 1 |
| C | 0 | 3932 | 1 |
| D | 0 | 3944 | 1 |
| Mode M9 | |||
|---|---|---|---|
| Quadrant | BADHDUFLAG | Total packets | Discarded packets |
| A | 0 | 5 | 0 |
| B | 0 | 5 | 0 |
| C | 0 | 5 | 0 |
| D | 0 | 5 | 0 |
| Mode SS | |||
|---|---|---|---|
| Quadrant | BADHDUFLAG | Total packets | Discarded packets |
| A | 0 | 40 | 0 |
| B | 0 | 40 | 0 |
| C | 0 | 40 | 0 |
| D | 0 | 40 | 0 |
| Quadrant | Total seconds | Saturated seconds | Saturation percentage |
|---|---|---|---|
| A | 1768 | 87 | 4.920814% |
| B | 1768 | 70 | 3.959276% |
| C | 1768 | 76 | 4.298643% |
| D | 1768 | 68 | 3.846154% |
Noise dominated data is calculated using 1-second bins in cleaned event files. If a bin has >2000 counts, and if more than 50% of those come from <1% of pixels, then it is considered to be noise-dominated and hence unusable.
| Quadrant | # 1 sec bins | Bins with >0 counts | Bins with >2000 counts | High rate bins dominated by noise | Noise dominated (total time) | Noise dominated (detector-on time) | Marked lightcurve |
|---|---|---|---|---|---|---|---|
| A | 2344 | 1770 | 1 | 1 | 0.04% | 0.06% |  |
| B | 2344 | 1770 | 4 | 4 | 0.17% | 0.23% | 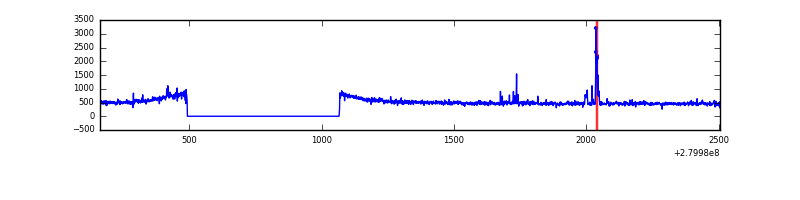 |
| C | 2344 | 1770 | 0 | 0 | 0.00% | 0.00% | 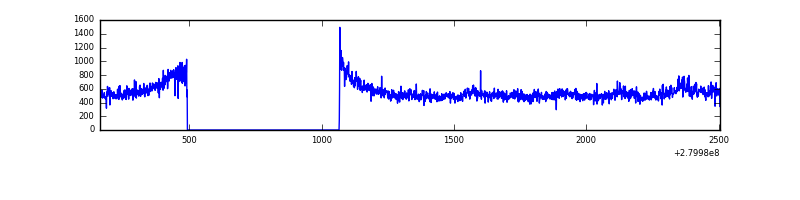 |
| D | 2344 | 1770 | 0 | 0 | 0.00% | 0.00% | 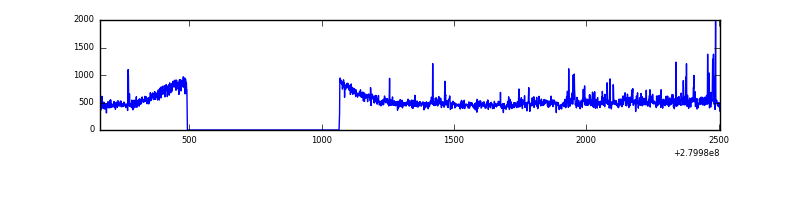 |
Top three noisy pixels from each quadrant. If the there are fewer than three noisy pixels in the level2.evt file, extra rows are filled as -1
| Pixel properties | Quadrant properties | ||||||
|---|---|---|---|---|---|---|---|
| Quadrant | DetID | PixID | Counts | Sigma | Mean | Median | Sigma |
| A | 15 | 174 | 28742 | 578.3 | 233 | 227 | 49.3 |
| A | 0 | 23 | 4318 | 82.97 | 233 | 227 | 49.3 |
| A | 0 | 226 | 2349 | 43.04 | 233 | 227 | 49.3 |
| B | 15 | 35 | 28462 | 597.61 | 228 | 221 | 47.3 |
| B | 12 | 111 | 5474 | 111.16 | 228 | 221 | 47.3 |
| B | 11 | 111 | 4963 | 100.35 | 228 | 221 | 47.3 |
| C | 3 | 233 | 91157 | 1720.75 | 217 | 216 | 52.8 |
| C | 14 | 238 | 32880 | 618.06 | 217 | 216 | 52.8 |
| C | 13 | 61 | 1535 | 24.96 | 217 | 216 | 52.8 |
| D | 1 | 52 | 71294 | 1250.25 | 225 | 217 | 56.9 |
| D | 2 | 152 | 13508 | 233.79 | 225 | 217 | 56.9 |
| D | 2 | 234 | 5884 | 99.68 | 225 | 217 | 56.9 |
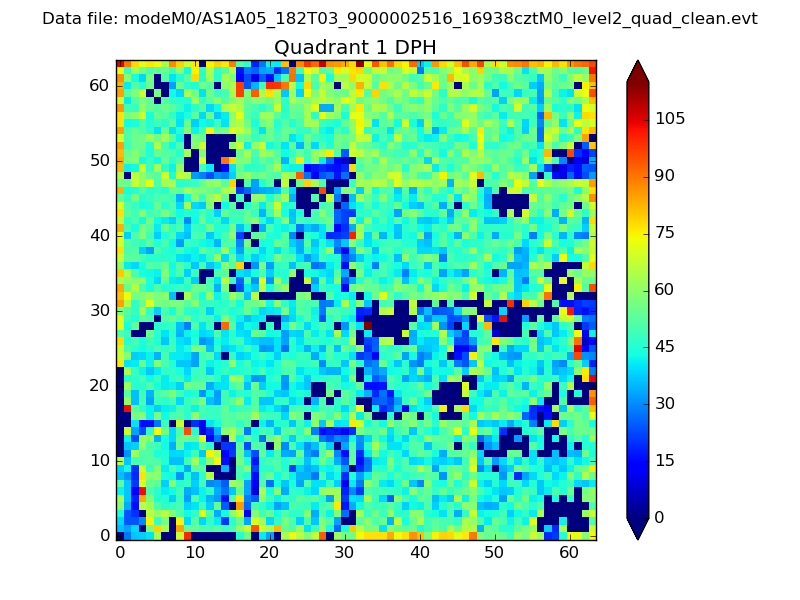
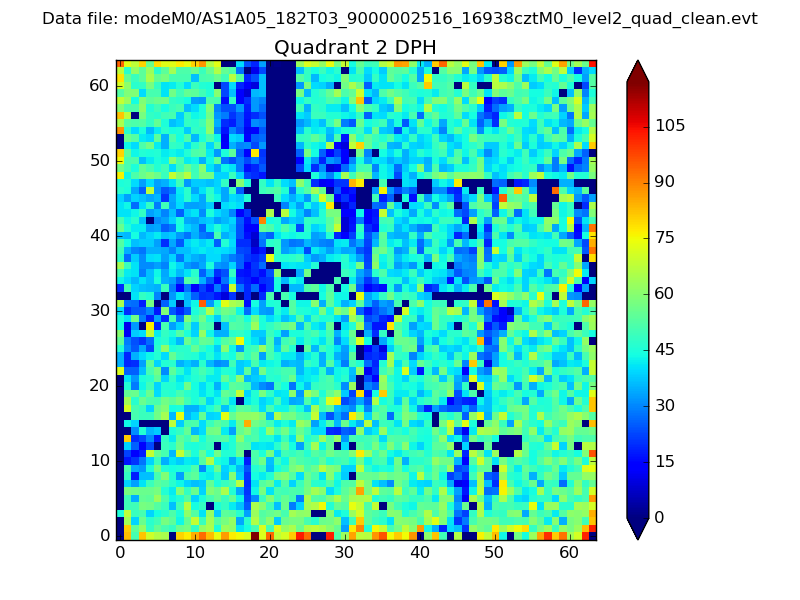
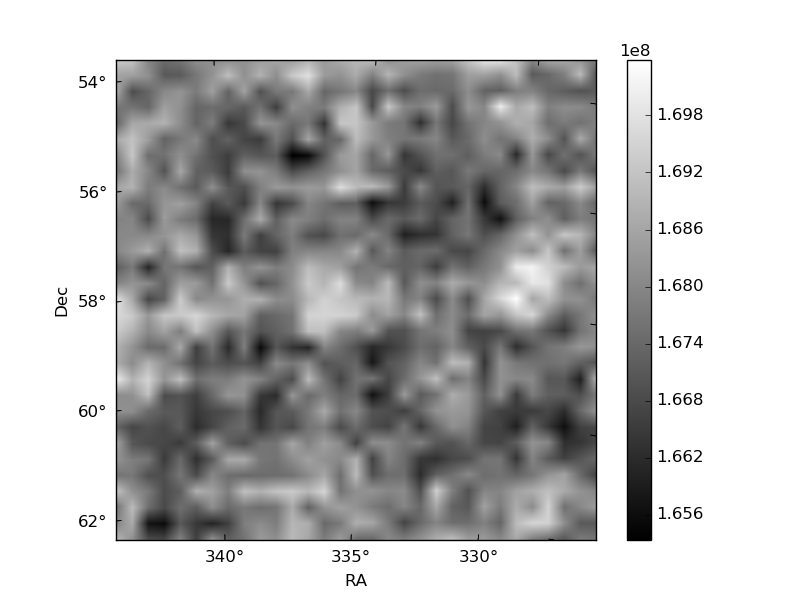
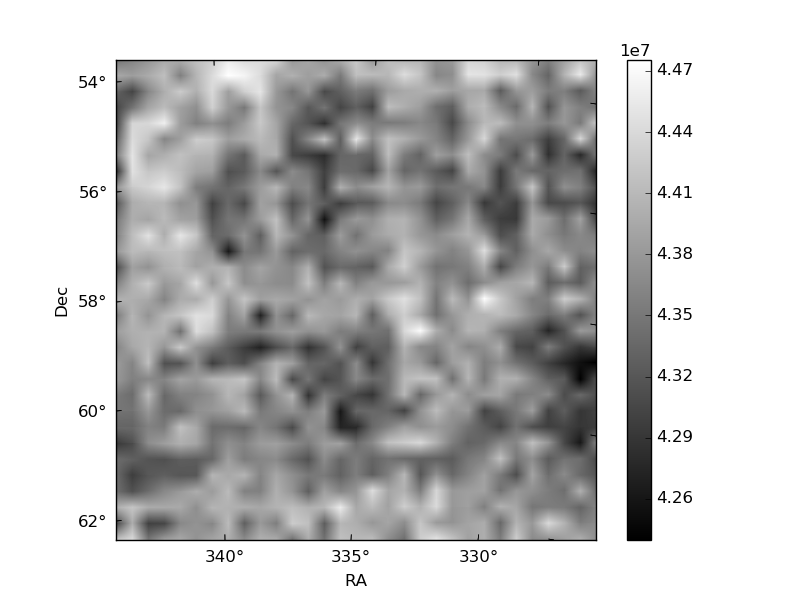
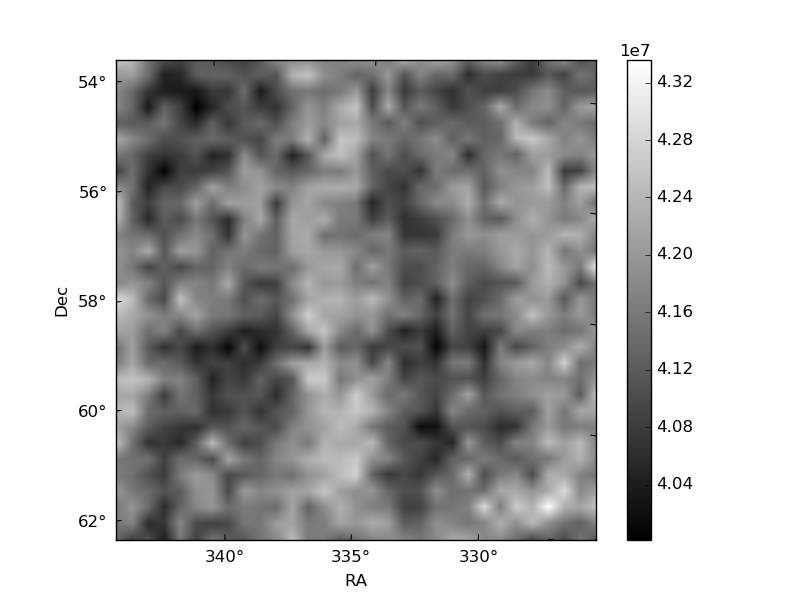
Histogram calculated using DETX and DETY for each event in the final _common_clean file
| Quadrant A | 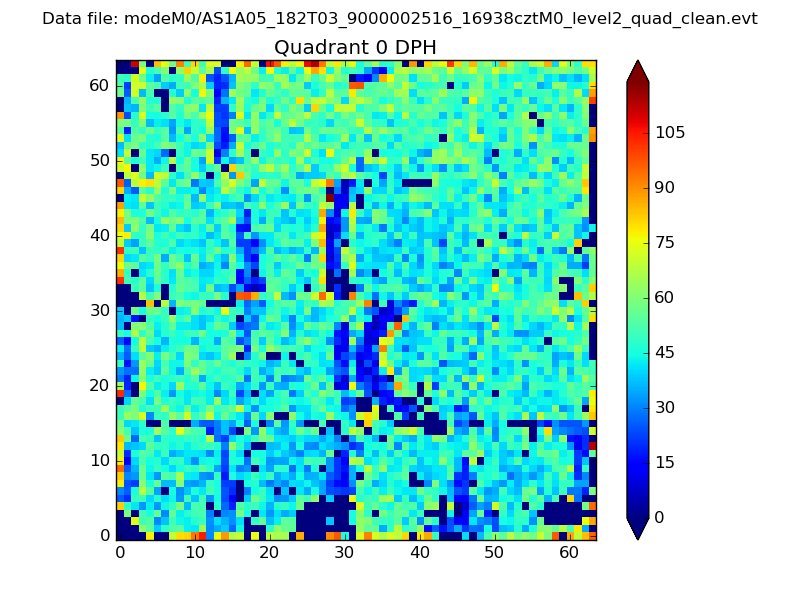 |
 |
Quadrant B |
|---|---|---|---|
| Quadrant D | 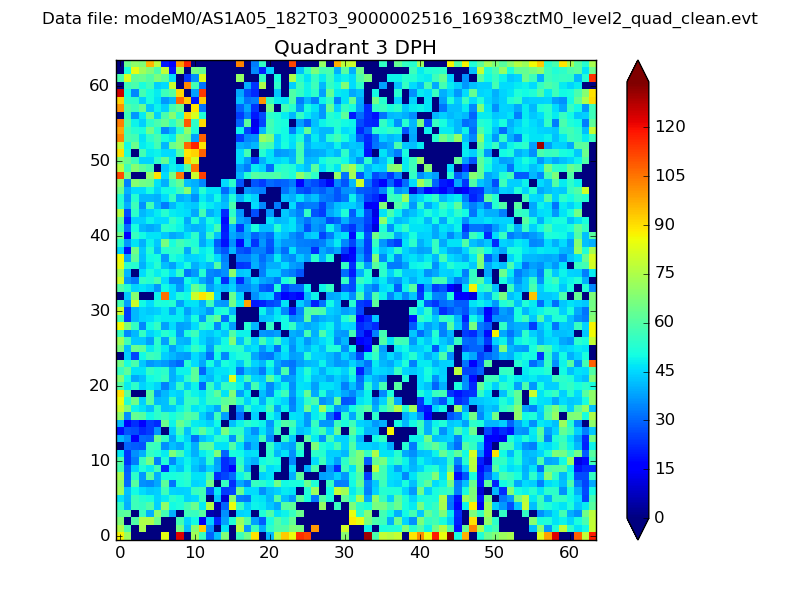 |
 |
Quadrant C |
| Plot type | Count rate plots | Images |
|---|---|---|
| Comparison with Poisson distribution Blue bars denote a histogram of data divided into 1 sec bins. Red curve is a Poisson curve with rate = median count rate of data. |
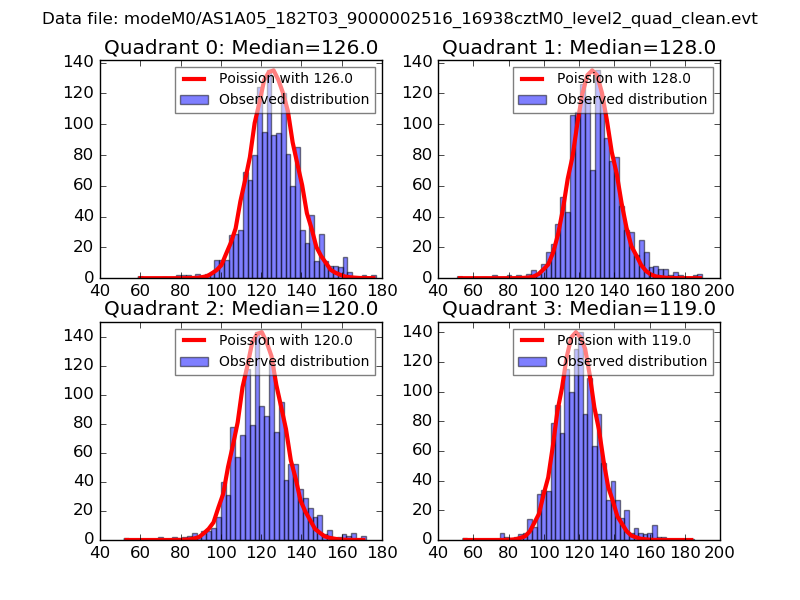 |
 |
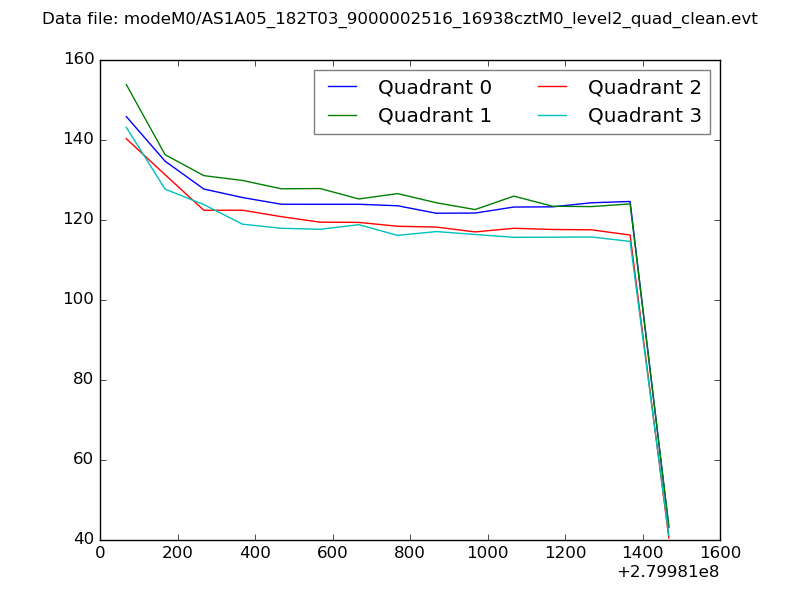
| Quadrant-wise count rates Data is divided into 100 sec bins |
 |
|
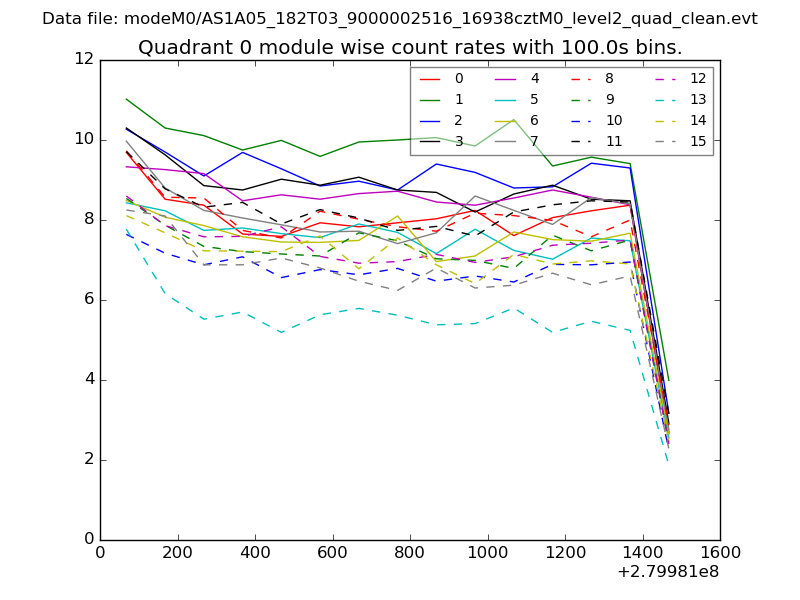
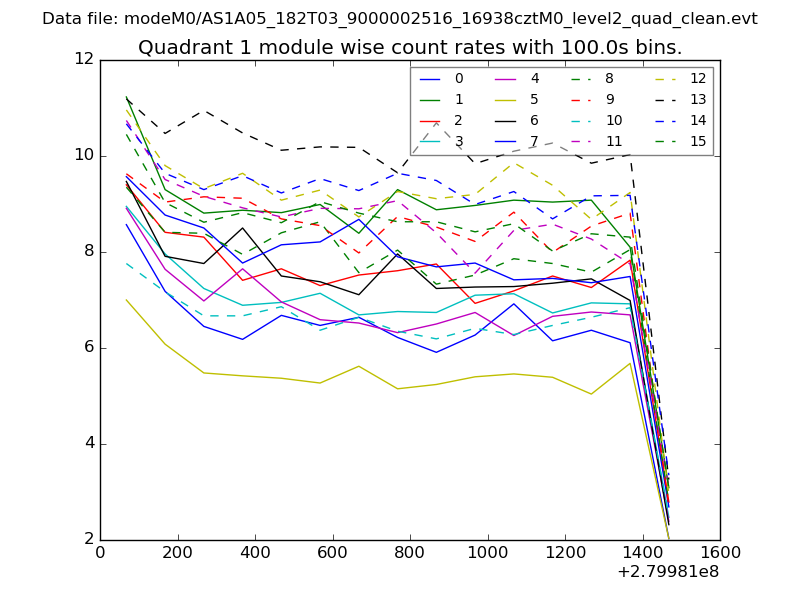
| Module-wise count rates for Quadrant A Data is divided into 100 sec bins |
 |
 |
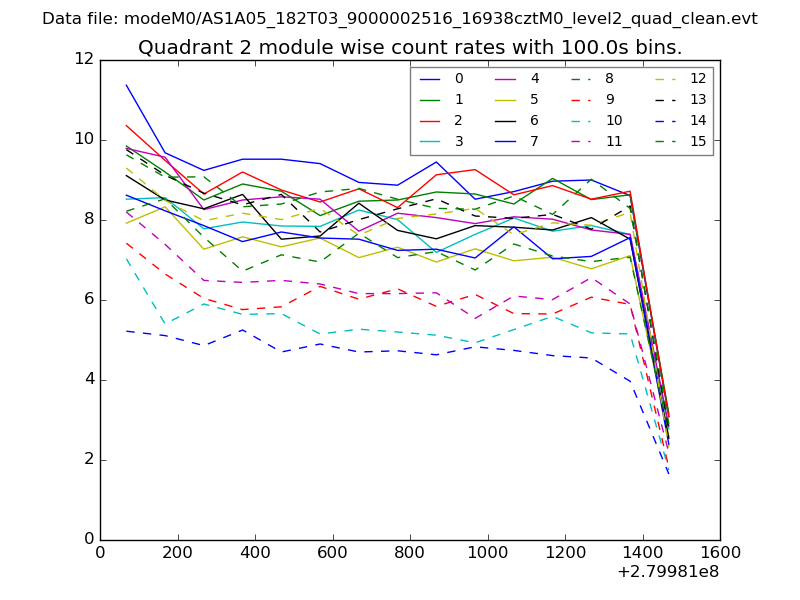
| Module-wise count rates for Quadrant B Data is divided into 100 sec bins |
 |
 |
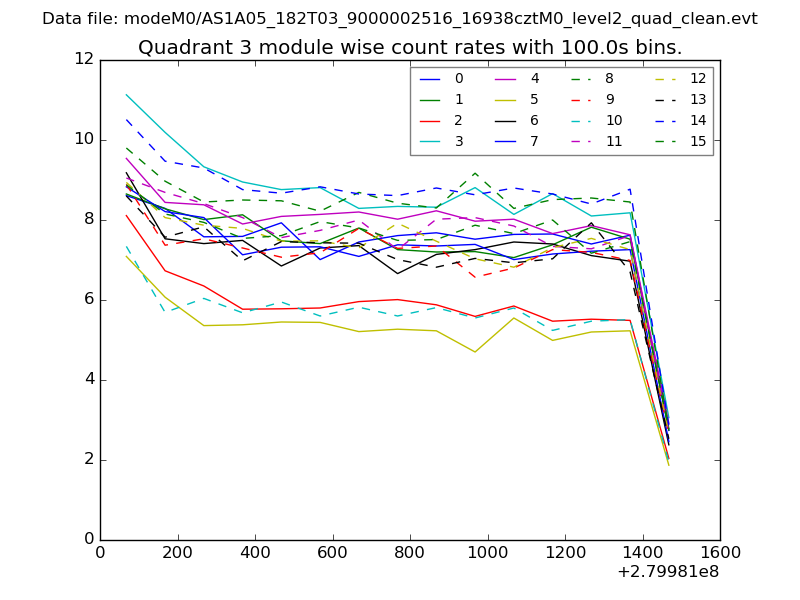
| Module-wise count rates for Quadrant C Data is divided into 100 sec bins |
 |
 |
| Module-wise count rates for Quadrant D Data is divided into 100 sec bins |
 |
 |
| Parameter | Plot |
|---|---|
| CZT HV Monitor | 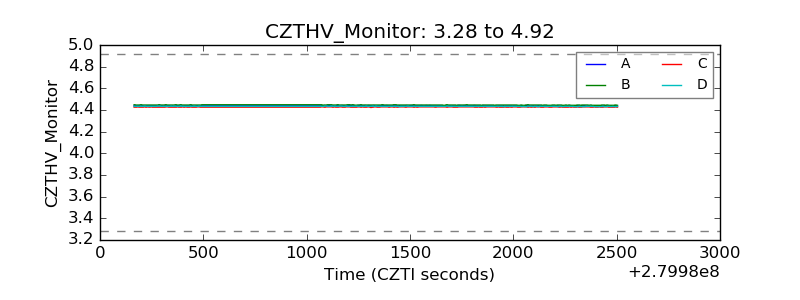 |
| D_VDD | 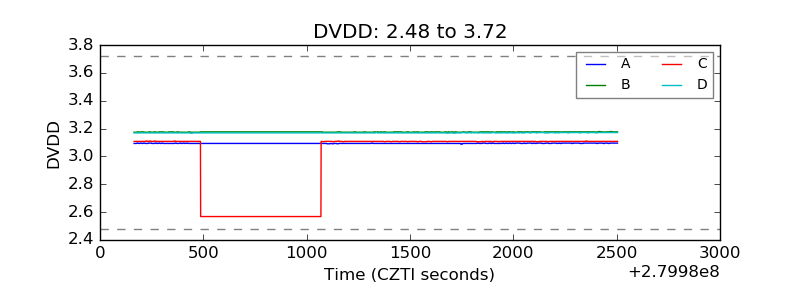 |
| Temperature 1 | 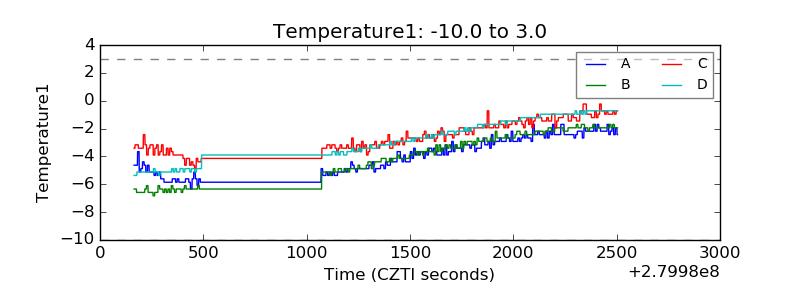 |
| Veto HV Monitor | 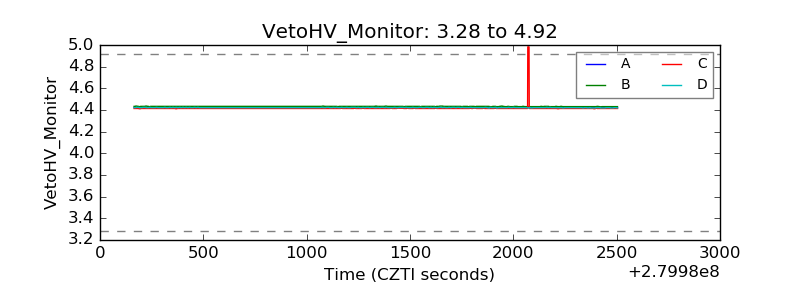 |
| Veto LLD | 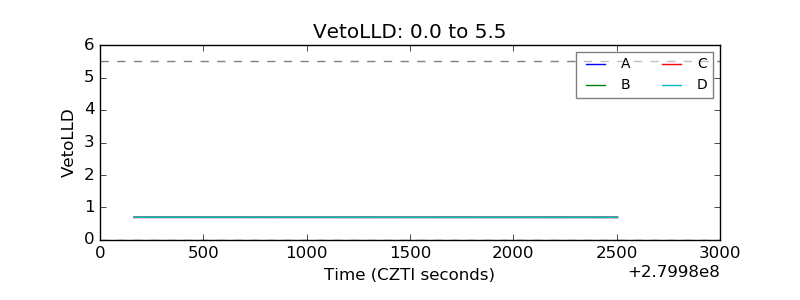 |
| Alpha Counter | 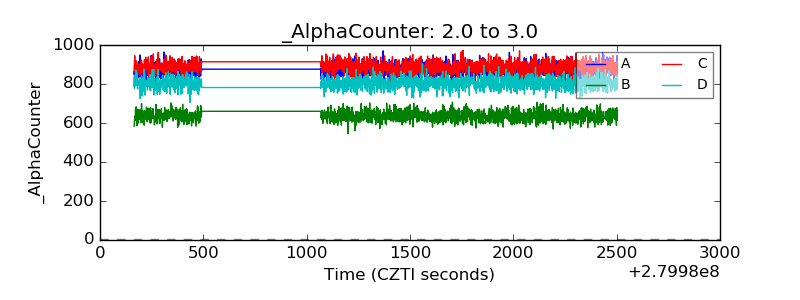 |
| _CPM_Rate | 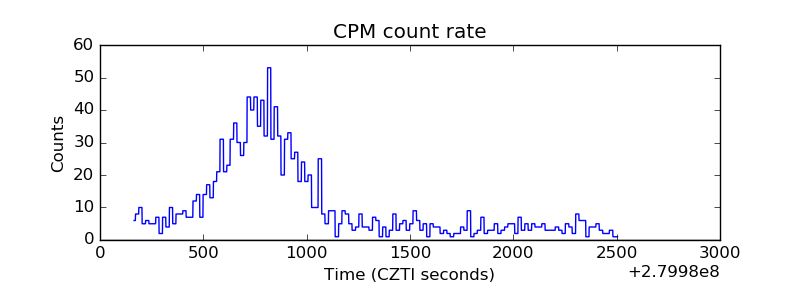 |
| CZT Counter | 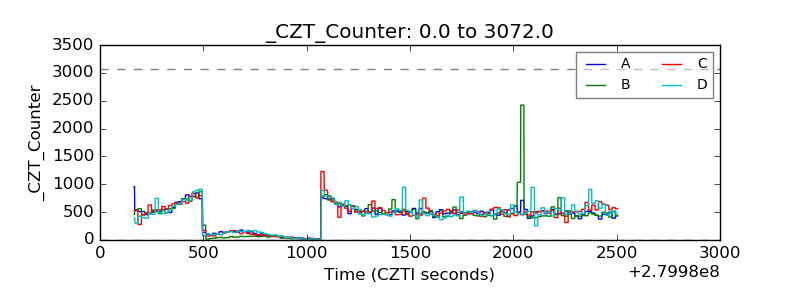 |
| +2.5 Volts monitor |  |
| +5 Volts monitor |  |
| _ROLL_ROT | 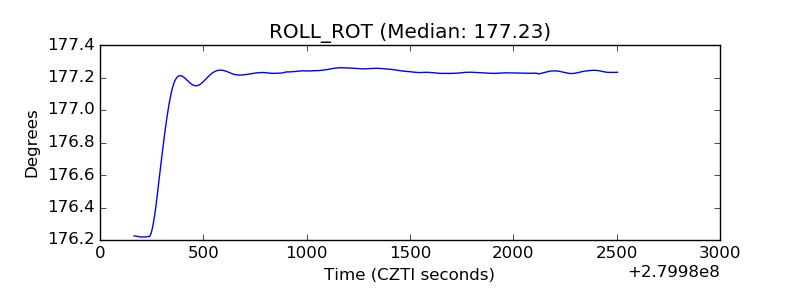 |
| _Roll_DEC | 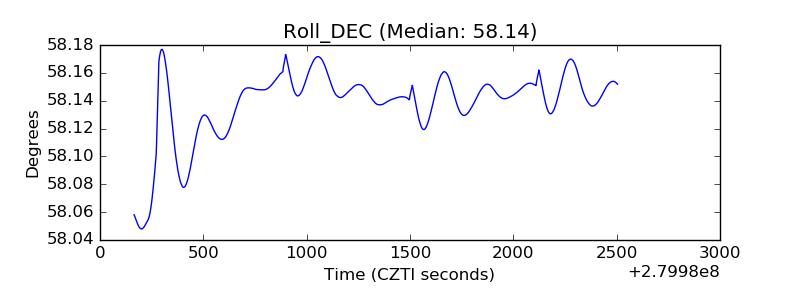 |
| _Roll_RA | 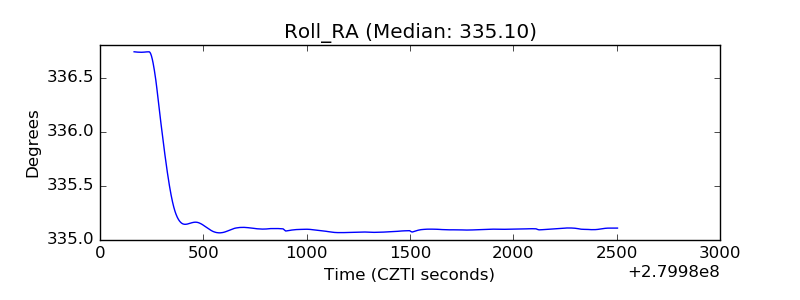 |
| Veto Counter | 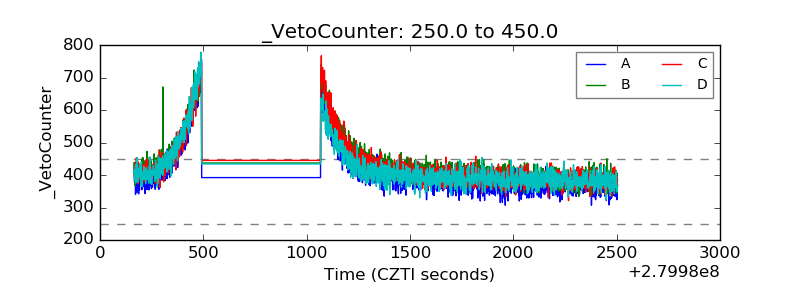 |