| Param | Original file | Final file |
|---|---|---|
| Filename | modeM0/AS1A05_182T03_9000002516_16939cztM0_level2.evt | modeM0/AS1A05_182T03_9000002516_16939cztM0_level2_quad_clean.evt |
| Size (bytes) | 515,995,200 | 101,888,640 |
| Size | 492.1 MB | 97.2 MB |
| Events in quadrant A | 4,098,017 | 662,725 |
| Events in quadrant B | 3,637,288 | 668,841 |
| Events in quadrant C | 3,786,743 | 634,209 |
| Events in quadrant D | 3,625,728 | 628,265 |
| Mode M0 | |||
|---|---|---|---|
| Quadrant | BADHDUFLAG | Total packets | Discarded packets |
| A | 0 | 16957 | 1 |
| B | 0 | 15392 | 1 |
| C | 0 | 15722 | 1 |
| D | 0 | 15430 | 1 |
| Mode M9 | |||
|---|---|---|---|
| Quadrant | BADHDUFLAG | Total packets | Discarded packets |
| A | 0 | 3 | 0 |
| B | 0 | 3 | 0 |
| C | 0 | 3 | 0 |
| D | 0 | 3 | 0 |
| Mode SS | |||
|---|---|---|---|
| Quadrant | BADHDUFLAG | Total packets | Discarded packets |
| A | 0 | 142 | 0 |
| B | 0 | 142 | 0 |
| C | 0 | 142 | 0 |
| D | 0 | 142 | 0 |
| Quadrant | Total seconds | Saturated seconds | Saturation percentage |
|---|---|---|---|
| A | 7061 | 190 | 2.690837% |
| B | 7062 | 137 | 1.939960% |
| C | 7062 | 144 | 2.039082% |
| D | 7062 | 115 | 1.628434% |
Noise dominated data is calculated using 1-second bins in cleaned event files. If a bin has >2000 counts, and if more than 50% of those come from <1% of pixels, then it is considered to be noise-dominated and hence unusable.
| Quadrant | # 1 sec bins | Bins with >0 counts | Bins with >2000 counts | High rate bins dominated by noise | Noise dominated (total time) | Noise dominated (detector-on time) | Marked lightcurve |
|---|---|---|---|---|---|---|---|
| A | 7292 | 7063 | 96 | 96 | 1.32% | 1.36% | 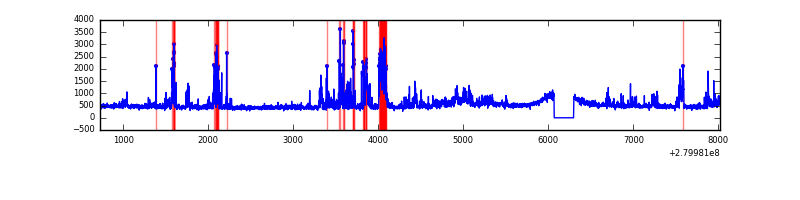 |
| B | 7293 | 7064 | 17 | 17 | 0.23% | 0.24% | 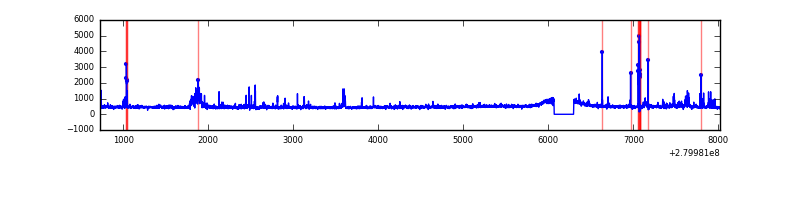 |
| C | 7293 | 7064 | 0 | 0 | 0.00% | 0.00% | 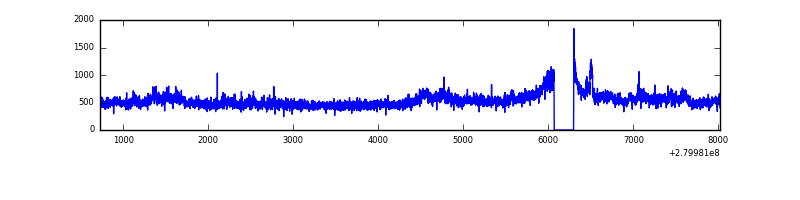 |
| D | 7293 | 7064 | 29 | 29 | 0.40% | 0.41% | 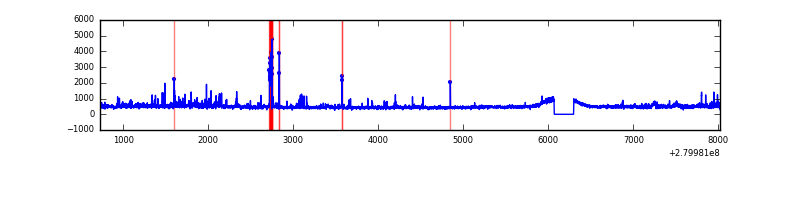 |
Top three noisy pixels from each quadrant. If the there are fewer than three noisy pixels in the level2.evt file, extra rows are filled as -1
| Pixel properties | Quadrant properties | ||||||
|---|---|---|---|---|---|---|---|
| Quadrant | DetID | PixID | Counts | Sigma | Mean | Median | Sigma |
| A | 15 | 174 | 877930 | 5185.85 | 832 | 813 | 169.1 |
| A | 0 | 23 | 20513 | 116.47 | 832 | 813 | 169.1 |
| A | 0 | 226 | 8404 | 44.88 | 832 | 813 | 169.1 |
| B | 15 | 35 | 142849 | 887.25 | 828 | 804 | 160.1 |
| B | 10 | 16 | 63408 | 391.04 | 828 | 804 | 160.1 |
| B | 0 | 197 | 57348 | 353.19 | 828 | 804 | 160.1 |
| C | 3 | 233 | 554775 | 2952.02 | 797 | 800 | 187.7 |
| C | 14 | 238 | 123282 | 652.68 | 797 | 800 | 187.7 |
| C | 13 | 61 | 5782 | 26.55 | 797 | 800 | 187.7 |
| D | 1 | 52 | 340707 | 1721.9 | 814 | 790 | 197.4 |
| D | 10 | 199 | 116218 | 584.72 | 814 | 790 | 197.4 |
| D | 2 | 152 | 32603 | 161.15 | 814 | 790 | 197.4 |
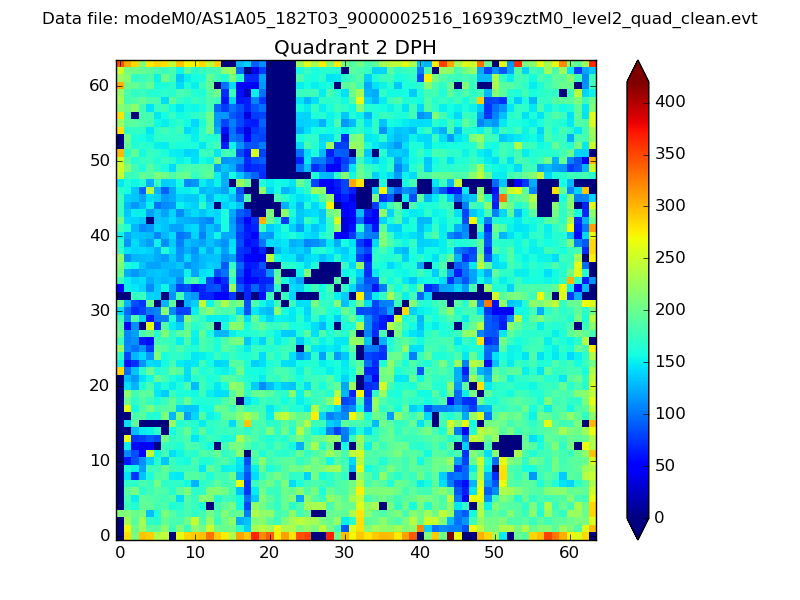
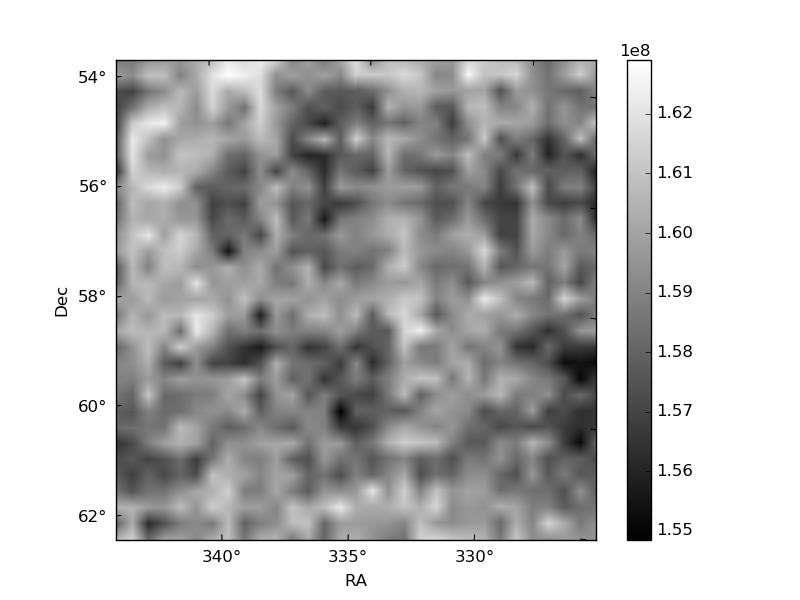
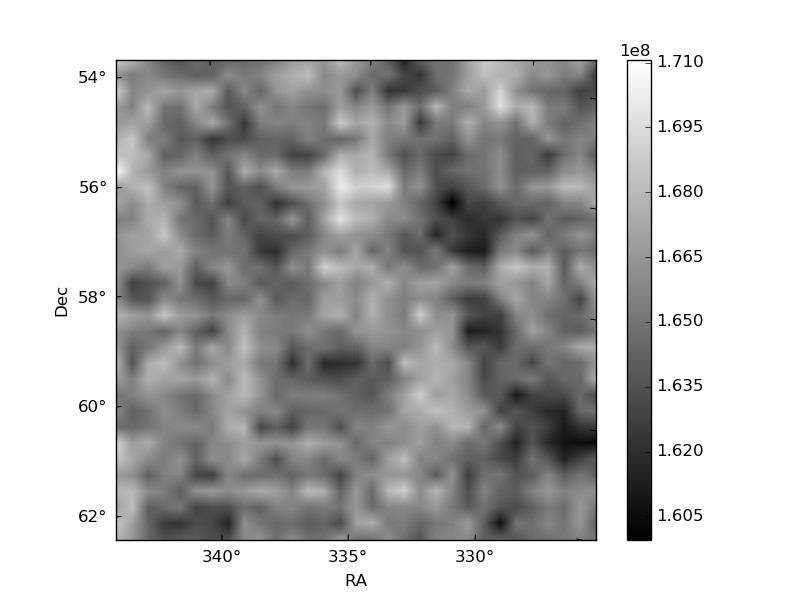
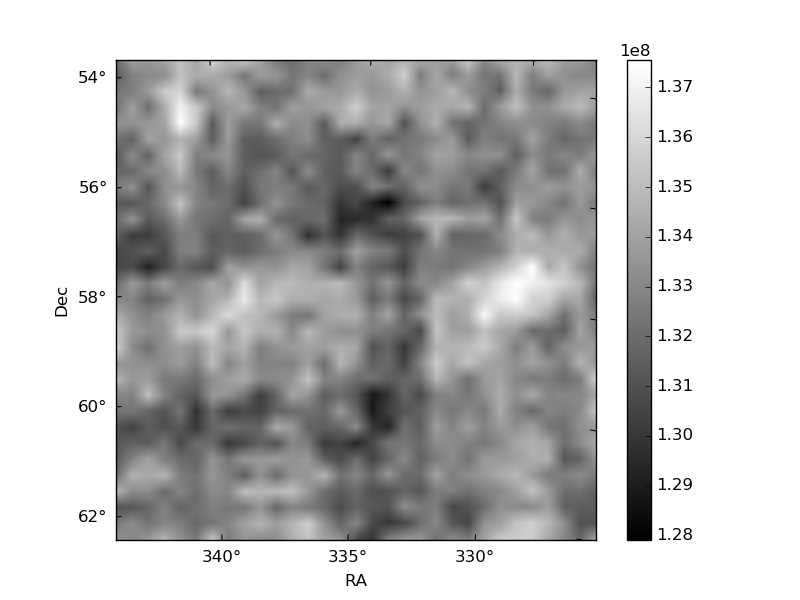
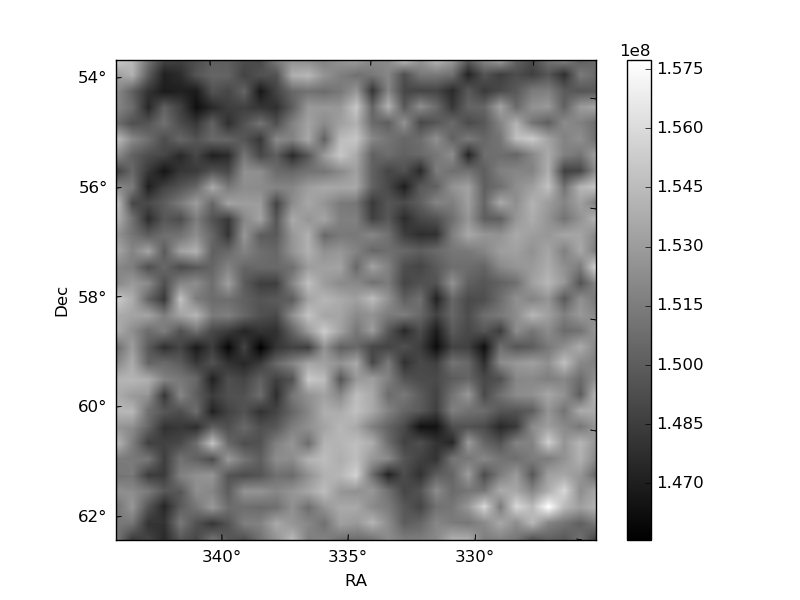
Histogram calculated using DETX and DETY for each event in the final _common_clean file
| Quadrant A | 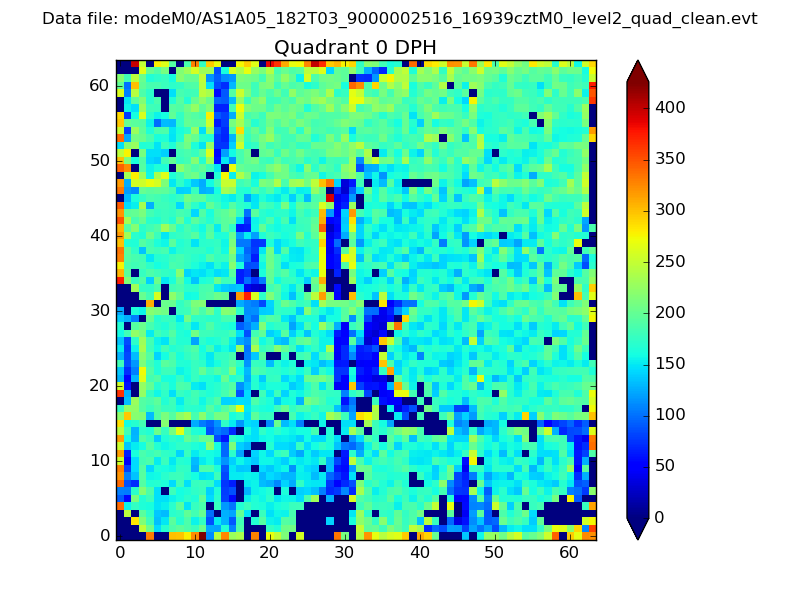 |
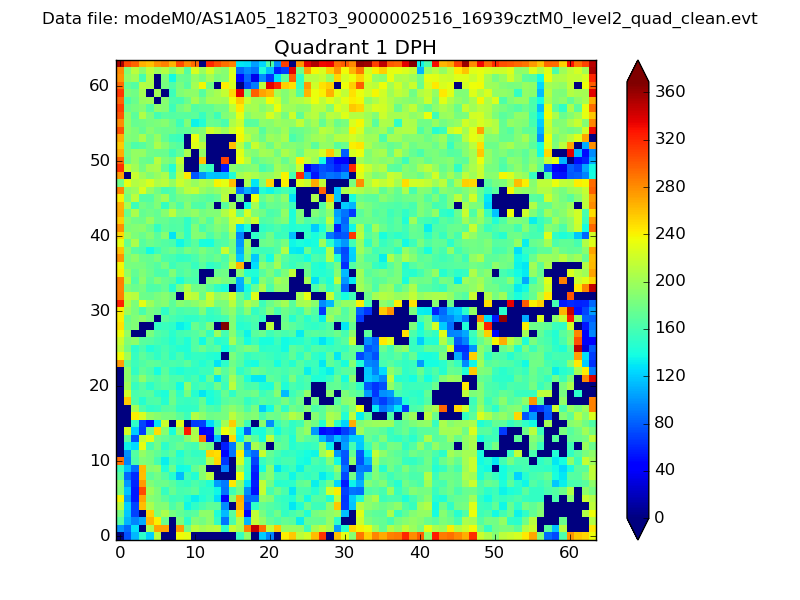 |
Quadrant B |
|---|---|---|---|
| Quadrant D | 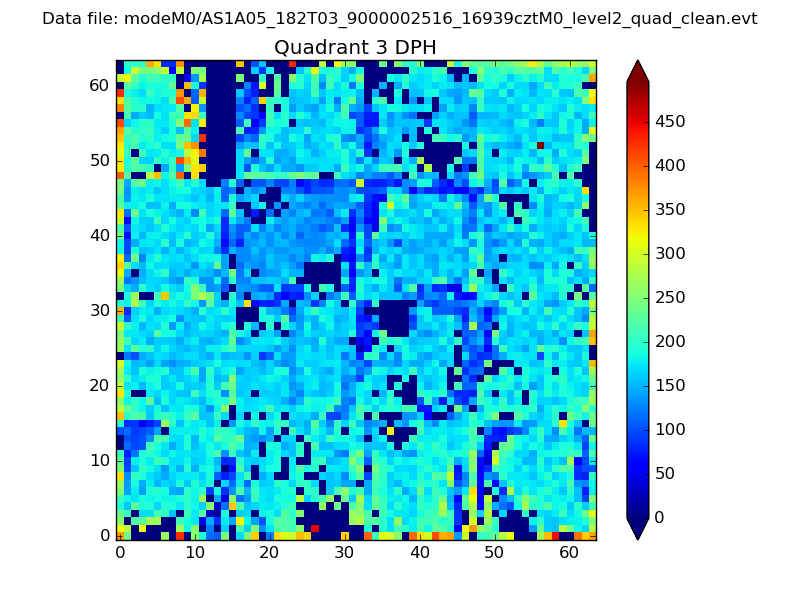 |
 |
Quadrant C |
| Plot type | Count rate plots | Images |
|---|---|---|
| Comparison with Poisson distribution Blue bars denote a histogram of data divided into 1 sec bins. Red curve is a Poisson curve with rate = median count rate of data. |
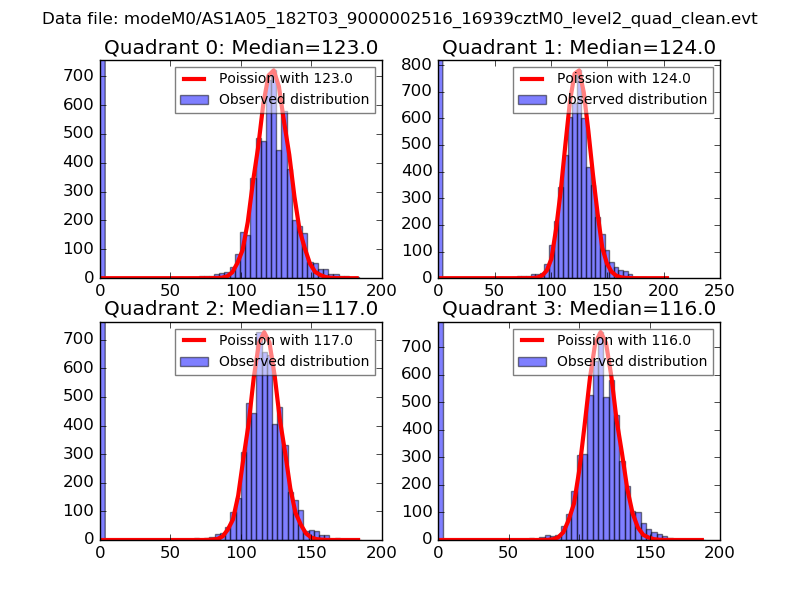 |
 |
| Quadrant-wise count rates Data is divided into 100 sec bins |
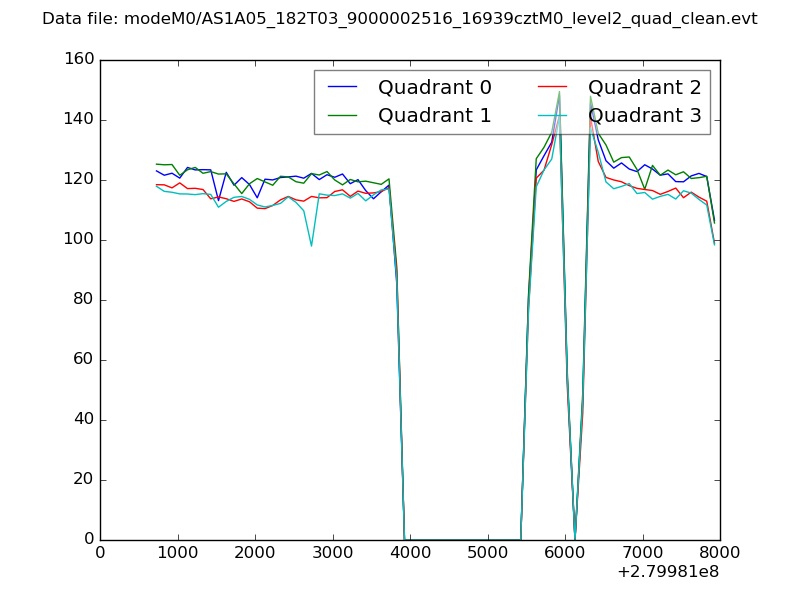 |
|
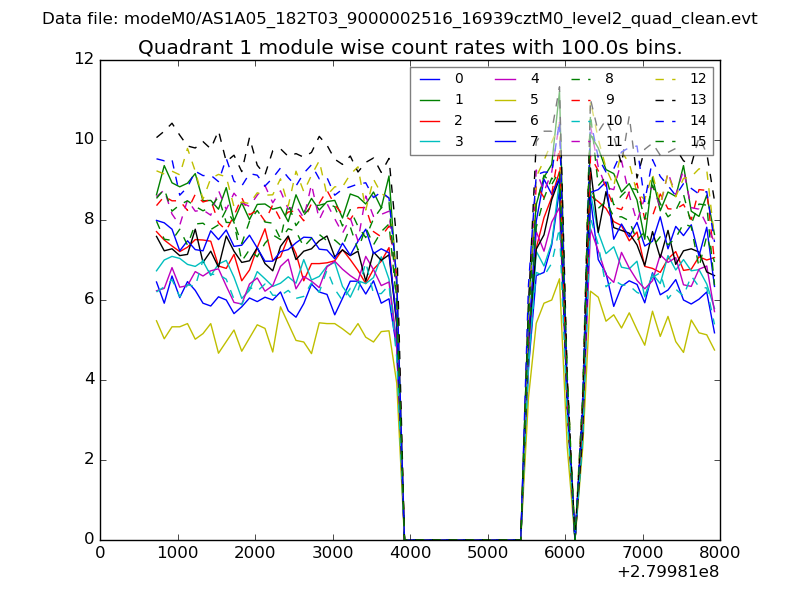
| Module-wise count rates for Quadrant A Data is divided into 100 sec bins |
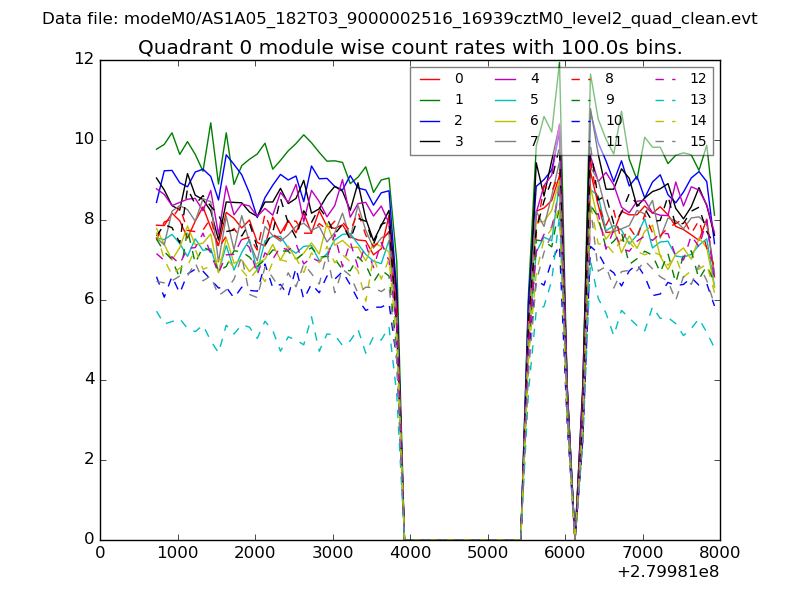 |
 |
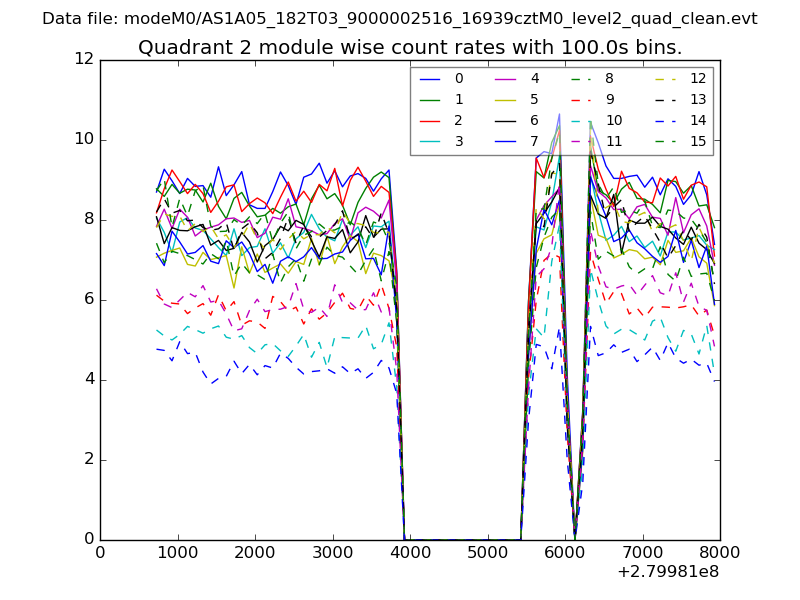
| Module-wise count rates for Quadrant B Data is divided into 100 sec bins |
 |
 |
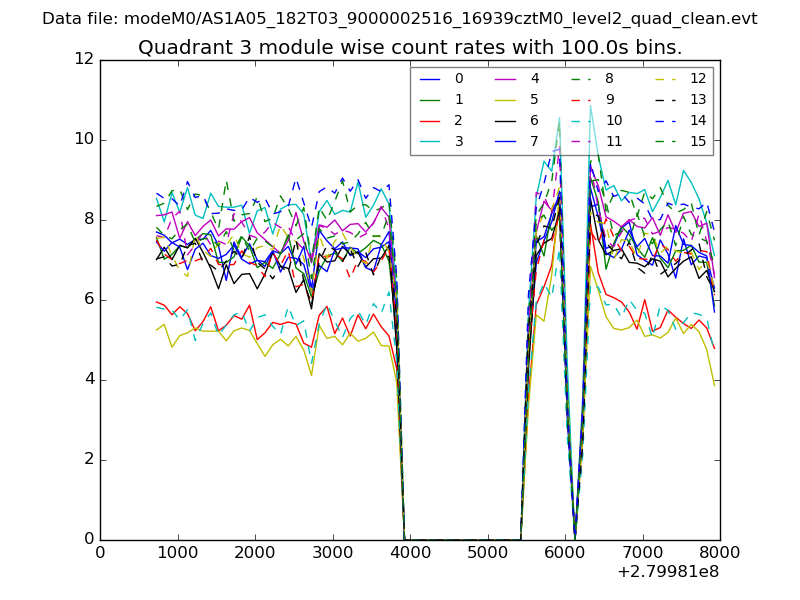
| Module-wise count rates for Quadrant C Data is divided into 100 sec bins |
 |
 |
| Module-wise count rates for Quadrant D Data is divided into 100 sec bins |
 |
 |
| Parameter | Plot |
|---|---|
| CZT HV Monitor | 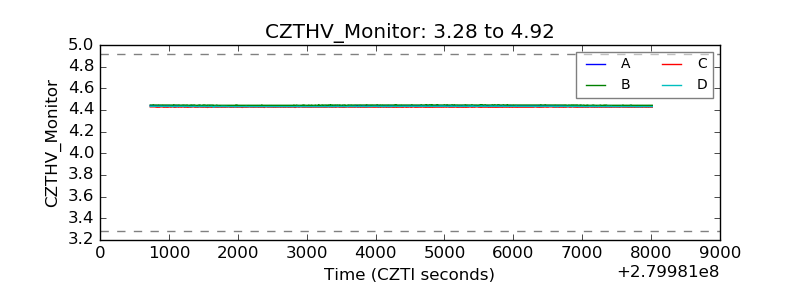 |
| D_VDD |  |
| Temperature 1 | 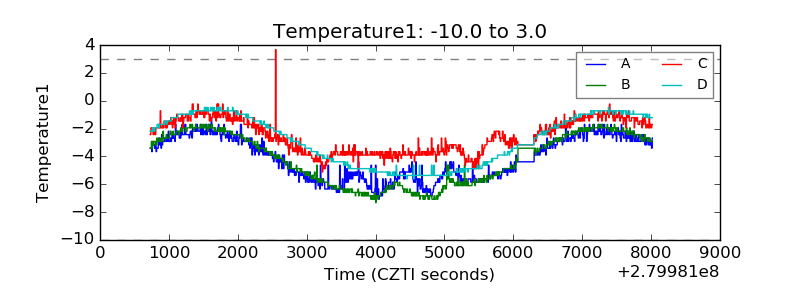 |
| Veto HV Monitor |  |
| Veto LLD | 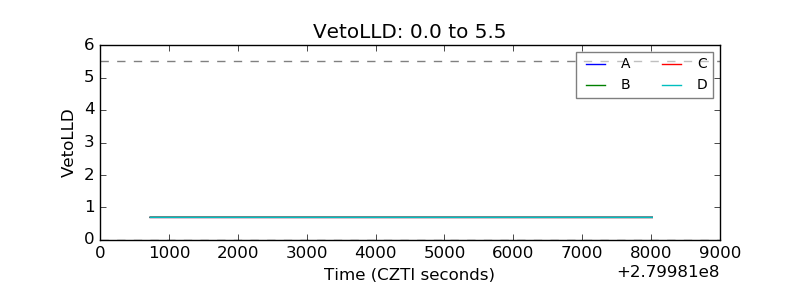 |
| Alpha Counter | 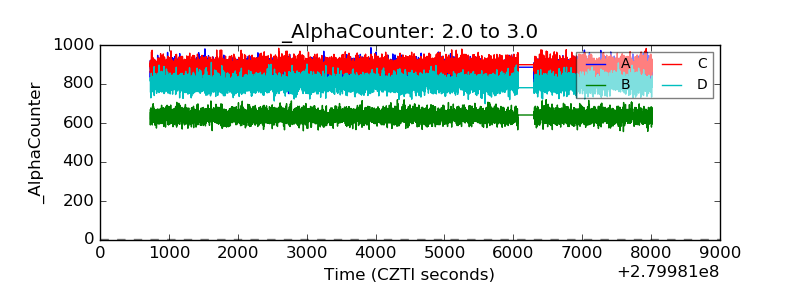 |
| _CPM_Rate | 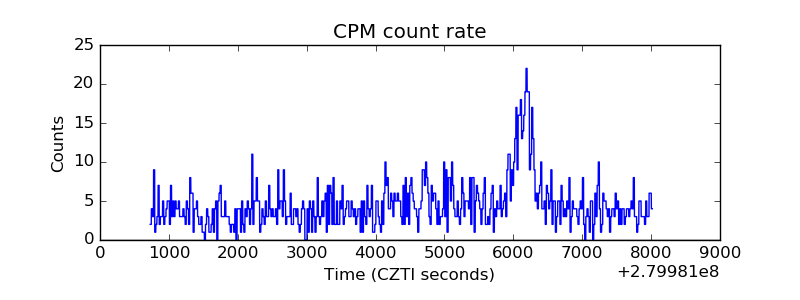 |
| CZT Counter | 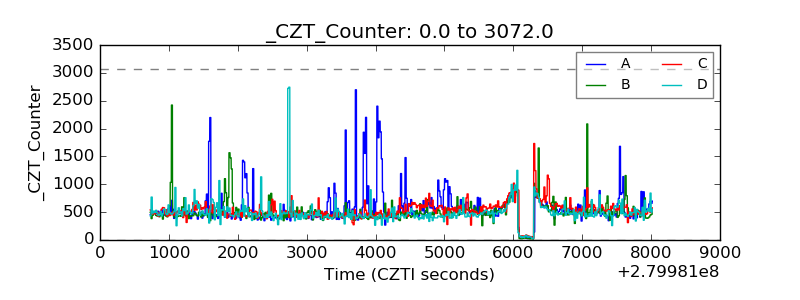 |
| +2.5 Volts monitor |  |
| +5 Volts monitor | 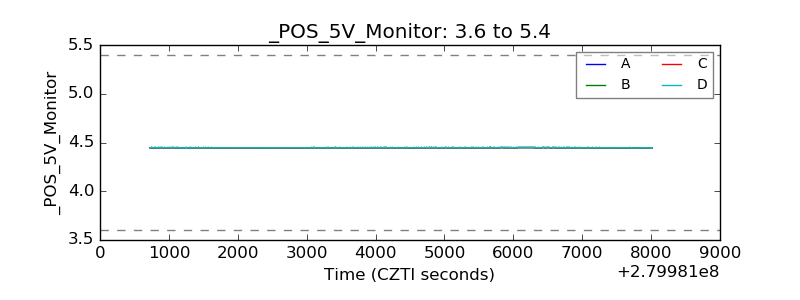 |
| _ROLL_ROT | 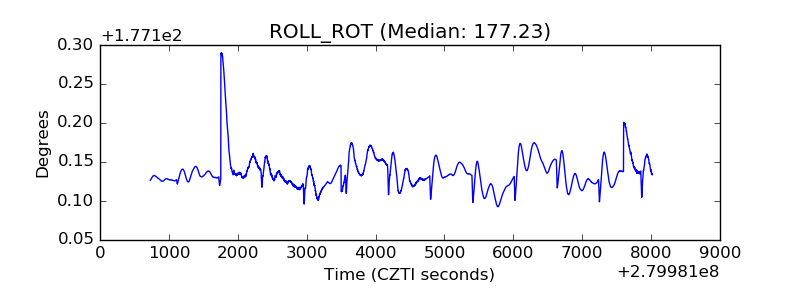 |
| _Roll_DEC | 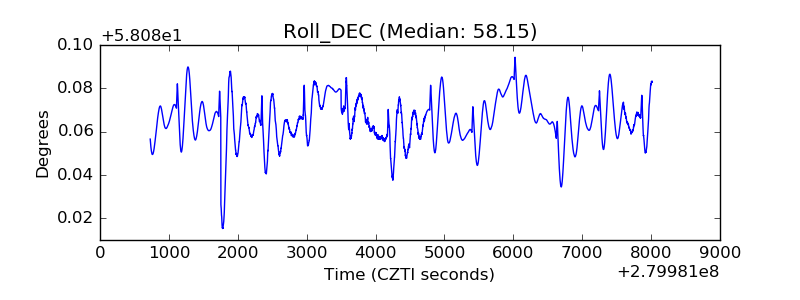 |
| _Roll_RA |  |
| Veto Counter | 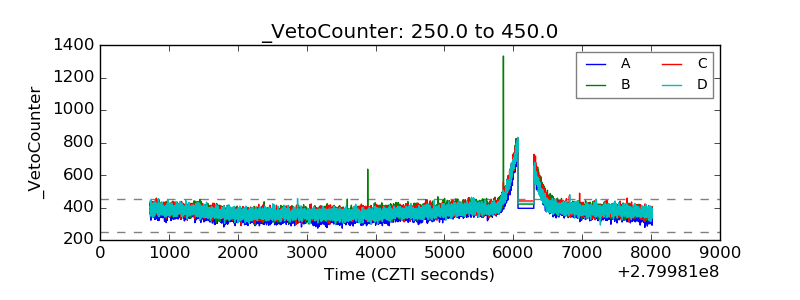 |