| Param | Original file | Final file |
|---|---|---|
| Filename | modeM0/AS1A05_182T03_9000002516_16940cztM0_level2.evt | modeM0/AS1A05_182T03_9000002516_16940cztM0_level2_quad_clean.evt |
| Size (bytes) | 202,613,760 | 48,850,560 |
| Size | 193.2 MB | 46.6 MB |
| Events in quadrant A | 1,706,887 | 327,691 |
| Events in quadrant B | 1,430,470 | 331,688 |
| Events in quadrant C | 1,466,496 | 312,925 |
| Events in quadrant D | 1,345,532 | 312,183 |
| Mode M0 | |||
|---|---|---|---|
| Quadrant | BADHDUFLAG | Total packets | Discarded packets |
| A | 0 | 6914 | 0 |
| B | 0 | 6049 | 0 |
| C | 0 | 6129 | 0 |
| D | 0 | 5781 | 0 |
| Mode SS | |||
|---|---|---|---|
| Quadrant | BADHDUFLAG | Total packets | Discarded packets |
| A | 0 | 54 | 0 |
| B | 0 | 54 | 0 |
| C | 0 | 54 | 0 |
| D | 0 | 54 | 0 |
| Quadrant | Total seconds | Saturated seconds | Saturation percentage |
|---|---|---|---|
| A | 2719 | 9 | 0.331004% |
| B | 2720 | 28 | 1.029412% |
| C | 2720 | 17 | 0.625000% |
| D | 2720 | 7 | 0.257353% |
Noise dominated data is calculated using 1-second bins in cleaned event files. If a bin has >2000 counts, and if more than 50% of those come from <1% of pixels, then it is considered to be noise-dominated and hence unusable.
| Quadrant | # 1 sec bins | Bins with >0 counts | Bins with >2000 counts | High rate bins dominated by noise | Noise dominated (total time) | Noise dominated (detector-on time) | Marked lightcurve |
|---|---|---|---|---|---|---|---|
| A | 2720 | 2720 | 5 | 5 | 0.18% | 0.18% |  |
| B | 2721 | 2721 | 14 | 14 | 0.51% | 0.51% | 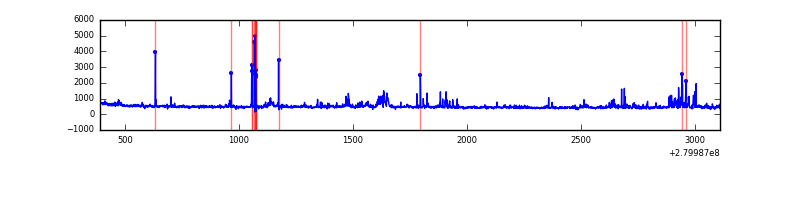 |
| C | 2721 | 2721 | 0 | 0 | 0.00% | 0.00% | 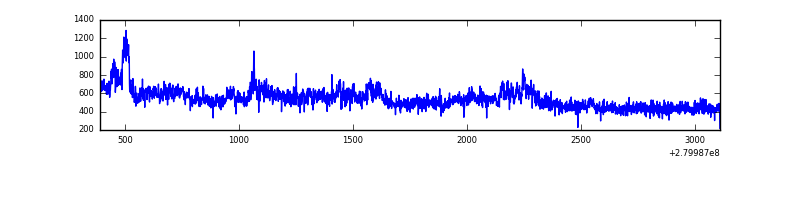 |
| D | 2721 | 2721 | 5 | 5 | 0.18% | 0.18% | 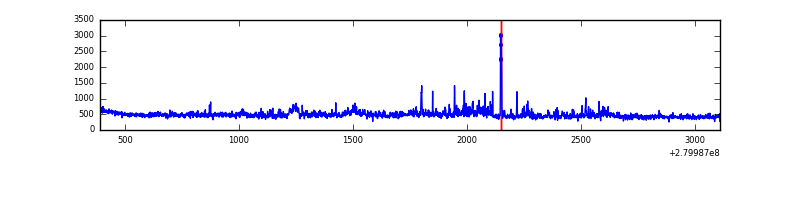 |
Top three noisy pixels from each quadrant. If the there are fewer than three noisy pixels in the level2.evt file, extra rows are filled as -1
| Pixel properties | Quadrant properties | ||||||
|---|---|---|---|---|---|---|---|
| Quadrant | DetID | PixID | Counts | Sigma | Mean | Median | Sigma |
| A | 15 | 174 | 503392 | 7848.72 | 310 | 303 | 64.1 |
| A | 13 | 210 | 8590 | 129.29 | 310 | 303 | 64.1 |
| A | 0 | 226 | 2817 | 39.22 | 310 | 303 | 64.1 |
| B | 10 | 16 | 114265 | 1890.69 | 305 | 297 | 60.3 |
| B | 15 | 35 | 32831 | 539.73 | 305 | 297 | 60.3 |
| B | 0 | 197 | 28513 | 468.09 | 305 | 297 | 60.3 |
| C | 3 | 233 | 273340 | 3900.45 | 294 | 295 | 70.0 |
| C | 14 | 238 | 45579 | 646.88 | 294 | 295 | 70.0 |
| C | 13 | 61 | 2138 | 26.33 | 294 | 295 | 70.0 |
| D | 1 | 52 | 136955 | 1832.1 | 303 | 294 | 74.6 |
| D | 2 | 152 | 18508 | 244.18 | 303 | 294 | 74.6 |
| D | 4 | 239 | 11715 | 153.11 | 303 | 294 | 74.6 |
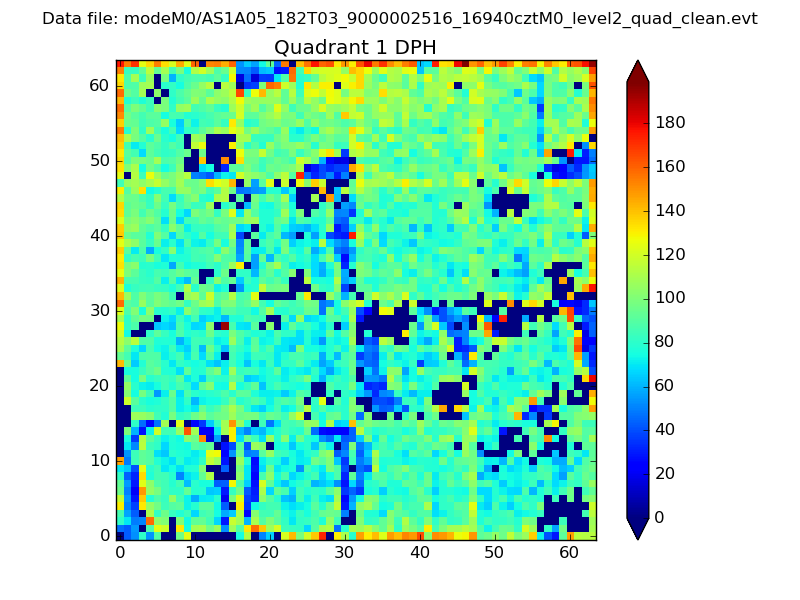
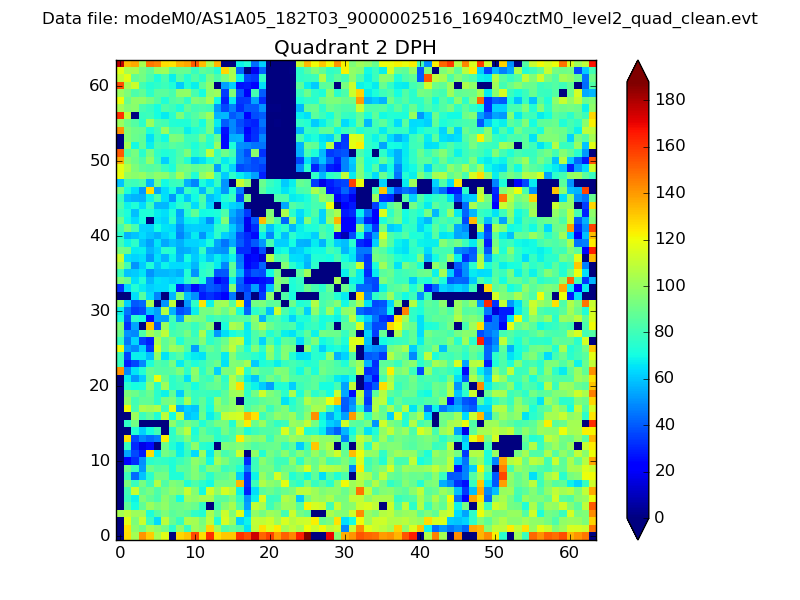
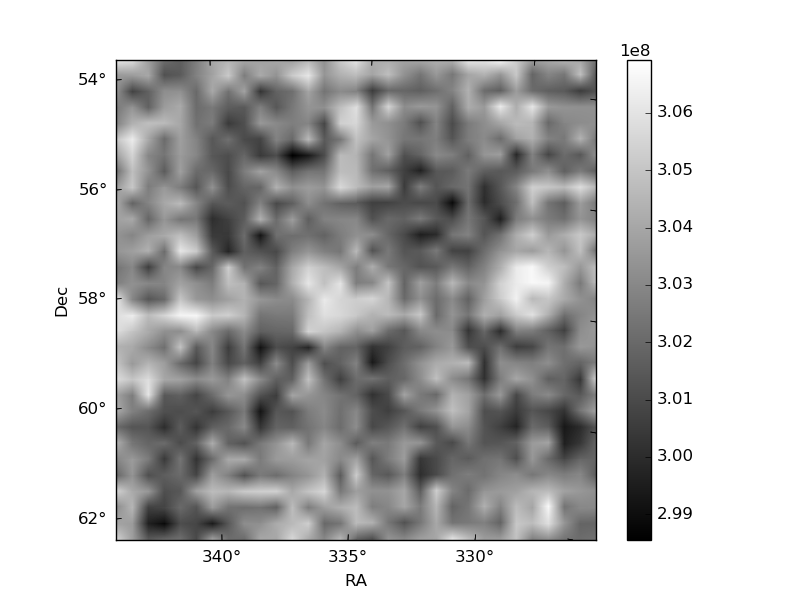
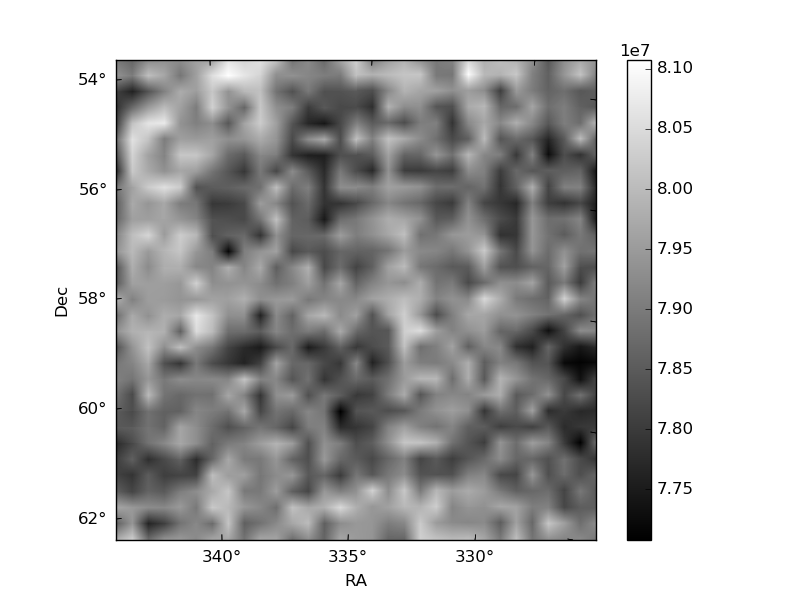
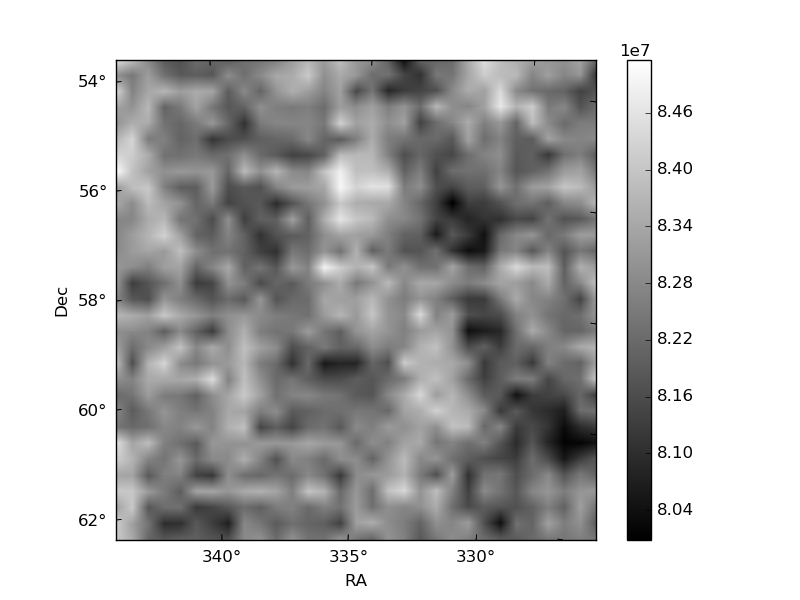
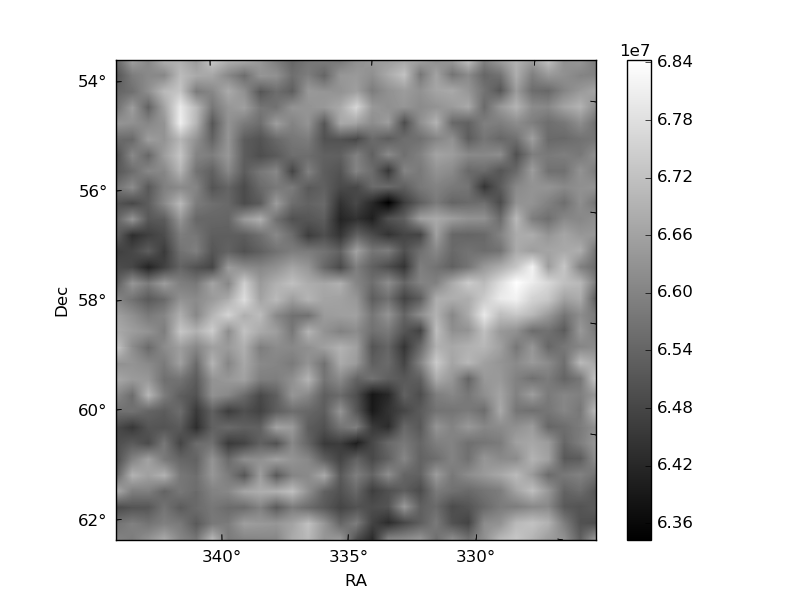
Histogram calculated using DETX and DETY for each event in the final _common_clean file
| Quadrant A | 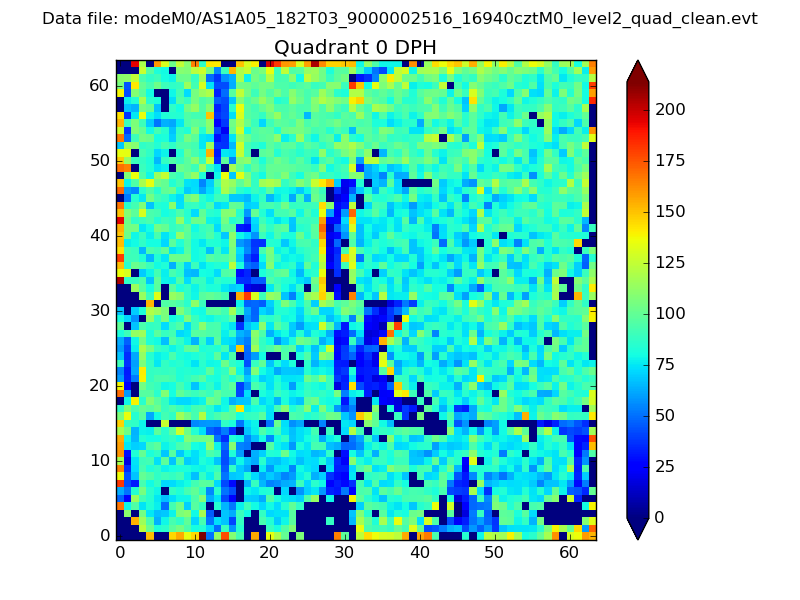 |
 |
Quadrant B |
|---|---|---|---|
| Quadrant D | 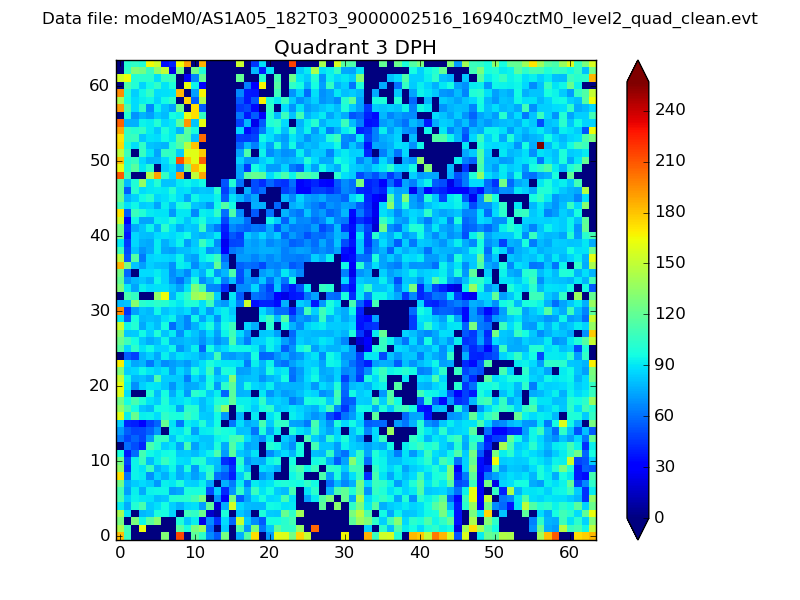 |
 |
Quadrant C |
| Plot type | Count rate plots | Images |
|---|---|---|
| Comparison with Poisson distribution Blue bars denote a histogram of data divided into 1 sec bins. Red curve is a Poisson curve with rate = median count rate of data. |
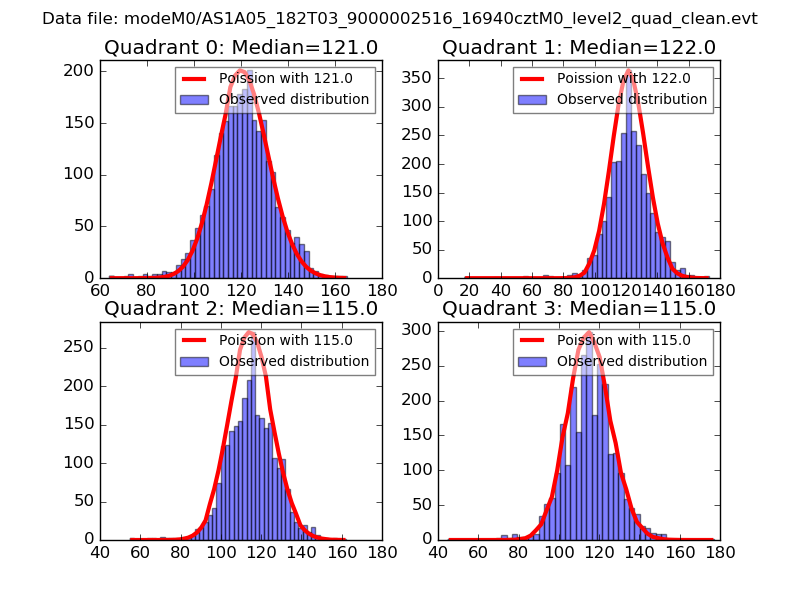 |
 |
| Quadrant-wise count rates Data is divided into 100 sec bins |
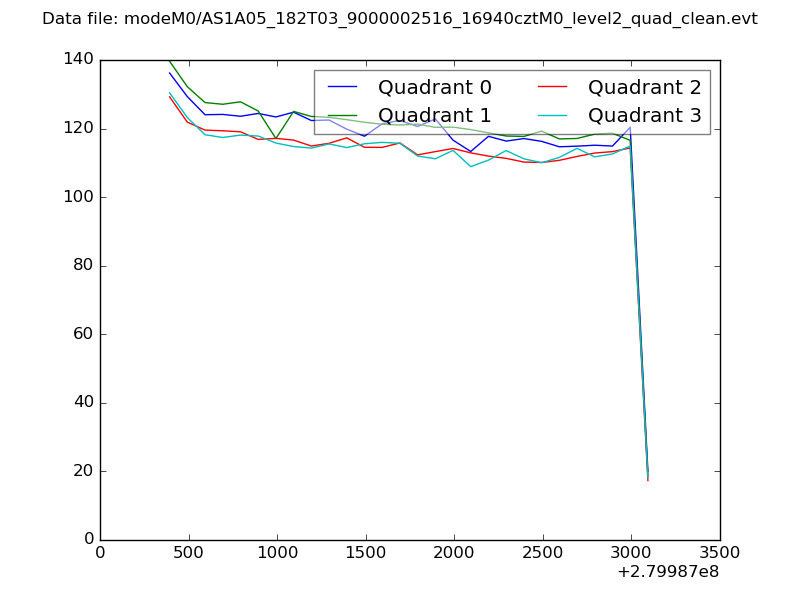 |
|
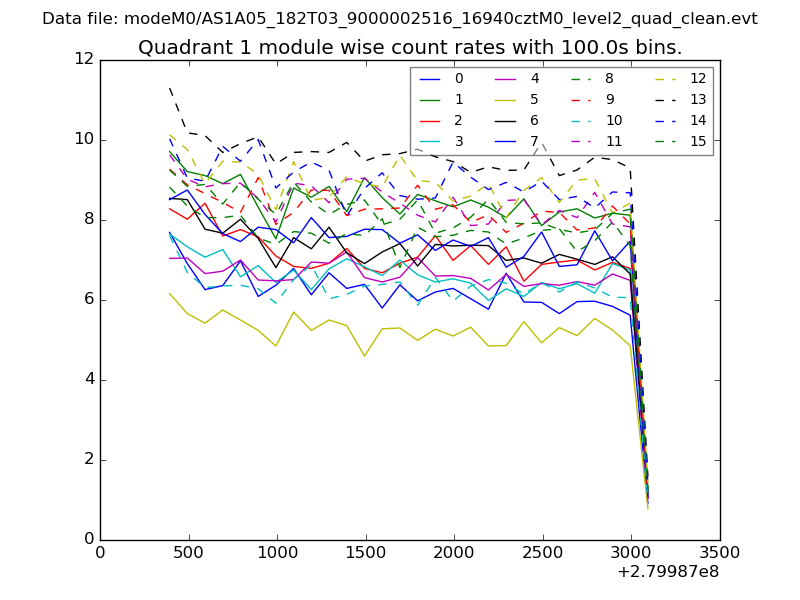
| Module-wise count rates for Quadrant A Data is divided into 100 sec bins |
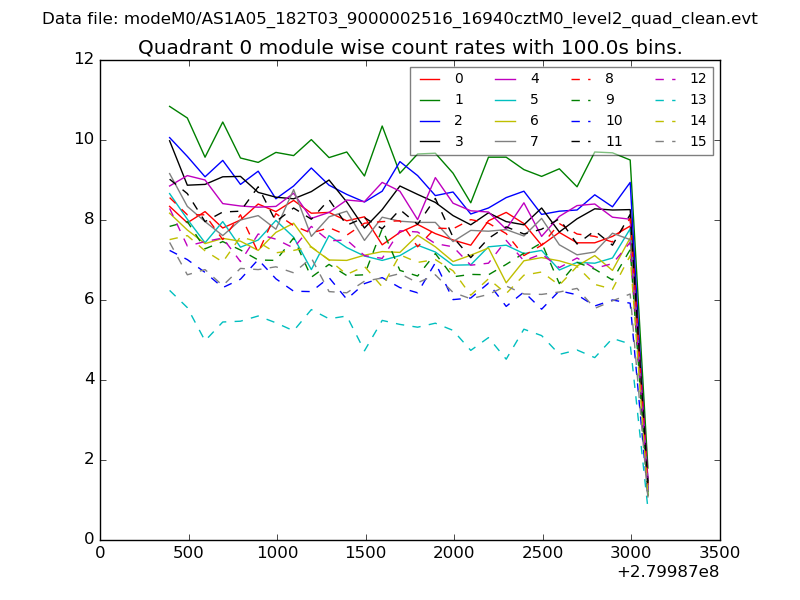 |
 |
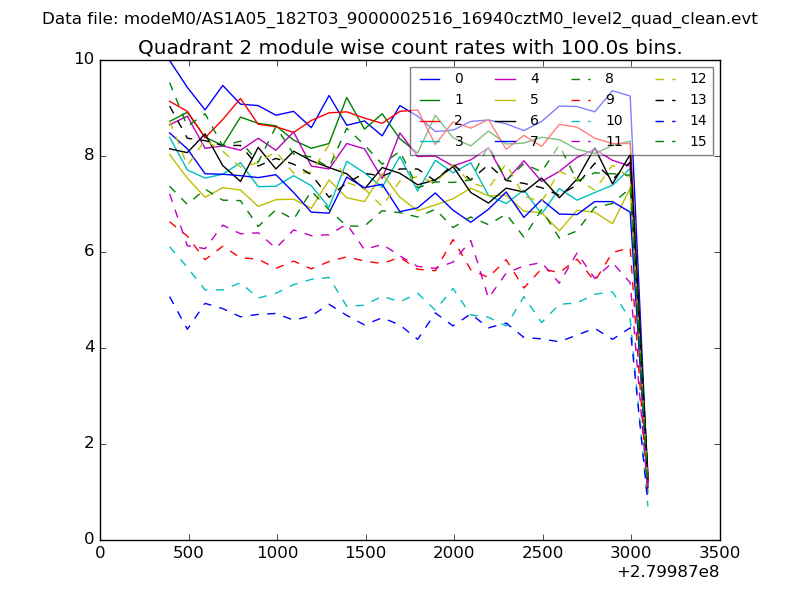
| Module-wise count rates for Quadrant B Data is divided into 100 sec bins |
 |
 |
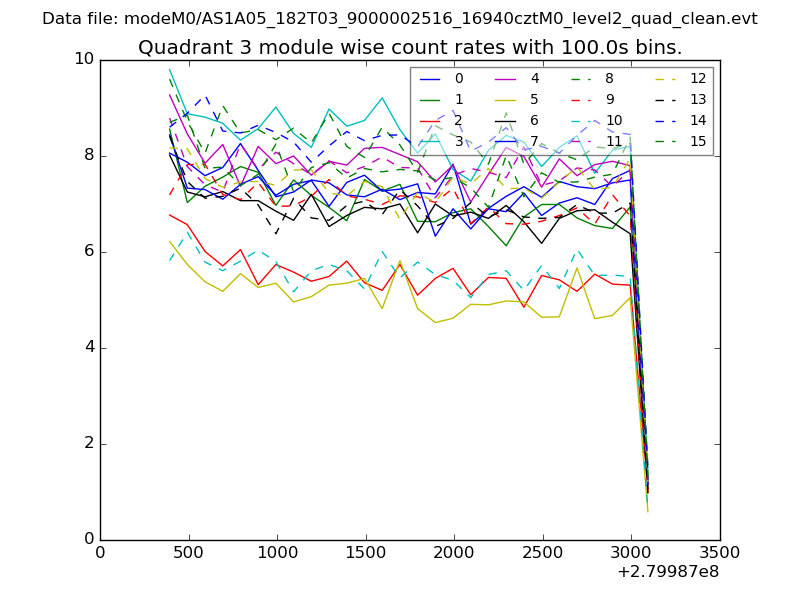
| Module-wise count rates for Quadrant C Data is divided into 100 sec bins |
 |
 |
| Module-wise count rates for Quadrant D Data is divided into 100 sec bins |
 |
 |
| Parameter | Plot |
|---|---|
| CZT HV Monitor | 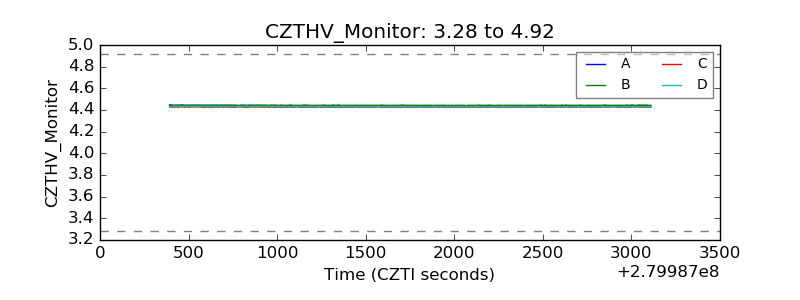 |
| D_VDD |  |
| Temperature 1 | 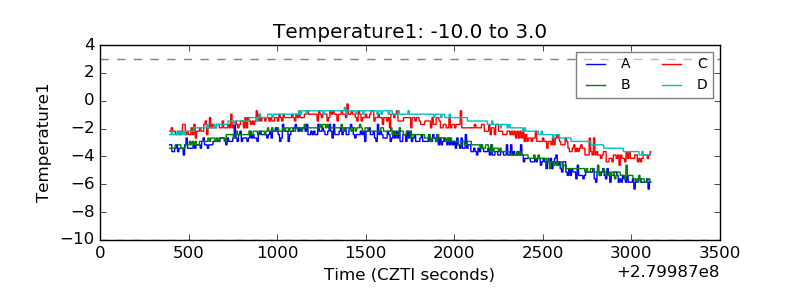 |
| Veto HV Monitor | 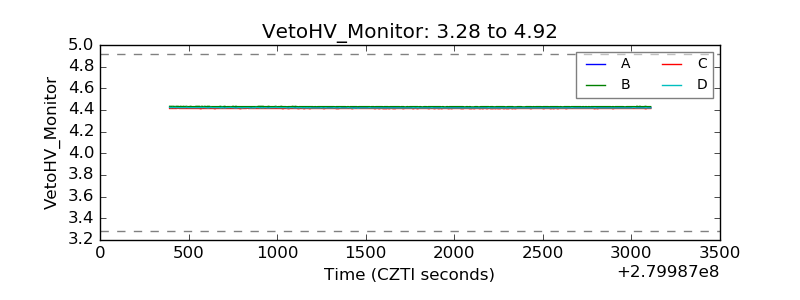 |
| Veto LLD | 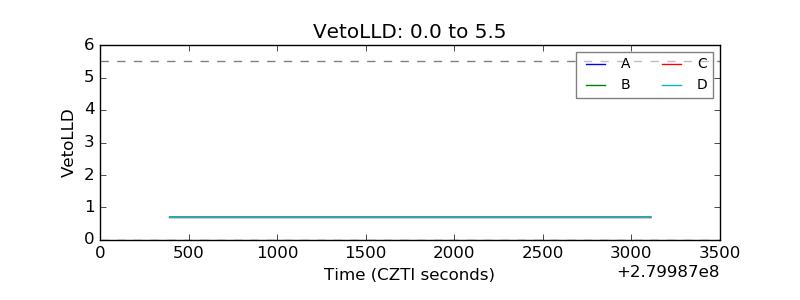 |
| Alpha Counter | 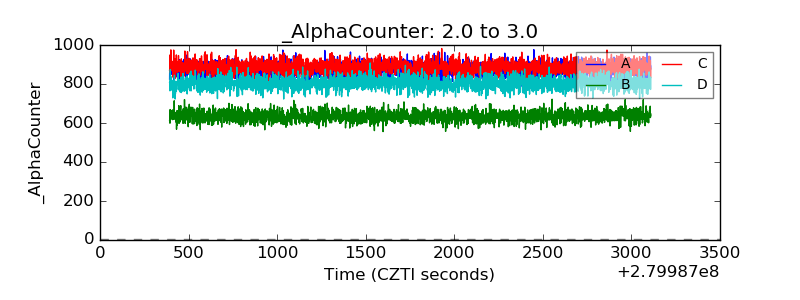 |
| _CPM_Rate | 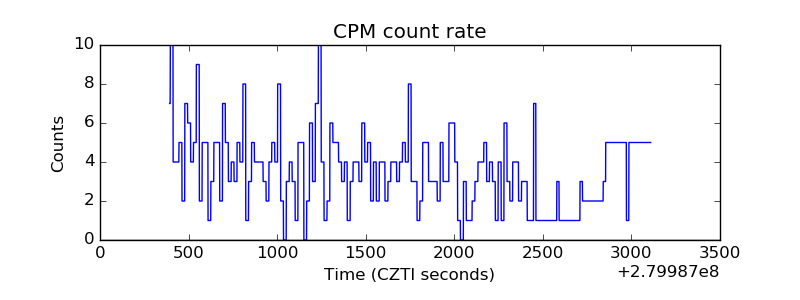 |
| CZT Counter | 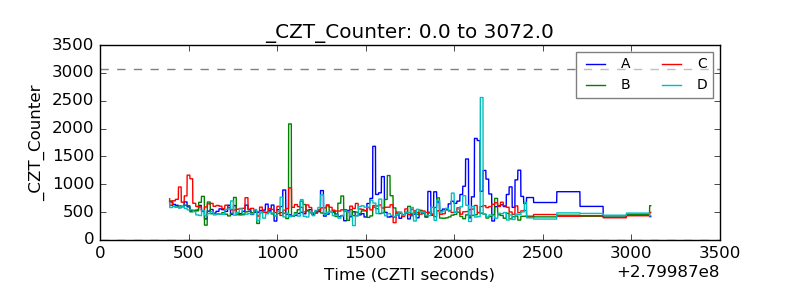 |
| +2.5 Volts monitor |  |
| +5 Volts monitor |  |
| _ROLL_ROT | 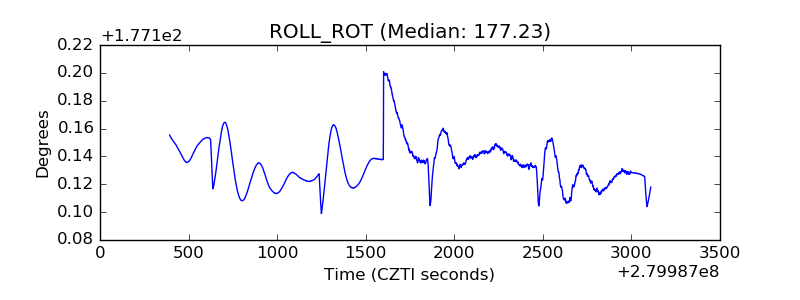 |
| _Roll_DEC | 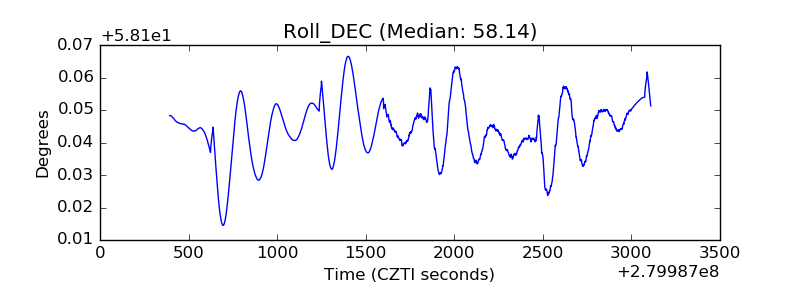 |
| _Roll_RA | 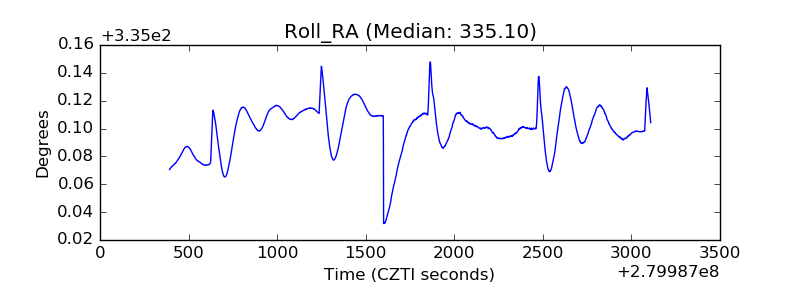 |
| Veto Counter | 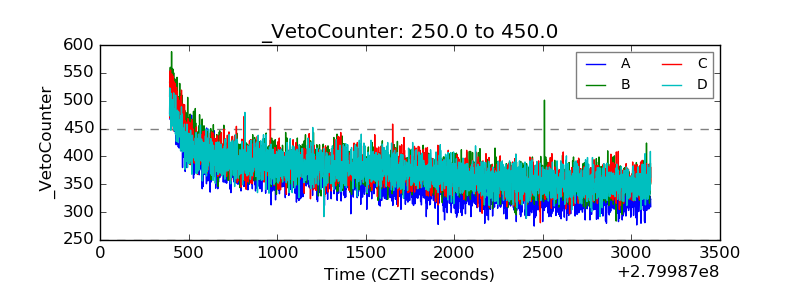 |