| Param | Original file | Final file |
|---|---|---|
| Filename | modeM0/AS1A05_206T01_9000002518cztM0_level2.fits | modeM0/AS1A05_206T01_9000002518cztM0_level2_quad_clean.evt |
| Size (bytes) | 769,893,120 | 743,037,120 |
| Size | 734.2 MB | 708.6 MB |
| Events in quadrant A | 4,577,272 | 4,286,305 |
| Events in quadrant B | 4,483,258 | 4,436,621 |
| Events in quadrant C | 4,631,960 | 4,255,120 |
| Events in quadrant D | 4,025,700 | 3,929,348 |
| Mode SS | |||
|---|---|---|---|
| Quadrant | BADHDUFLAG | Total packets | Discarded packets |
| A | 0 | 1668 | 0 |
| B | 0 | 1668 | 0 |
| C | 0 | 1668 | 0 |
| D | 0 | 1668 | 0 |
| Mode M0 | |||
|---|---|---|---|
| Quadrant | BADHDUFLAG | Total packets | Discarded packets |
| A | 0 | 206249 | 0 |
| B | 0 | 183999 | 0 |
| C | 0 | 175960 | 0 |
| D | 0 | 183242 | 0 |
| Mode M9 | |||
|---|---|---|---|
| Quadrant | BADHDUFLAG | Total packets | Discarded packets |
| A | 0 | 113 | 0 |
| B | 0 | 113 | 0 |
| C | 0 | 113 | 0 |
| D | 0 | 113 | 0 |
| Quadrant | Total seconds | Saturated seconds | Saturation percentage |
|---|---|---|---|
| A | 81602 | 5120 | 6.274356% |
| B | 81603 | 1734 | 2.124922% |
| C | 81603 | 1355 | 1.660478% |
| D | 81603 | 1494 | 1.830815% |
Noise dominated data is calculated using 1-second bins in cleaned event files. If a bin has >2000 counts, and if more than 50% of those come from <1% of pixels, then it is considered to be noise-dominated and hence unusable.
| Quadrant | # 1 sec bins | Bins with >0 counts | Bins with >2000 counts | High rate bins dominated by noise | Noise dominated (total time) | Noise dominated (detector-on time) | Marked lightcurve |
|---|---|---|---|---|---|---|---|
| A | 98452 | 81547 | 0 | 0 | 0.00% | 0.00% |  |
| B | 98452 | 81596 | 0 | 0 | 0.00% | 0.00% |  |
| C | 98452 | 81604 | 0 | 0 | 0.00% | 0.00% |  |
| D | 98452 | 81589 | 0 | 0 | 0.00% | 0.00% | 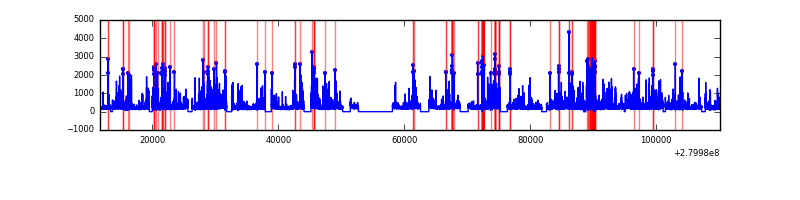 |
Top three noisy pixels from each quadrant. If the there are fewer than three noisy pixels in the level2.evt file, extra rows are filled as -1
| Pixel properties | Quadrant properties | ||||||
|---|---|---|---|---|---|---|---|
| Quadrant | DetID | PixID | Counts | Sigma | Mean | Median | Sigma |
| A | 0 | 29 | 4407 | 10.98 | 1191 | 1116 | 299.6 |
| A | 7 | 110 | 3788 | 8.92 | 1191 | 1116 | 299.6 |
| A | 0 | 30 | 3509 | 7.99 | 1191 | 1116 | 299.6 |
| B | 2 | 9 | 3687 | 11.12 | 1186 | 1134 | 229.5 |
| B | 3 | 17 | 3086 | 8.5 | 1186 | 1134 | 229.5 |
| B | 2 | 8 | 3069 | 8.43 | 1186 | 1134 | 229.5 |
| C | 1 | 80 | 3567 | 7.73 | 1223 | 1144 | 313.3 |
| C | 1 | 81 | 3553 | 7.69 | 1223 | 1144 | 313.3 |
| C | 12 | 241 | 3251 | 6.73 | 1223 | 1144 | 313.3 |
| D | 6 | 231 | 2930 | 6.19 | 1151 | 1050 | 303.8 |
| D | 3 | 14 | 2886 | 6.04 | 1151 | 1050 | 303.8 |
| D | 7 | 3 | 2865 | 5.97 | 1151 | 1050 | 303.8 |
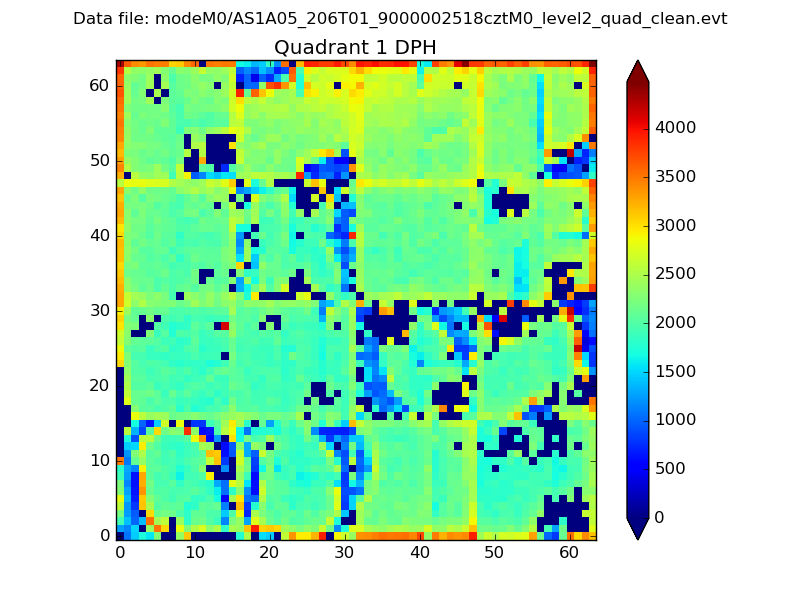
Histogram calculated using DETX and DETY for each event in the final _common_clean file
| Quadrant A |  |
 |
Quadrant B |
|---|---|---|---|
| Quadrant D | 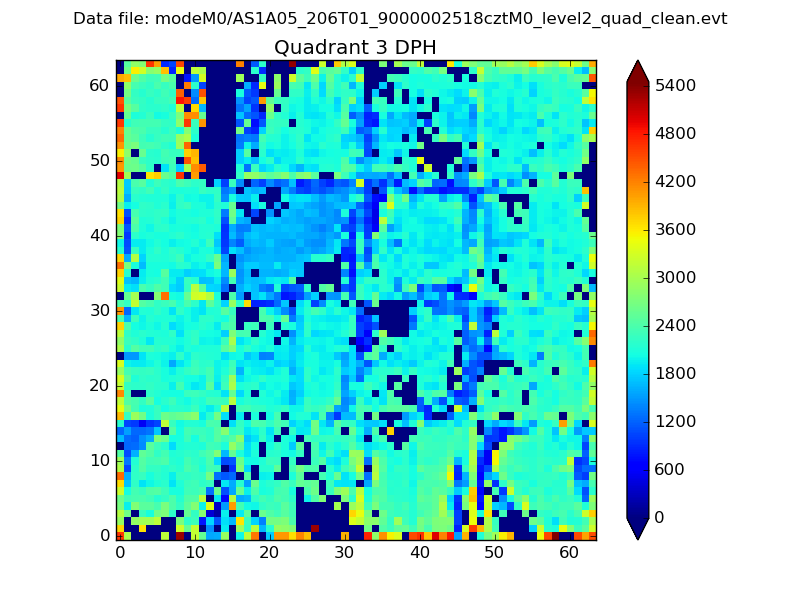 |
 |
Quadrant C |
| Plot type | Count rate plots | Images |
|---|---|---|
| Comparison with Poisson distribution Blue bars denote a histogram of data divided into 1 sec bins. Red curve is a Poisson curve with rate = median count rate of data. |
 |
 |
| Quadrant-wise count rates Data is divided into 100 sec bins |
 |
|
| Module-wise count rates for Quadrant A Data is divided into 100 sec bins |
 |
 |
| Module-wise count rates for Quadrant B Data is divided into 100 sec bins |
 |
 |
| Module-wise count rates for Quadrant C Data is divided into 100 sec bins |
 |
 |
| Module-wise count rates for Quadrant D Data is divided into 100 sec bins |
 |
 |
| Parameter | Plot |
|---|---|
| CZT HV Monitor |  |
| D_VDD | 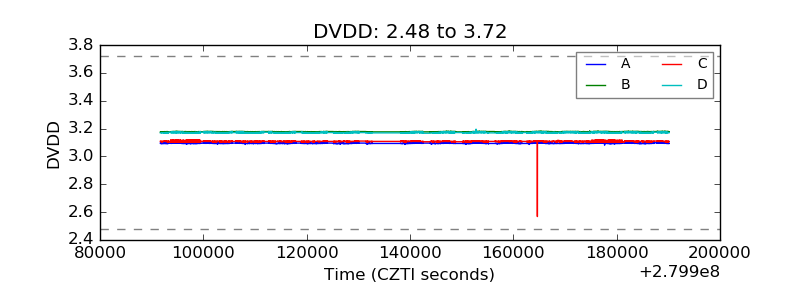 |
| Temperature 1 |  |
| Veto HV Monitor |  |
| Veto LLD | 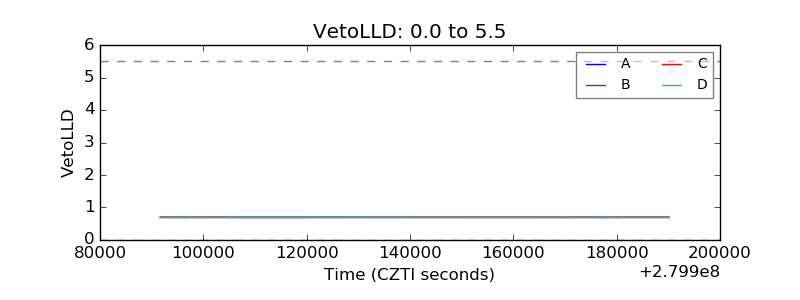 |
| Alpha Counter |  |
| _CPM_Rate |  |
| CZT Counter |  |
| +2.5 Volts monitor |  |
| +5 Volts monitor |  |
| _ROLL_ROT | 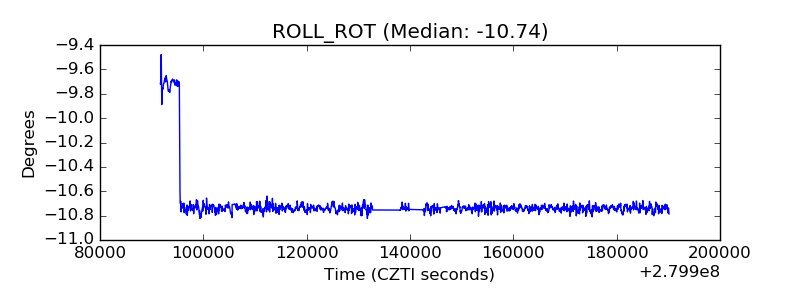 |
| _Roll_DEC |  |
| _Roll_RA |  |
| Veto Counter |  |