| Param | Original file | Final file |
|---|---|---|
| Filename | modeM0/AS1A05_206T01_9000002518_16940cztM0_level2.evt | modeM0/AS1A05_206T01_9000002518_16940cztM0_level2_quad_clean.evt |
| Size (bytes) | 262,465,920 | 38,983,680 |
| Size | 250.3 MB | 37.2 MB |
| Events in quadrant A | 2,409,496 | 227,706 |
| Events in quadrant B | 1,696,116 | 247,046 |
| Events in quadrant C | 1,949,250 | 239,557 |
| Events in quadrant D | 1,676,041 | 239,219 |
| Mode SS | |||
|---|---|---|---|
| Quadrant | BADHDUFLAG | Total packets | Discarded packets |
| A | 0 | 66 | 0 |
| B | 0 | 66 | 0 |
| C | 0 | 66 | 0 |
| D | 0 | 66 | 0 |
| Mode M0 | |||
|---|---|---|---|
| Quadrant | BADHDUFLAG | Total packets | Discarded packets |
| A | 0 | 9263 | 1 |
| B | 0 | 6966 | 1 |
| C | 0 | 7891 | 1 |
| D | 0 | 7004 | 1 |
| Mode M9 | |||
|---|---|---|---|
| Quadrant | BADHDUFLAG | Total packets | Discarded packets |
| A | 0 | 3 | 0 |
| B | 0 | 3 | 0 |
| C | 0 | 3 | 0 |
| D | 0 | 3 | 0 |
| Quadrant | Total seconds | Saturated seconds | Saturation percentage |
|---|---|---|---|
| A | 3183 | 372 | 11.687088% |
| B | 3183 | 136 | 4.272699% |
| C | 3183 | 143 | 4.492617% |
| D | 3183 | 83 | 2.607603% |
Noise dominated data is calculated using 1-second bins in cleaned event files. If a bin has >2000 counts, and if more than 50% of those come from <1% of pixels, then it is considered to be noise-dominated and hence unusable.
| Quadrant | # 1 sec bins | Bins with >0 counts | Bins with >2000 counts | High rate bins dominated by noise | Noise dominated (total time) | Noise dominated (detector-on time) | Marked lightcurve |
|---|---|---|---|---|---|---|---|
| A | 3469 | 3185 | 172 | 172 | 4.96% | 5.40% | 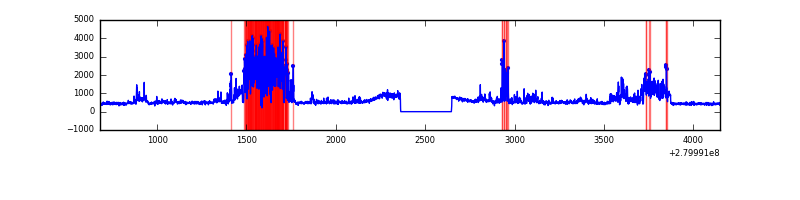 |
| B | 3469 | 3185 | 8 | 8 | 0.23% | 0.25% | 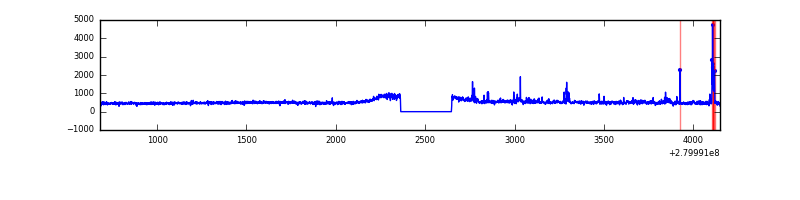 |
| C | 3469 | 3185 | 1 | 1 | 0.03% | 0.03% | 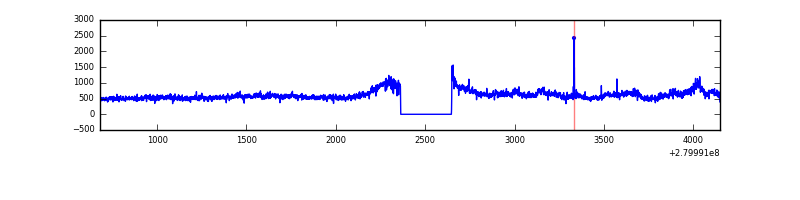 |
| D | 3469 | 3185 | 4 | 4 | 0.12% | 0.13% | 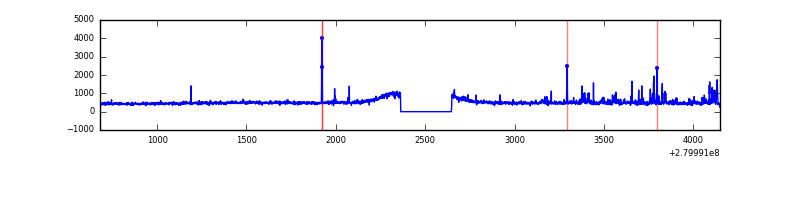 |
Top three noisy pixels from each quadrant. If the there are fewer than three noisy pixels in the level2.evt file, extra rows are filled as -1
| Pixel properties | Quadrant properties | ||||||
|---|---|---|---|---|---|---|---|
| Quadrant | DetID | PixID | Counts | Sigma | Mean | Median | Sigma |
| A | 15 | 174 | 906099 | 11261.68 | 389 | 377 | 80.4 |
| A | 0 | 23 | 5728 | 66.53 | 389 | 377 | 80.4 |
| A | 0 | 226 | 3779 | 42.29 | 389 | 377 | 80.4 |
| B | 3 | 64 | 35523 | 443.41 | 398 | 386 | 79.2 |
| B | 6 | 36 | 19118 | 236.39 | 398 | 386 | 79.2 |
| B | 0 | 219 | 18936 | 234.09 | 398 | 386 | 79.2 |
| C | 3 | 233 | 360769 | 3907.2 | 388 | 388 | 92.2 |
| C | 14 | 238 | 59299 | 638.71 | 388 | 388 | 92.2 |
| C | 14 | 225 | 8390 | 86.76 | 388 | 388 | 92.2 |
| D | 1 | 52 | 85602 | 870.22 | 399 | 386 | 97.9 |
| D | 15 | 0 | 27300 | 274.85 | 399 | 386 | 97.9 |
| D | 10 | 199 | 17239 | 172.1 | 399 | 386 | 97.9 |
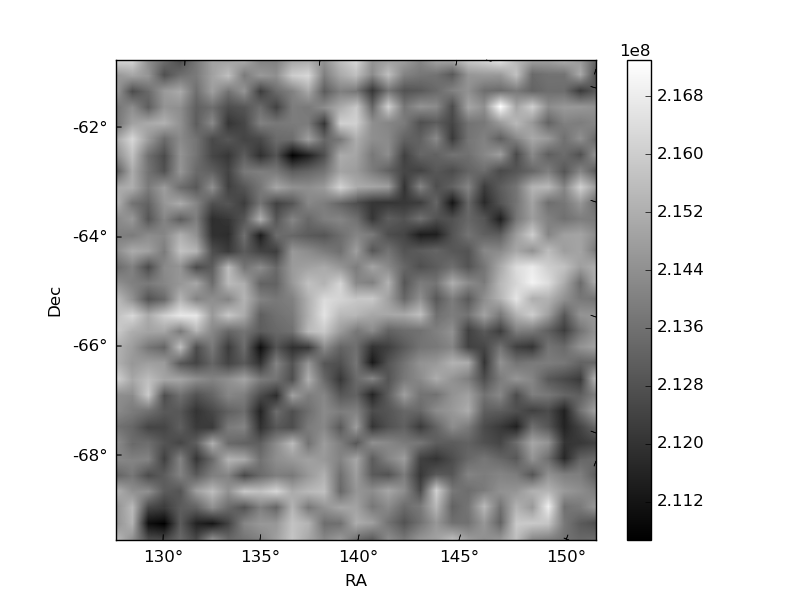
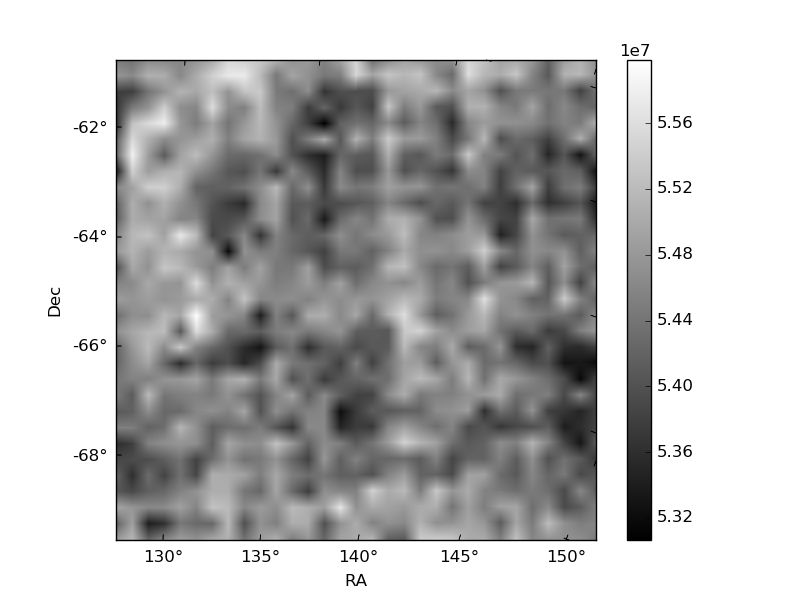
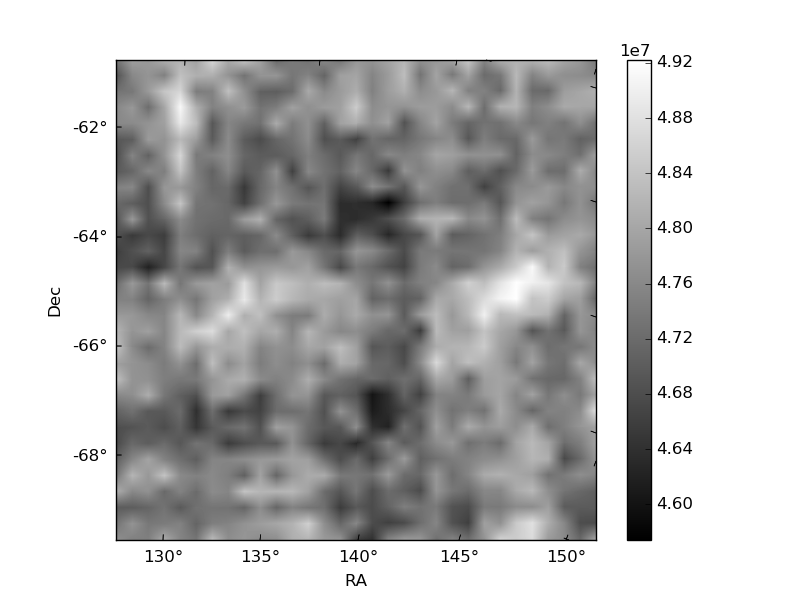
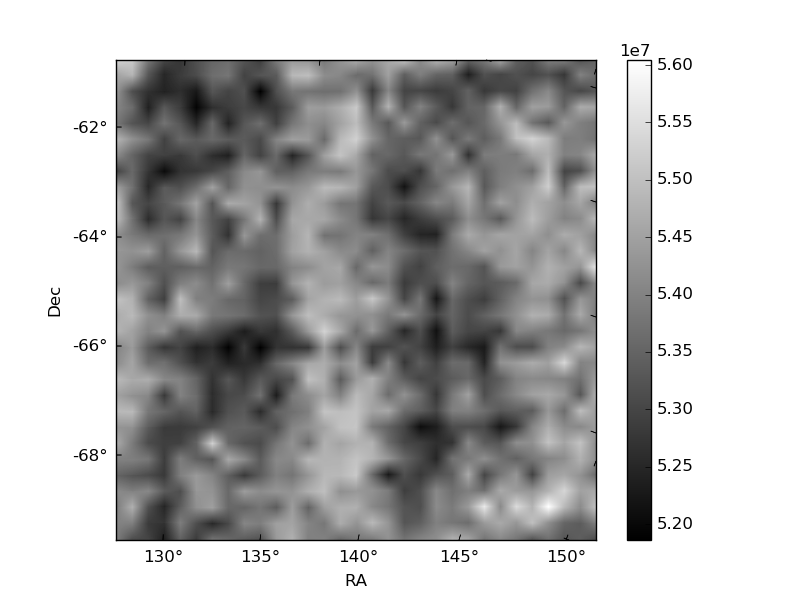
Histogram calculated using DETX and DETY for each event in the final _common_clean file
| Quadrant A | 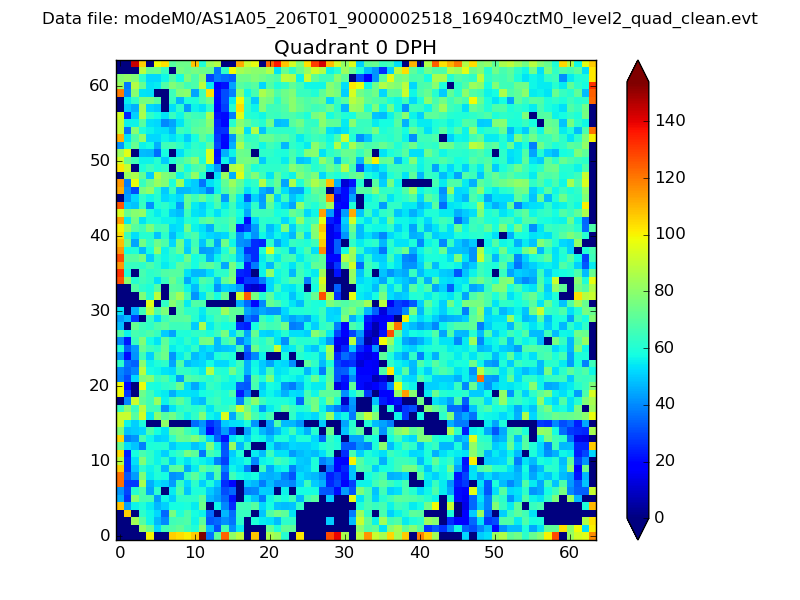 |
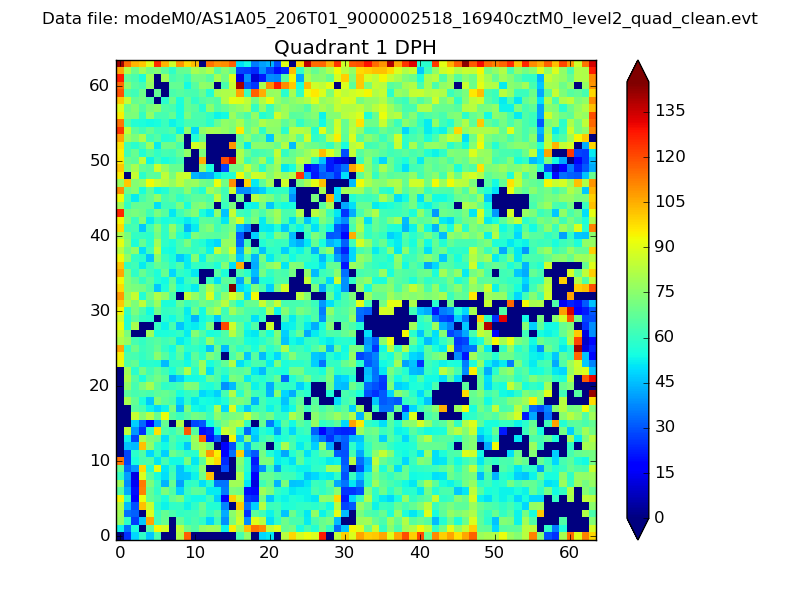 |
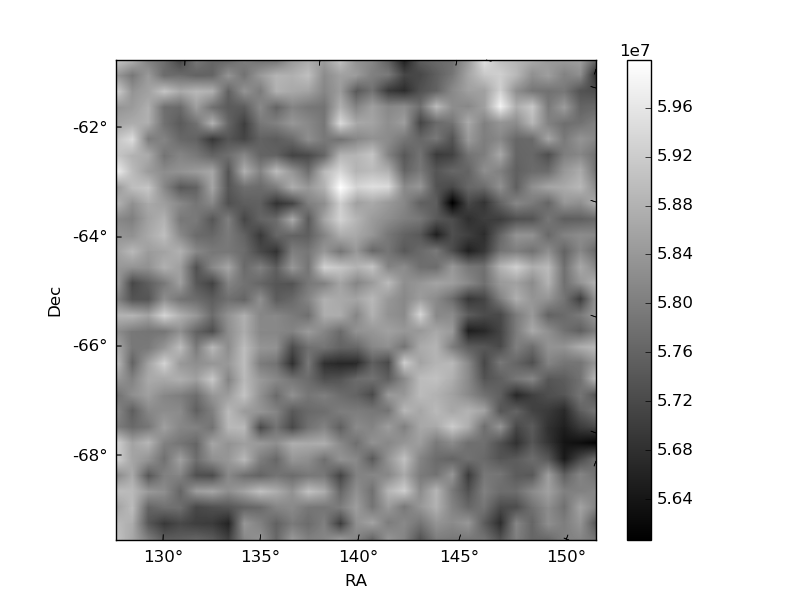
Quadrant B |
|---|---|---|---|
| Quadrant D | 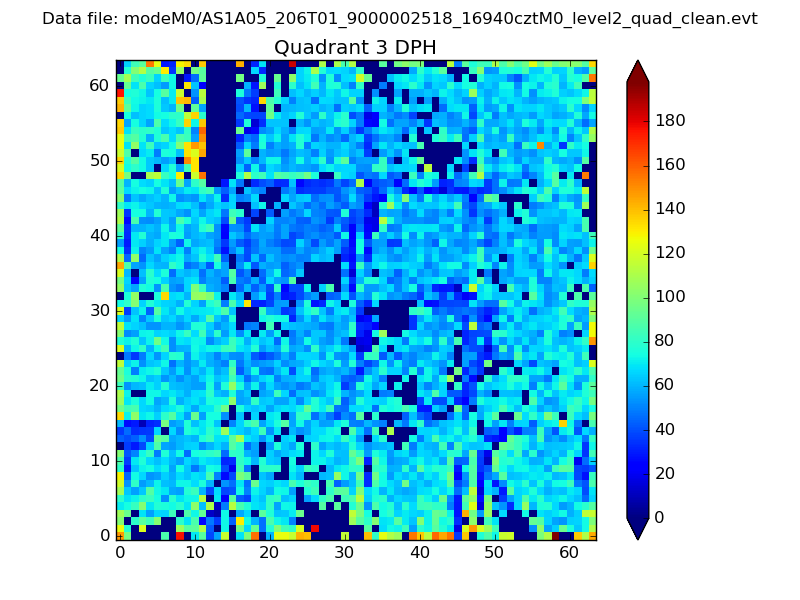 |
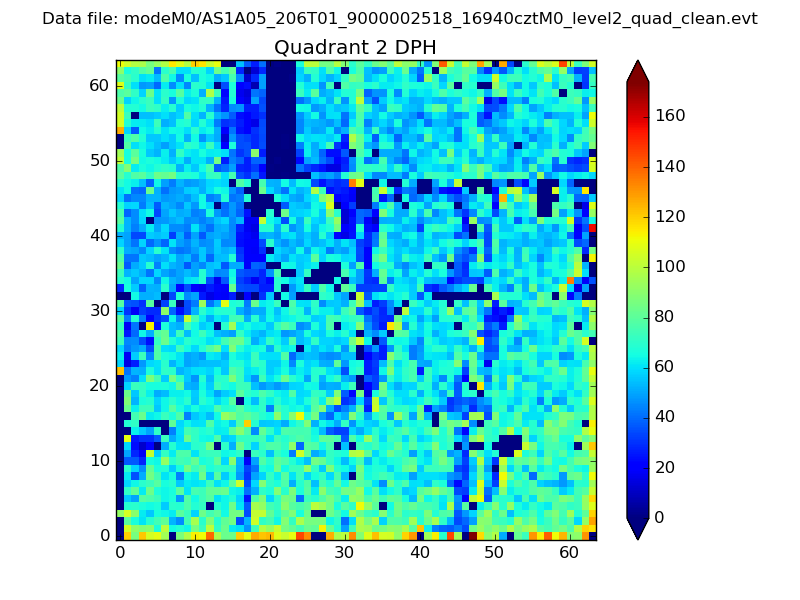 |
Quadrant C |
| Plot type | Count rate plots | Images |
|---|---|---|
| Comparison with Poisson distribution Blue bars denote a histogram of data divided into 1 sec bins. Red curve is a Poisson curve with rate = median count rate of data. |
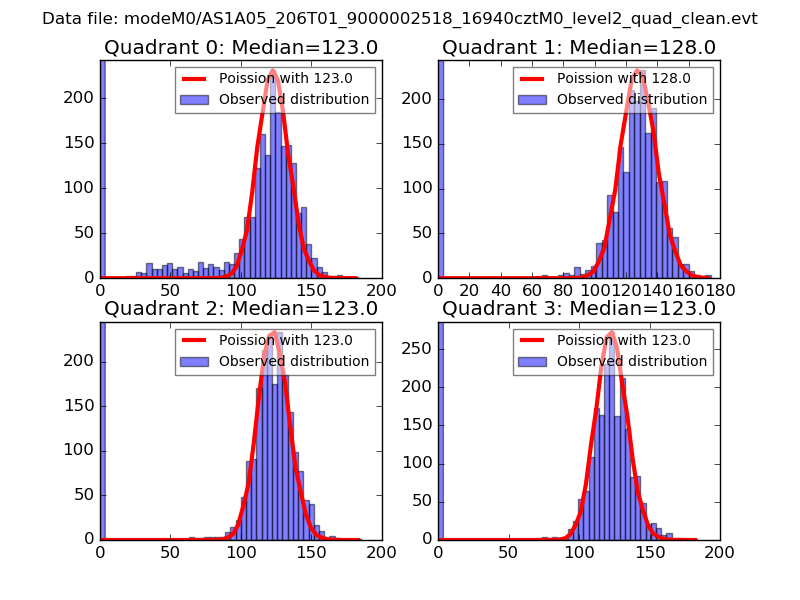 |
 |
| Quadrant-wise count rates Data is divided into 100 sec bins |
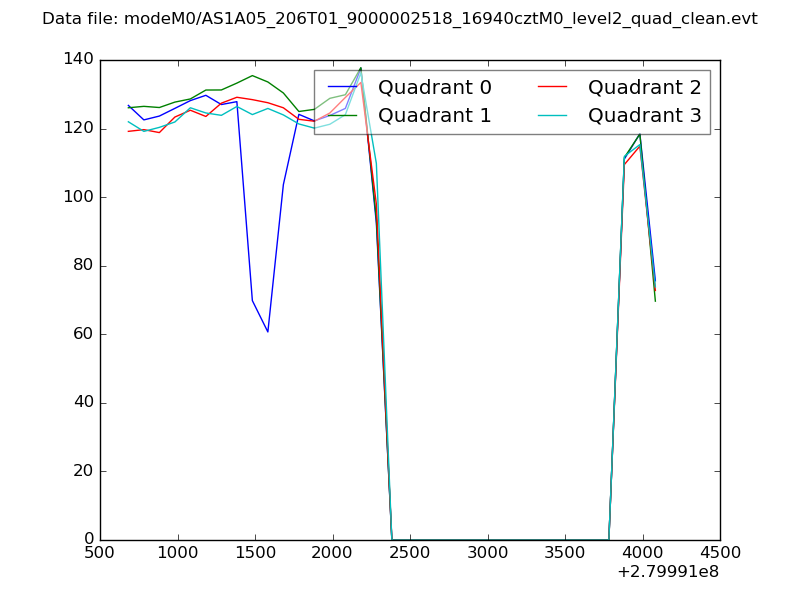 |
|
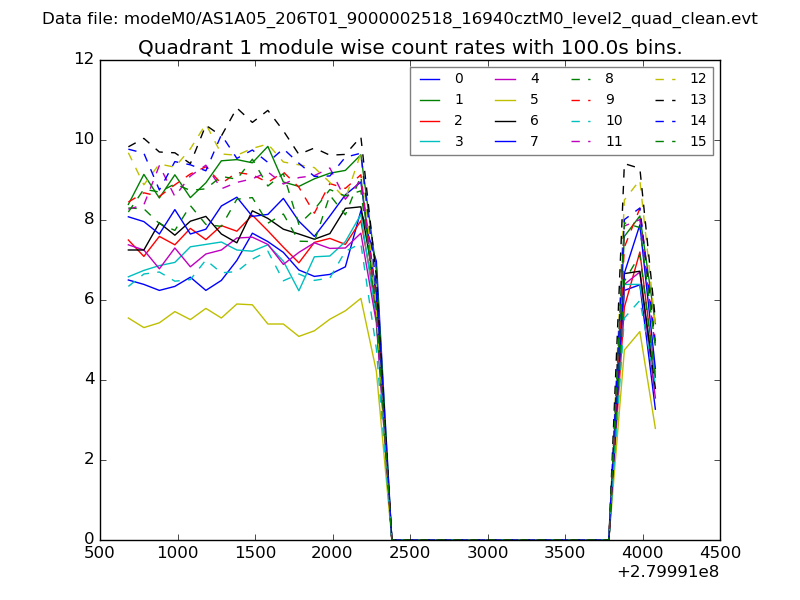
| Module-wise count rates for Quadrant A Data is divided into 100 sec bins |
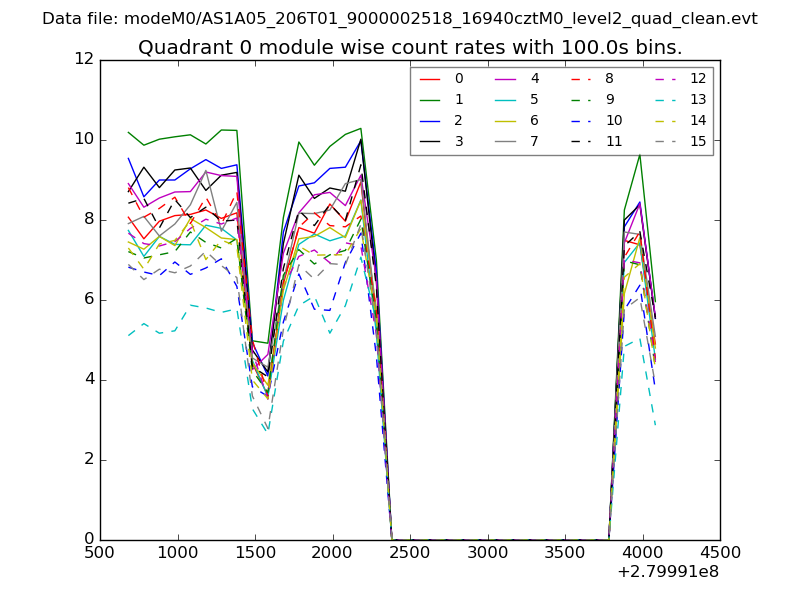 |
 |
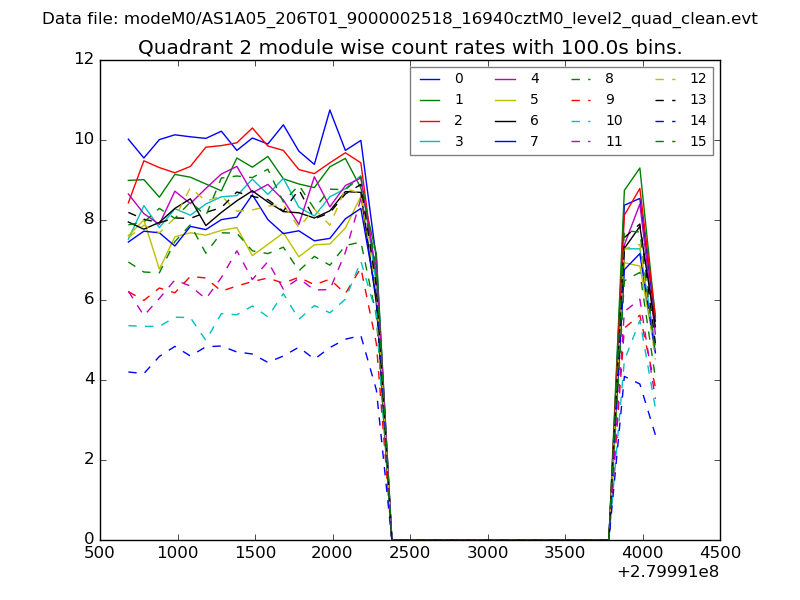
| Module-wise count rates for Quadrant B Data is divided into 100 sec bins |
 |
 |
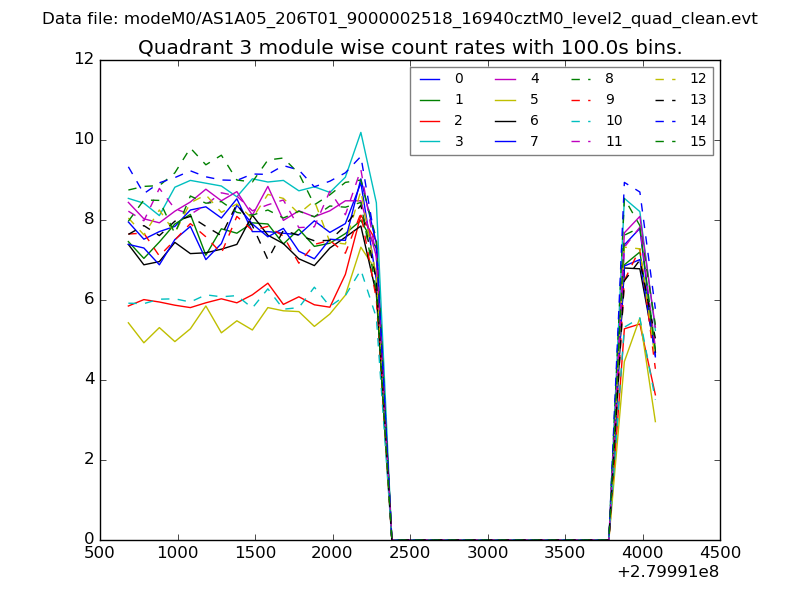
| Module-wise count rates for Quadrant C Data is divided into 100 sec bins |
 |
 |
| Module-wise count rates for Quadrant D Data is divided into 100 sec bins |
 |
 |
| Parameter | Plot |
|---|---|
| CZT HV Monitor | 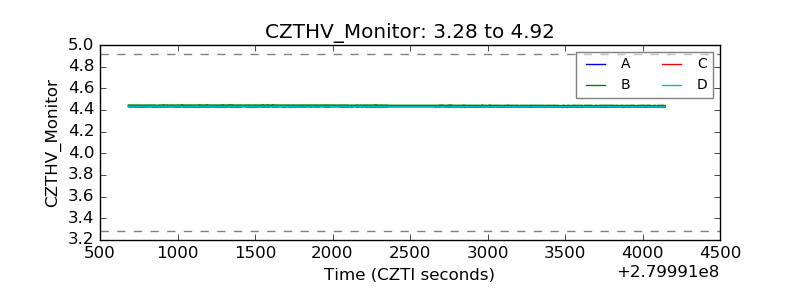 |
| D_VDD | 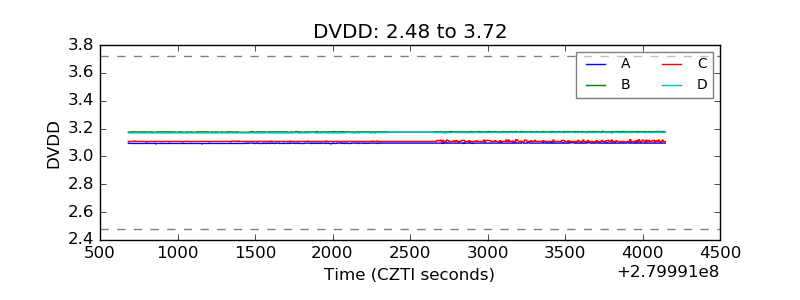 |
| Temperature 1 |  |
| Veto HV Monitor | 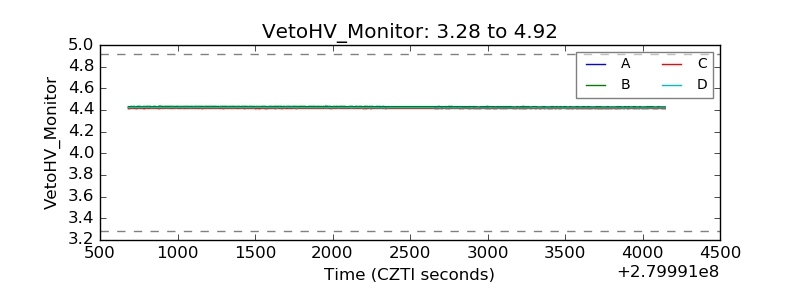 |
| Veto LLD |  |
| Alpha Counter | 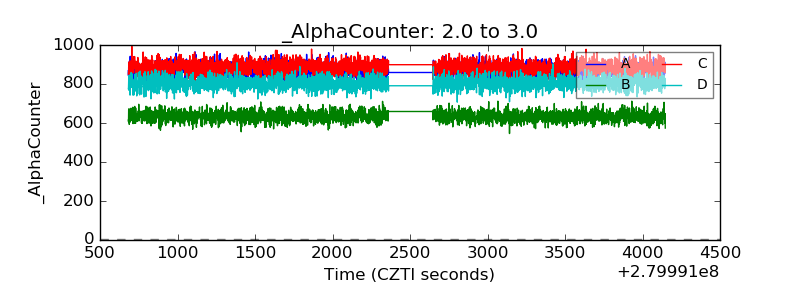 |
| _CPM_Rate | 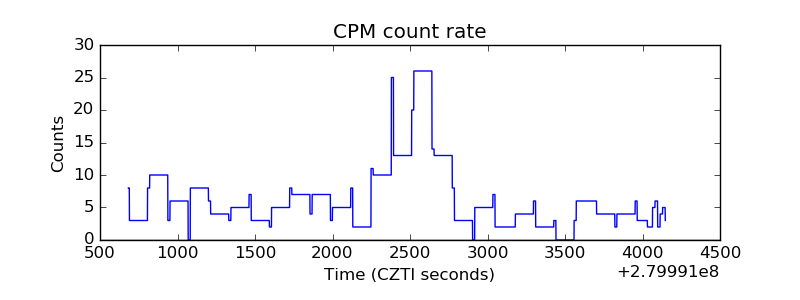 |
| CZT Counter | 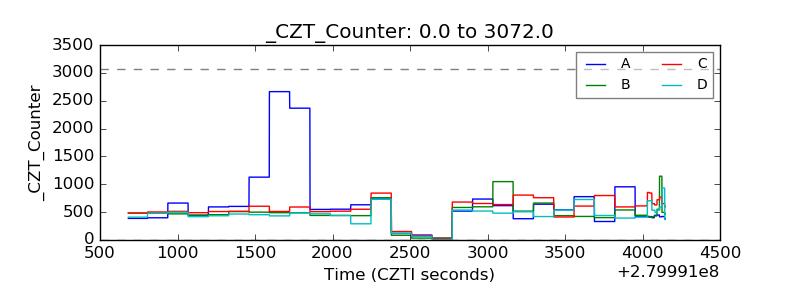 |
| +2.5 Volts monitor |  |
| +5 Volts monitor |  |
| _ROLL_ROT | 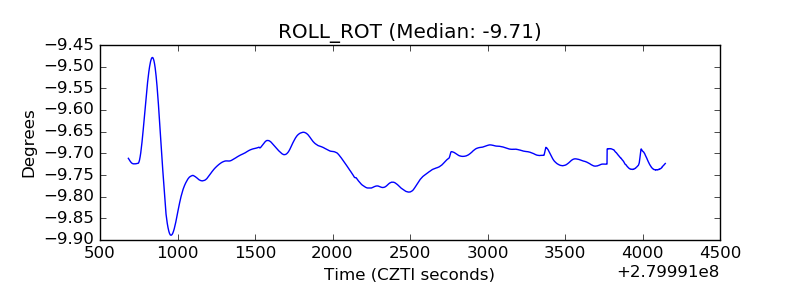 |
| _Roll_DEC | 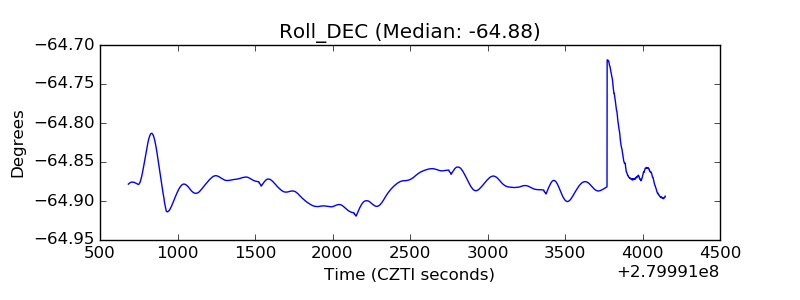 |
| _Roll_RA | 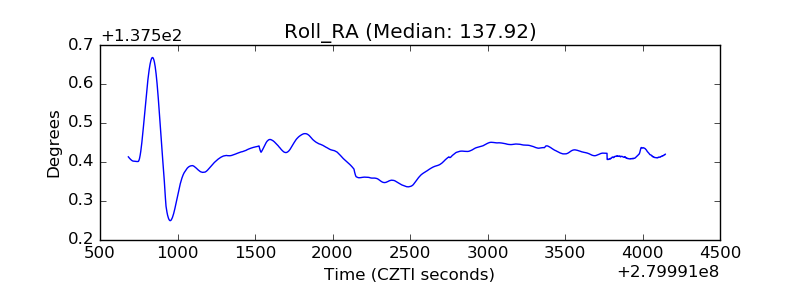 |
| Veto Counter | 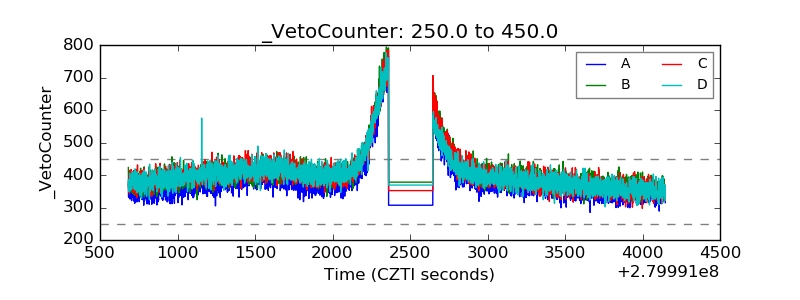 |