| Param | Original file | Final file |
|---|---|---|
| Filename | modeM0/AS1A05_206T01_9000002518_16943cztM0_level2.evt | modeM0/AS1A05_206T01_9000002518_16943cztM0_level2_quad_clean.evt |
| Size (bytes) | 1,405,514,880 | 276,384,960 |
| Size | 1.3 GB | 263.6 MB |
| Events in quadrant A | 12,119,260 | 1,787,305 |
| Events in quadrant B | 9,719,679 | 1,821,261 |
| Events in quadrant C | 9,481,303 | 1,750,358 |
| Events in quadrant D | 9,984,707 | 1,726,407 |
| Mode SS | |||
|---|---|---|---|
| Quadrant | BADHDUFLAG | Total packets | Discarded packets |
| A | 0 | 382 | 0 |
| B | 0 | 382 | 0 |
| C | 0 | 382 | 0 |
| D | 0 | 382 | 0 |
| Mode M0 | |||
|---|---|---|---|
| Quadrant | BADHDUFLAG | Total packets | Discarded packets |
| A | 0 | 48840 | 5 |
| B | 0 | 41205 | 4 |
| C | 0 | 40434 | 4 |
| D | 0 | 42722 | 4 |
| Mode M9 | |||
|---|---|---|---|
| Quadrant | BADHDUFLAG | Total packets | Discarded packets |
| A | 0 | 22 | 0 |
| B | 0 | 22 | 0 |
| C | 0 | 22 | 0 |
| D | 0 | 22 | 0 |
| Quadrant | Total seconds | Saturated seconds | Saturation percentage |
|---|---|---|---|
| A | 18660 | 1491 | 7.990354% |
| B | 18661 | 384 | 2.057768% |
| C | 18661 | 313 | 1.677295% |
| D | 18661 | 374 | 2.004180% |
Noise dominated data is calculated using 1-second bins in cleaned event files. If a bin has >2000 counts, and if more than 50% of those come from <1% of pixels, then it is considered to be noise-dominated and hence unusable.
| Quadrant | # 1 sec bins | Bins with >0 counts | Bins with >2000 counts | High rate bins dominated by noise | Noise dominated (total time) | Noise dominated (detector-on time) | Marked lightcurve |
|---|---|---|---|---|---|---|---|
| A | 20861 | 18665 | 864 | 864 | 4.14% | 4.63% | 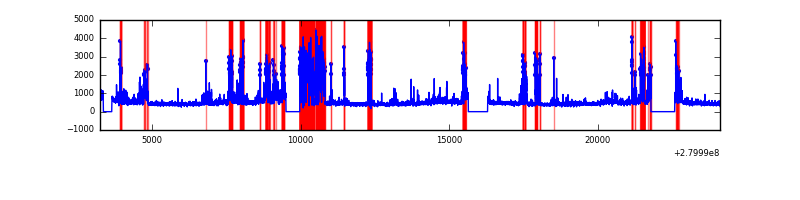 |
| B | 20862 | 18666 | 62 | 62 | 0.30% | 0.33% | 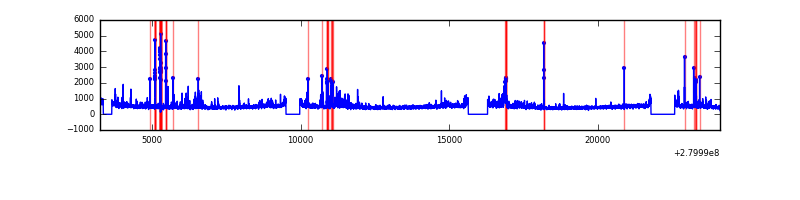 |
| C | 20862 | 18666 | 2 | 2 | 0.01% | 0.01% | 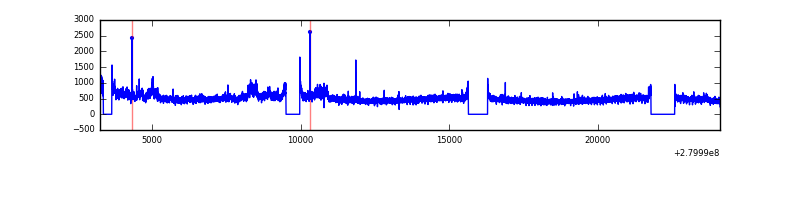 |
| D | 20862 | 18666 | 140 | 140 | 0.67% | 0.75% | 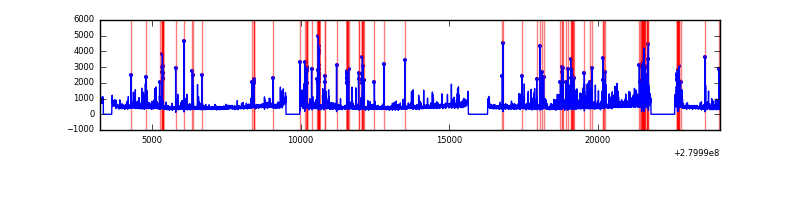 |
Top three noisy pixels from each quadrant. If the there are fewer than three noisy pixels in the level2.evt file, extra rows are filled as -1
| Pixel properties | Quadrant properties | ||||||
|---|---|---|---|---|---|---|---|
| Quadrant | DetID | PixID | Counts | Sigma | Mean | Median | Sigma |
| A | 15 | 174 | 3633121 | 8550.69 | 2098 | 2045 | 424.7 |
| A | 12 | 189 | 391894 | 918.04 | 2098 | 2045 | 424.7 |
| A | 0 | 23 | 31546 | 69.47 | 2098 | 2045 | 424.7 |
| B | 15 | 35 | 394311 | 952.46 | 2174 | 2116 | 411.8 |
| B | 3 | 64 | 170401 | 408.69 | 2174 | 2116 | 411.8 |
| B | 0 | 229 | 106209 | 252.79 | 2174 | 2116 | 411.8 |
| C | 3 | 233 | 976305 | 2011.28 | 2085 | 2095 | 484.4 |
| C | 14 | 238 | 321501 | 659.42 | 2085 | 2095 | 484.4 |
| C | 14 | 225 | 24046 | 45.32 | 2085 | 2095 | 484.4 |
| D | 1 | 52 | 1210105 | 2351.18 | 2115 | 2050 | 513.8 |
| D | 10 | 199 | 255127 | 492.55 | 2115 | 2050 | 513.8 |
| D | 15 | 0 | 137461 | 263.54 | 2115 | 2050 | 513.8 |
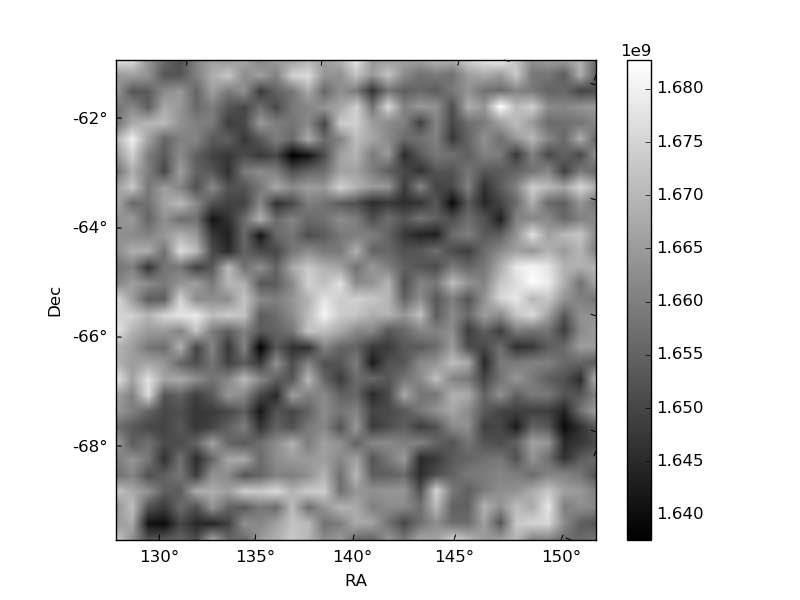
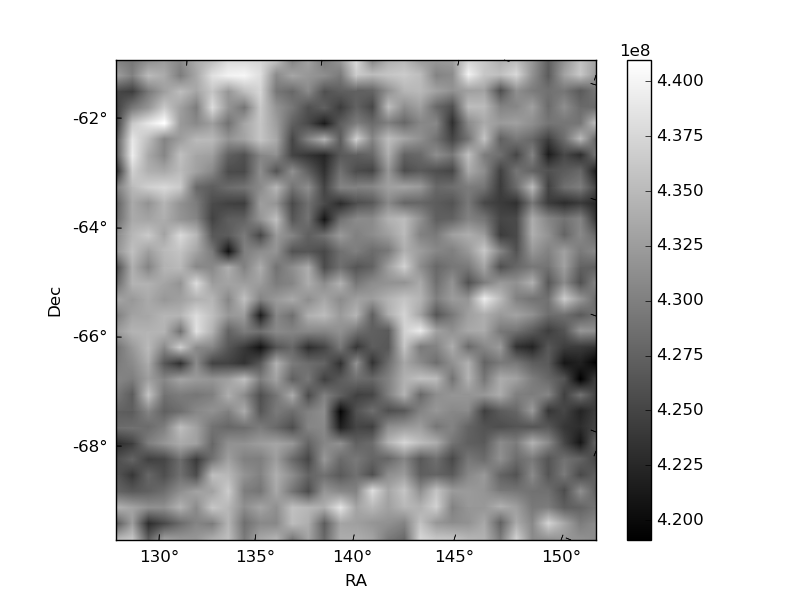
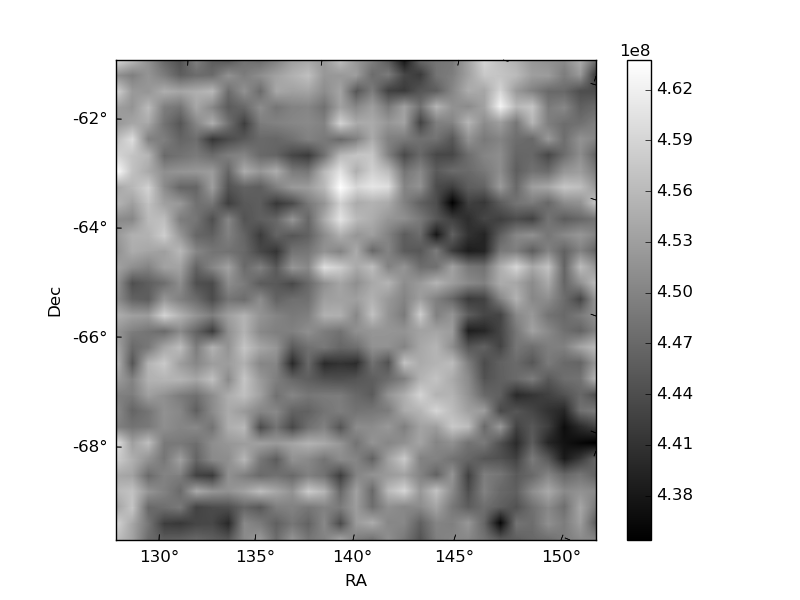
Histogram calculated using DETX and DETY for each event in the final _common_clean file
| Quadrant A | 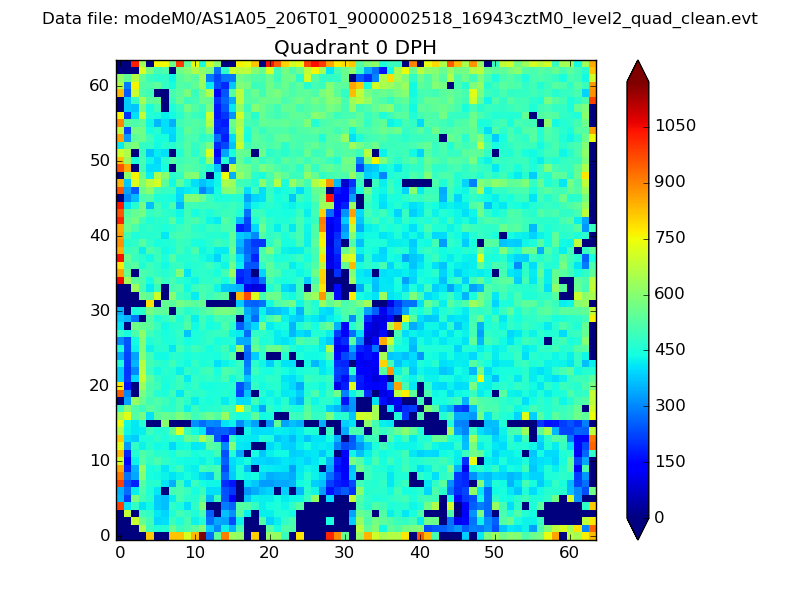 |
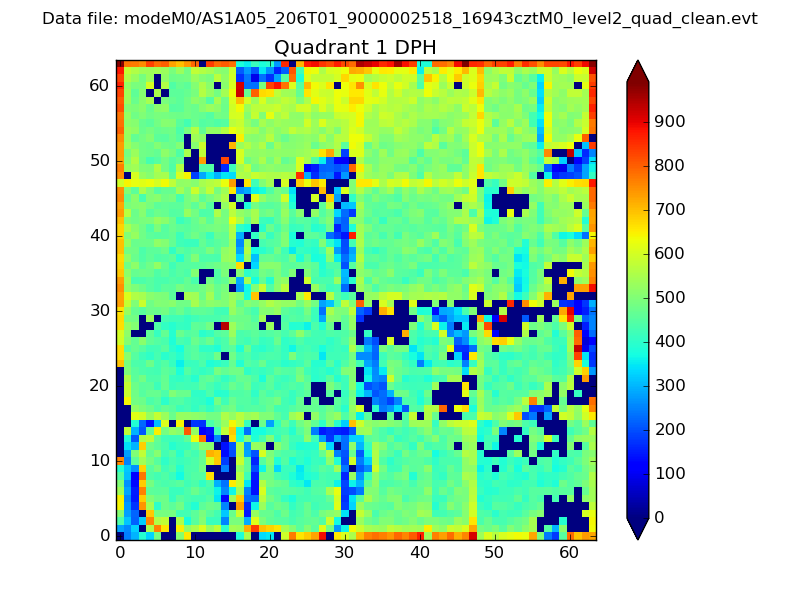 |
Quadrant B |
|---|---|---|---|
| Quadrant D | 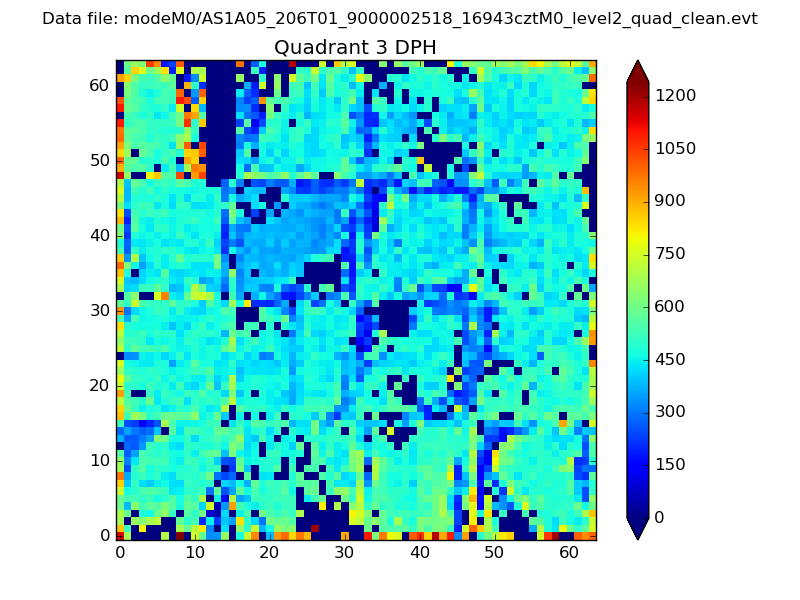 |
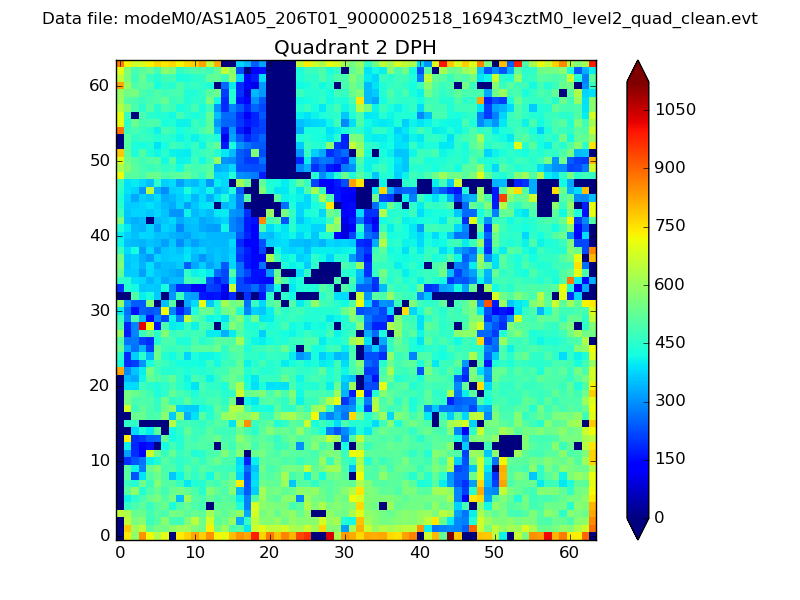 |
Quadrant C |
| Plot type | Count rate plots | Images |
|---|---|---|
| Comparison with Poisson distribution Blue bars denote a histogram of data divided into 1 sec bins. Red curve is a Poisson curve with rate = median count rate of data. |
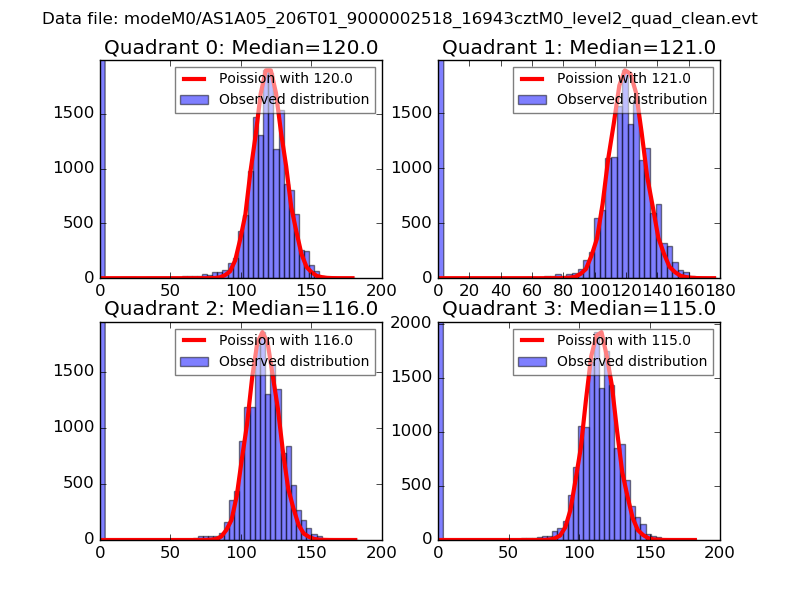 |
 |
| Quadrant-wise count rates Data is divided into 100 sec bins |
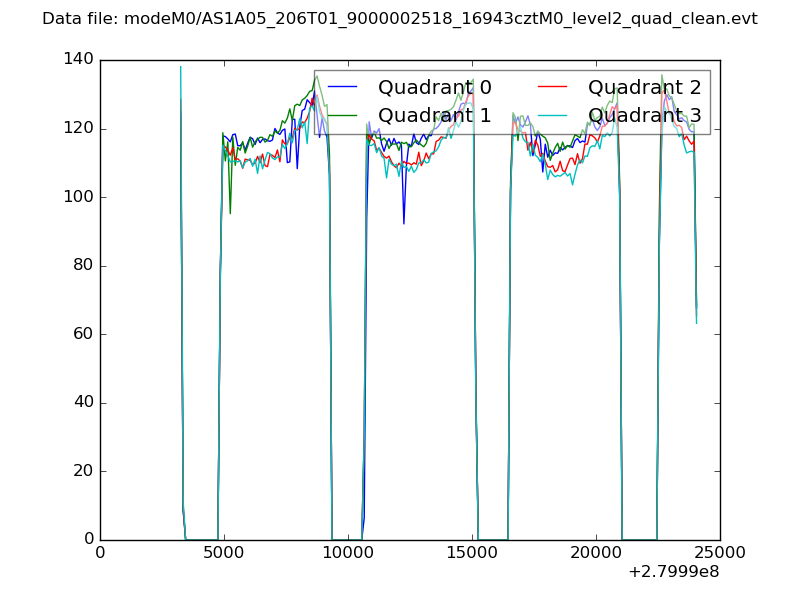 |
|
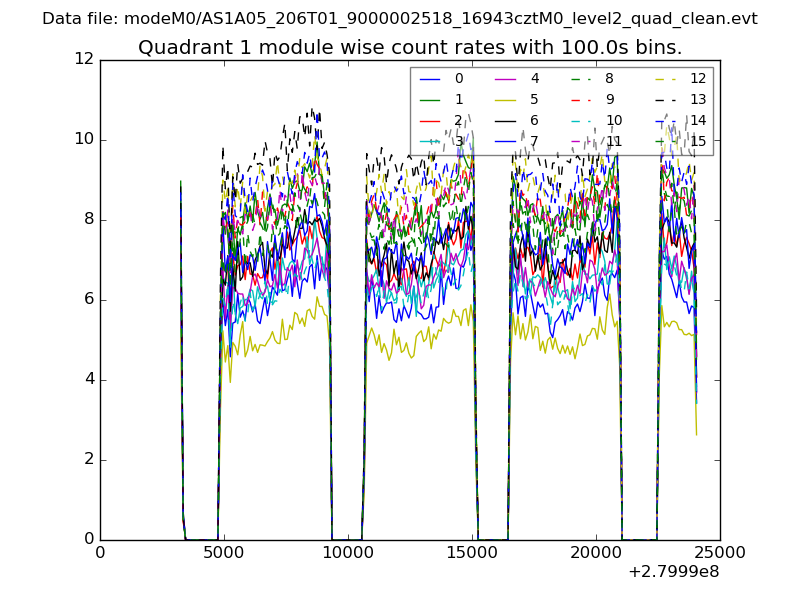
| Module-wise count rates for Quadrant A Data is divided into 100 sec bins |
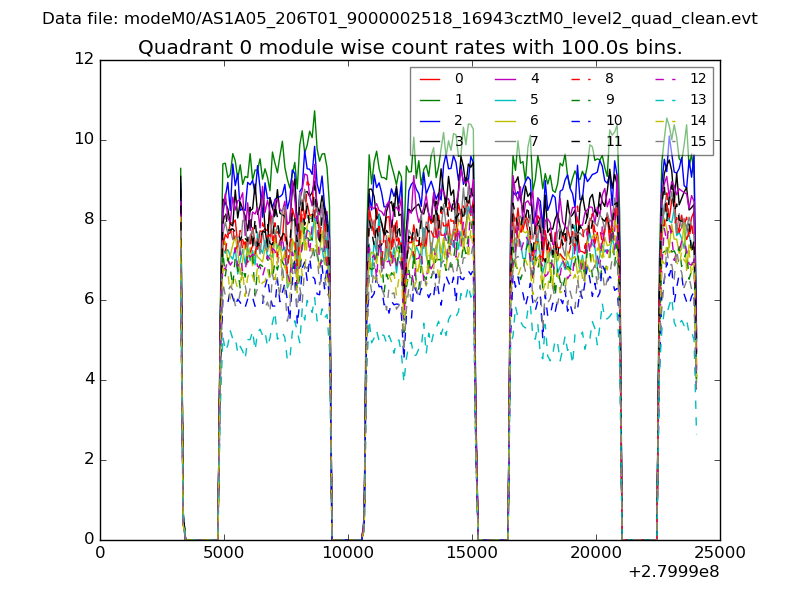 |
 |
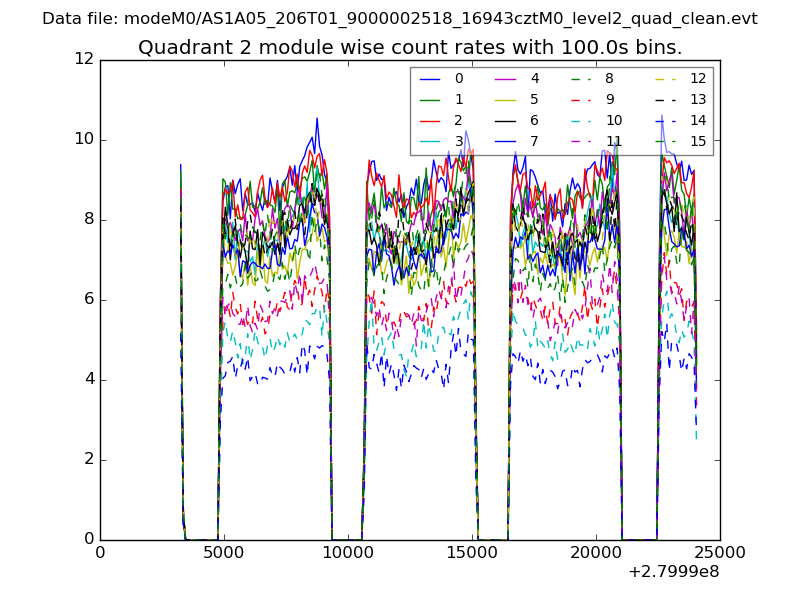
| Module-wise count rates for Quadrant B Data is divided into 100 sec bins |
 |
 |
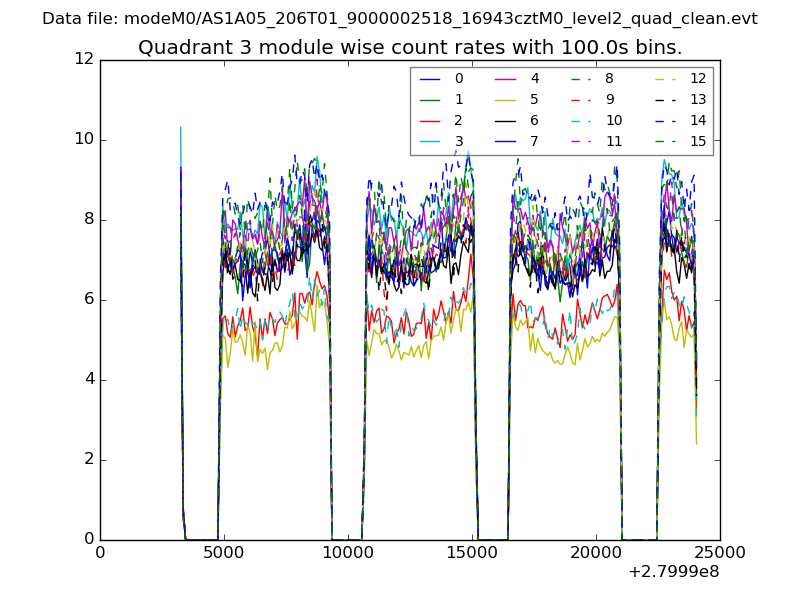
| Module-wise count rates for Quadrant C Data is divided into 100 sec bins |
 |
 |
| Module-wise count rates for Quadrant D Data is divided into 100 sec bins |
 |
 |
| Parameter | Plot |
|---|---|
| CZT HV Monitor | 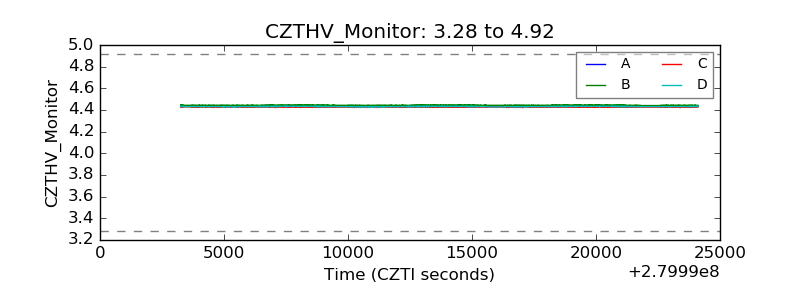 |
| D_VDD | 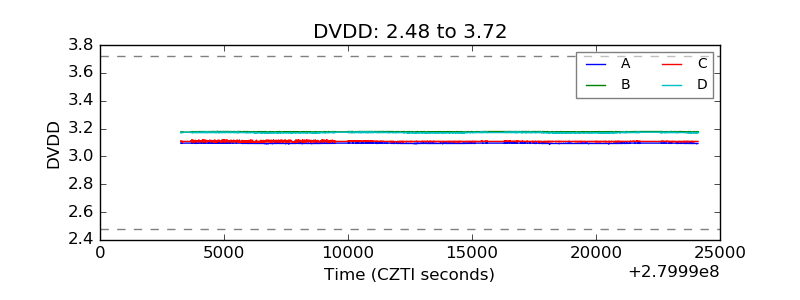 |
| Temperature 1 | 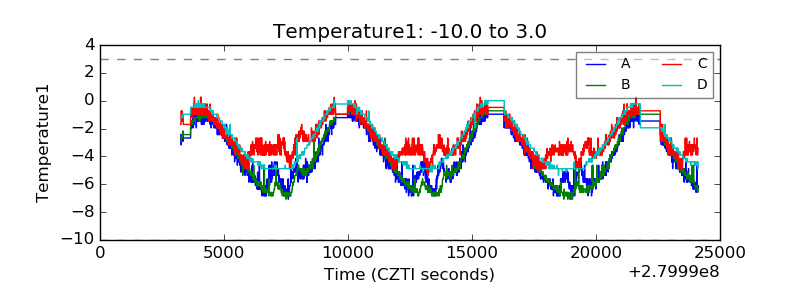 |
| Veto HV Monitor | 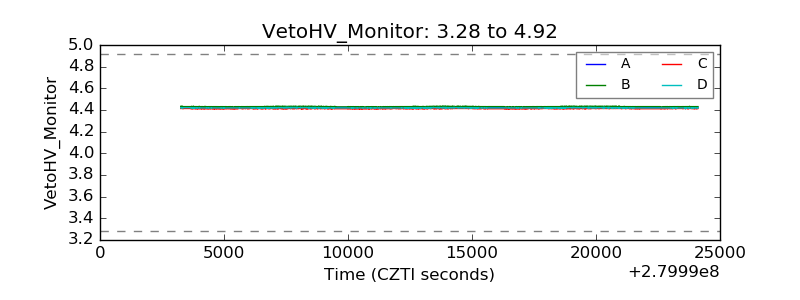 |
| Veto LLD | 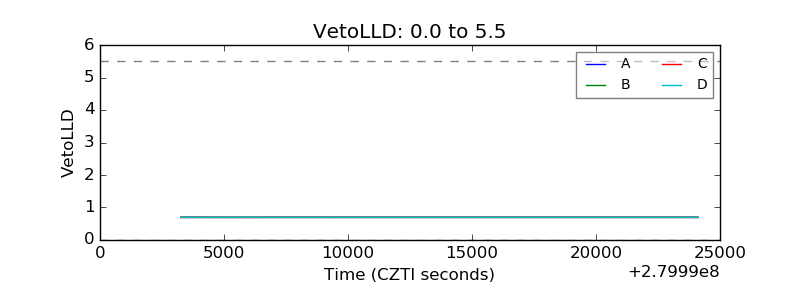 |
| Alpha Counter | 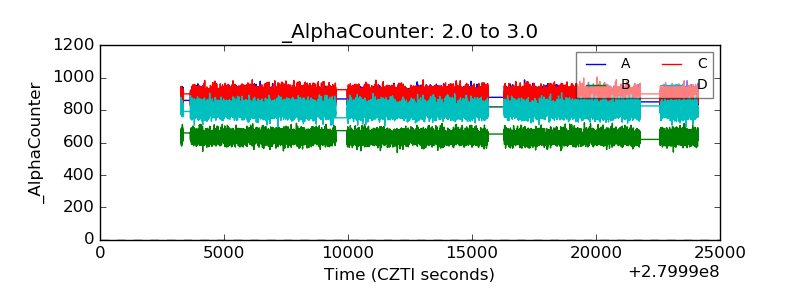 |
| _CPM_Rate | 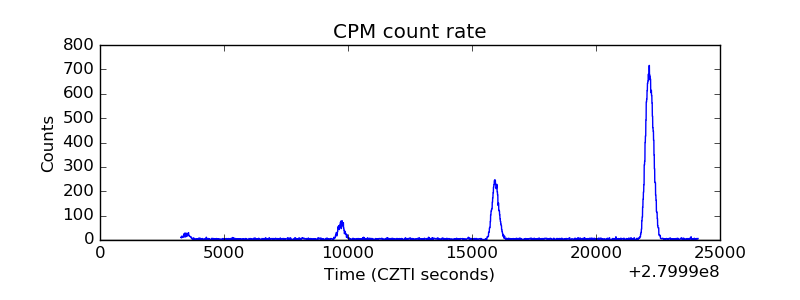 |
| CZT Counter | 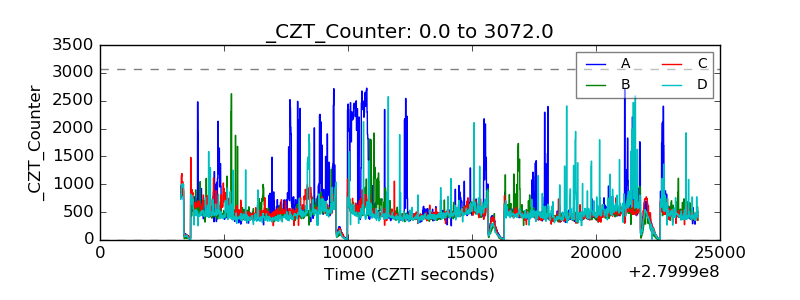 |
| +2.5 Volts monitor |  |
| +5 Volts monitor |  |
| _ROLL_ROT | 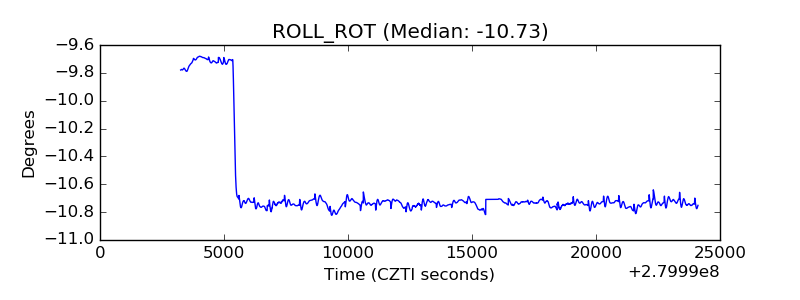 |
| _Roll_DEC | 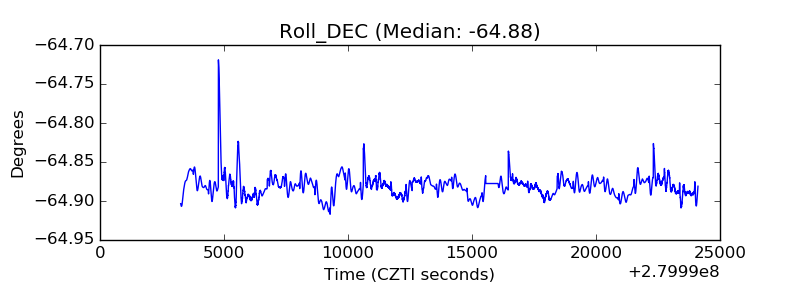 |
| _Roll_RA | 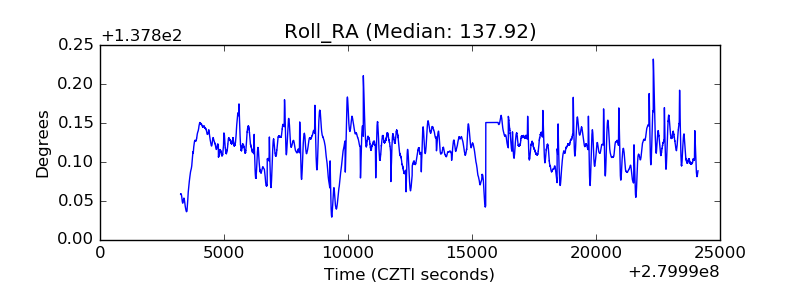 |
| Veto Counter | 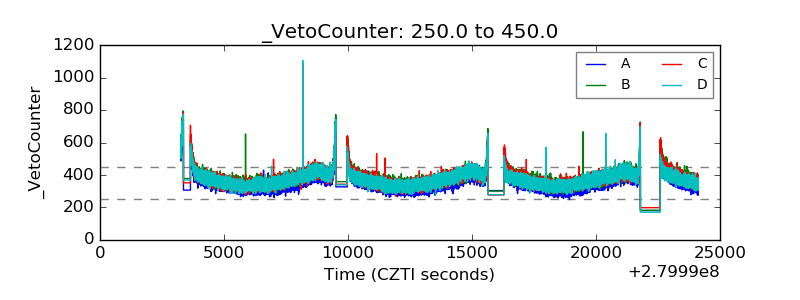 |