| Param | Original file | Final file |
|---|---|---|
| Filename | modeM0/AS1A05_206T01_9000002518_16946cztM0_level2.evt | modeM0/AS1A05_206T01_9000002518_16946cztM0_level2_quad_clean.evt |
| Size (bytes) | 513,832,320 | 106,093,440 |
| Size | 490.0 MB | 101.2 MB |
| Events in quadrant A | 4,302,292 | 684,416 |
| Events in quadrant B | 3,855,370 | 706,938 |
| Events in quadrant C | 3,392,062 | 681,152 |
| Events in quadrant D | 3,543,680 | 660,378 |
| Mode SS | |||
|---|---|---|---|
| Quadrant | BADHDUFLAG | Total packets | Discarded packets |
| A | 0 | 142 | 0 |
| B | 0 | 142 | 0 |
| C | 0 | 142 | 0 |
| D | 0 | 142 | 0 |
| Mode M0 | |||
|---|---|---|---|
| Quadrant | BADHDUFLAG | Total packets | Discarded packets |
| A | 0 | 17457 | 2 |
| B | 0 | 16126 | 2 |
| C | 0 | 14284 | 2 |
| D | 0 | 15273 | 2 |
| Mode M9 | |||
|---|---|---|---|
| Quadrant | BADHDUFLAG | Total packets | Discarded packets |
| A | 0 | 20 | 0 |
| B | 0 | 20 | 0 |
| C | 0 | 20 | 0 |
| D | 0 | 20 | 0 |
| Quadrant | Total seconds | Saturated seconds | Saturation percentage |
|---|---|---|---|
| A | 6893 | 433 | 6.281735% |
| B | 6893 | 115 | 1.668359% |
| C | 6893 | 57 | 0.826926% |
| D | 6893 | 54 | 0.783403% |
Noise dominated data is calculated using 1-second bins in cleaned event files. If a bin has >2000 counts, and if more than 50% of those come from <1% of pixels, then it is considered to be noise-dominated and hence unusable.
| Quadrant | # 1 sec bins | Bins with >0 counts | Bins with >2000 counts | High rate bins dominated by noise | Noise dominated (total time) | Noise dominated (detector-on time) | Marked lightcurve |
|---|---|---|---|---|---|---|---|
| A | 8979 | 6896 | 249 | 249 | 2.77% | 3.61% | 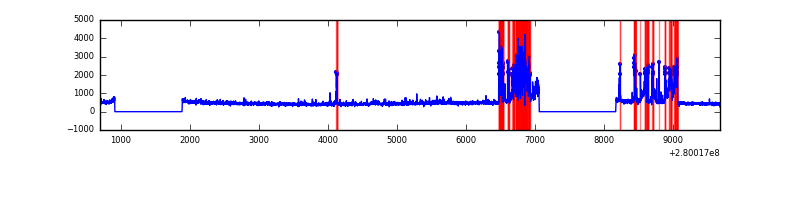 |
| B | 8979 | 6896 | 20 | 20 | 0.22% | 0.29% | 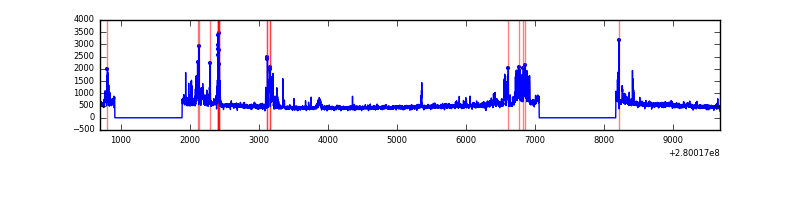 |
| C | 8979 | 6896 | 0 | 0 | 0.00% | 0.00% |  |
| D | 8979 | 6896 | 37 | 37 | 0.41% | 0.54% | 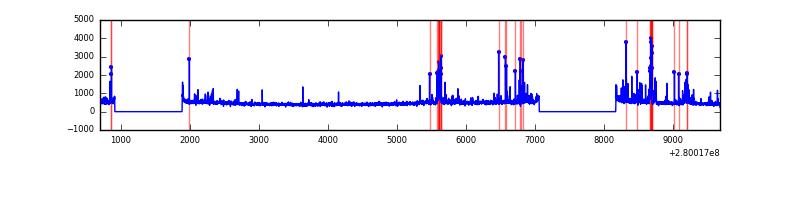 |
Top three noisy pixels from each quadrant. If the there are fewer than three noisy pixels in the level2.evt file, extra rows are filled as -1
| Pixel properties | Quadrant properties | ||||||
|---|---|---|---|---|---|---|---|
| Quadrant | DetID | PixID | Counts | Sigma | Mean | Median | Sigma |
| A | 15 | 174 | 1148349 | 7118.6 | 799 | 784 | 161.2 |
| A | 12 | 189 | 83255 | 511.59 | 799 | 784 | 161.2 |
| A | 0 | 226 | 7092 | 39.13 | 799 | 784 | 161.2 |
| B | 15 | 35 | 239795 | 1529.25 | 825 | 806 | 156.3 |
| B | 0 | 229 | 170511 | 1085.91 | 825 | 806 | 156.3 |
| B | 0 | 197 | 85950 | 544.82 | 825 | 806 | 156.3 |
| C | 3 | 233 | 144531 | 767.71 | 801 | 807 | 187.2 |
| C | 14 | 238 | 123987 | 657.97 | 801 | 807 | 187.2 |
| C | 13 | 61 | 5636 | 25.79 | 801 | 807 | 187.2 |
| D | 1 | 52 | 311141 | 1603.13 | 802 | 780 | 193.6 |
| D | 10 | 199 | 125644 | 644.97 | 802 | 780 | 193.6 |
| D | 2 | 234 | 23616 | 117.96 | 802 | 780 | 193.6 |
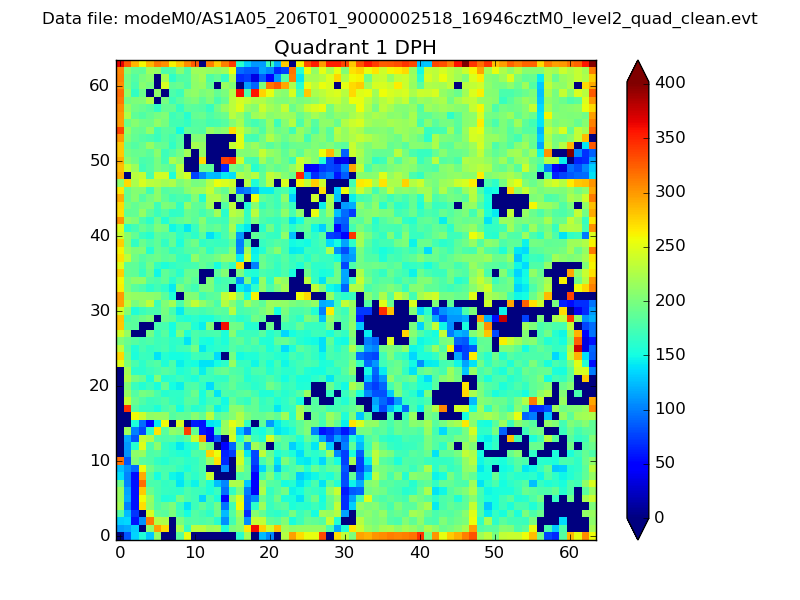
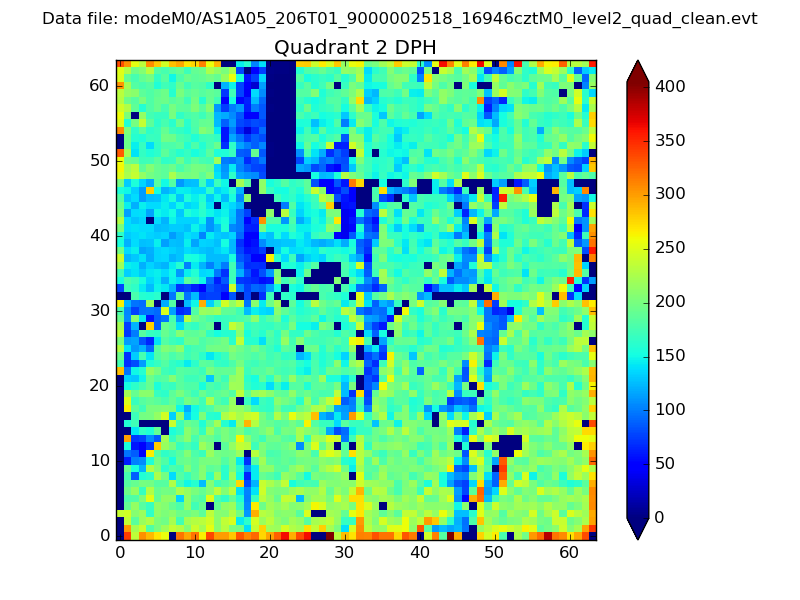
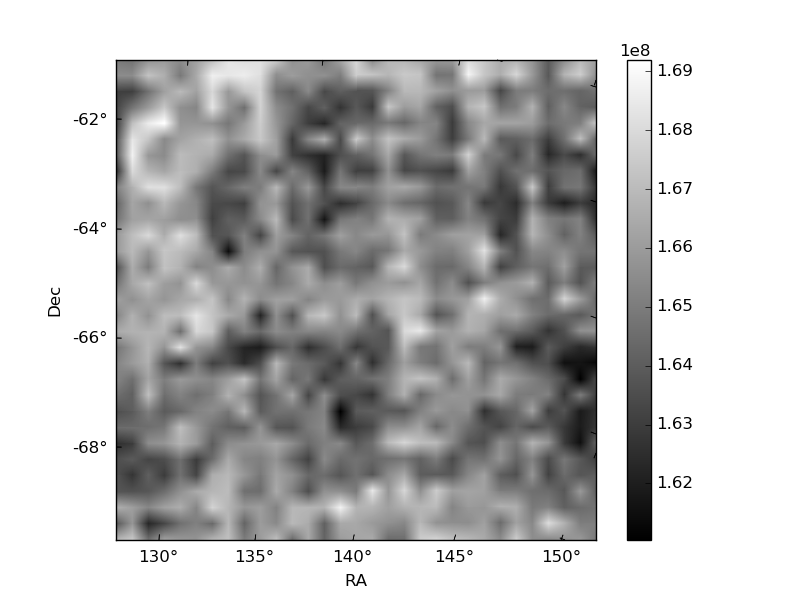
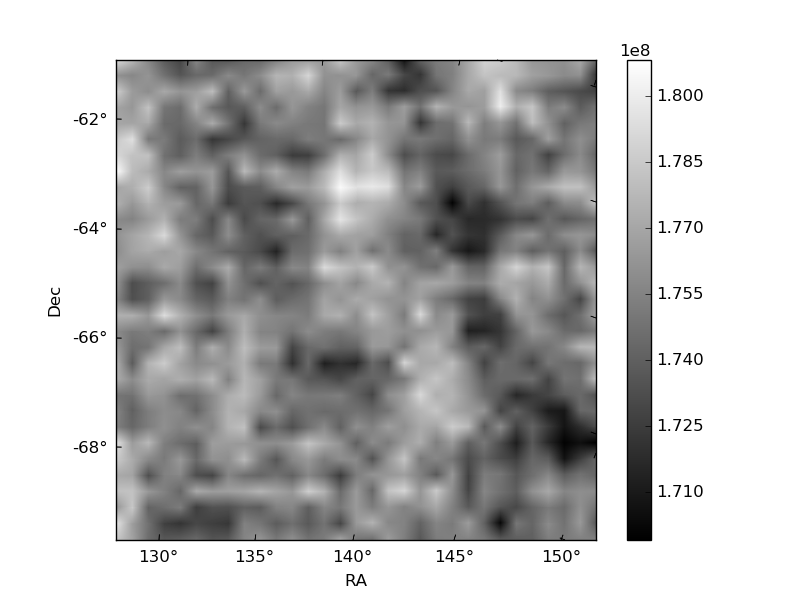
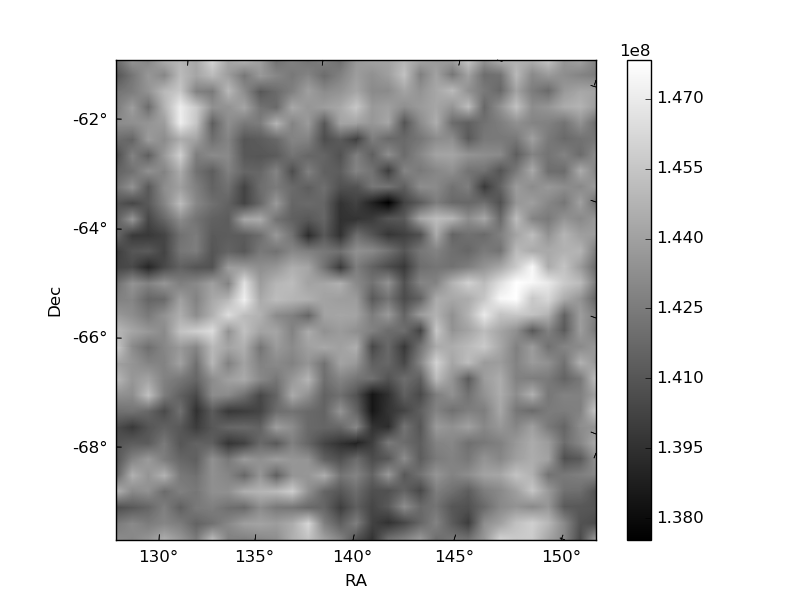
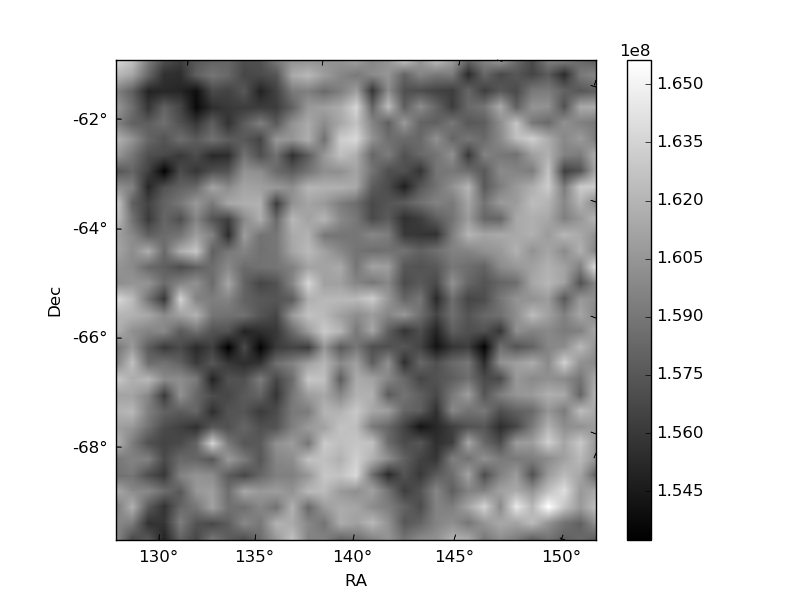
Histogram calculated using DETX and DETY for each event in the final _common_clean file
| Quadrant A | 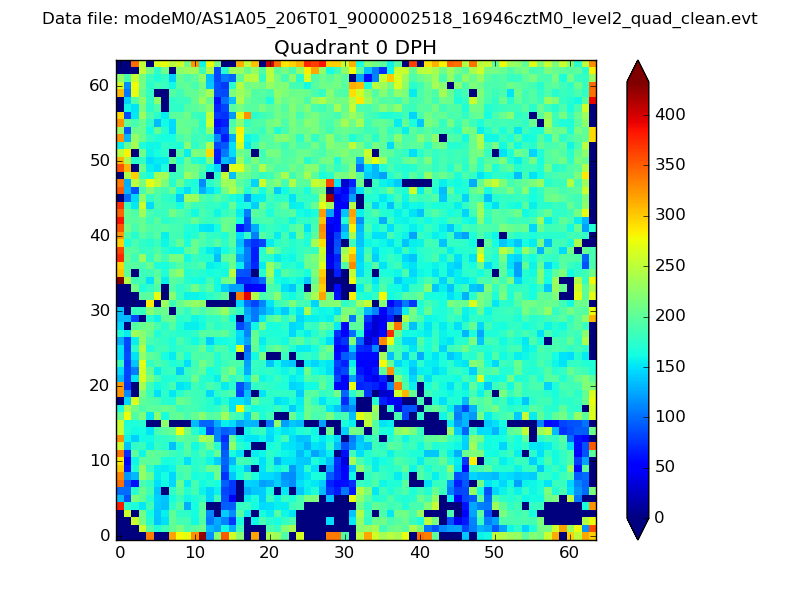 |
 |
Quadrant B |
|---|---|---|---|
| Quadrant D | 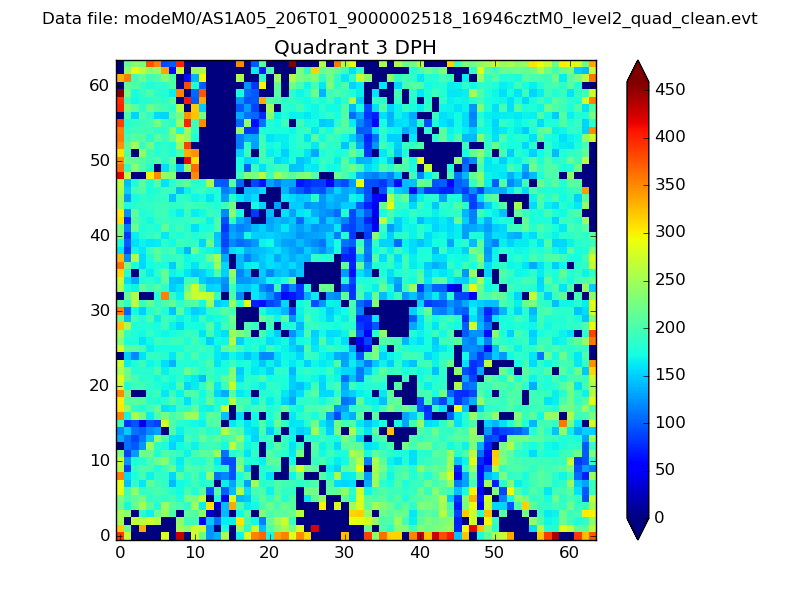 |
 |
Quadrant C |
| Plot type | Count rate plots | Images |
|---|---|---|
| Comparison with Poisson distribution Blue bars denote a histogram of data divided into 1 sec bins. Red curve is a Poisson curve with rate = median count rate of data. |
 |
 |
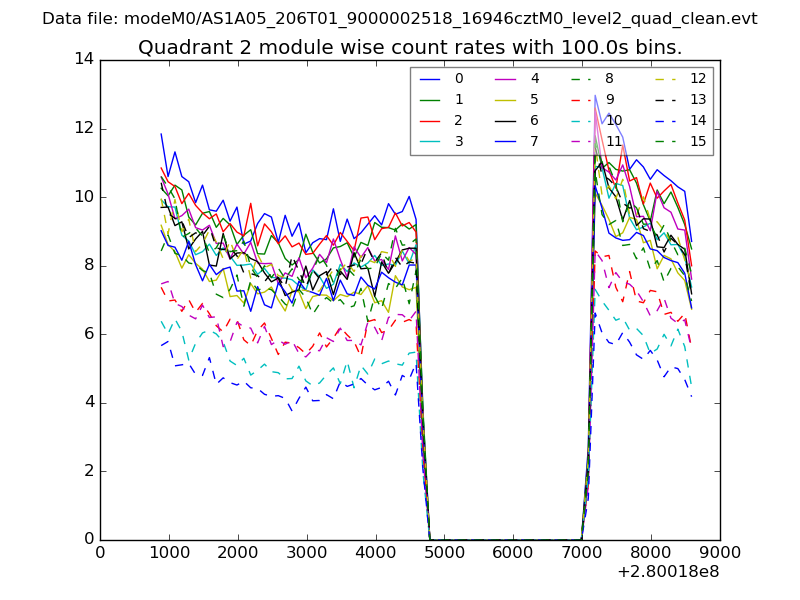
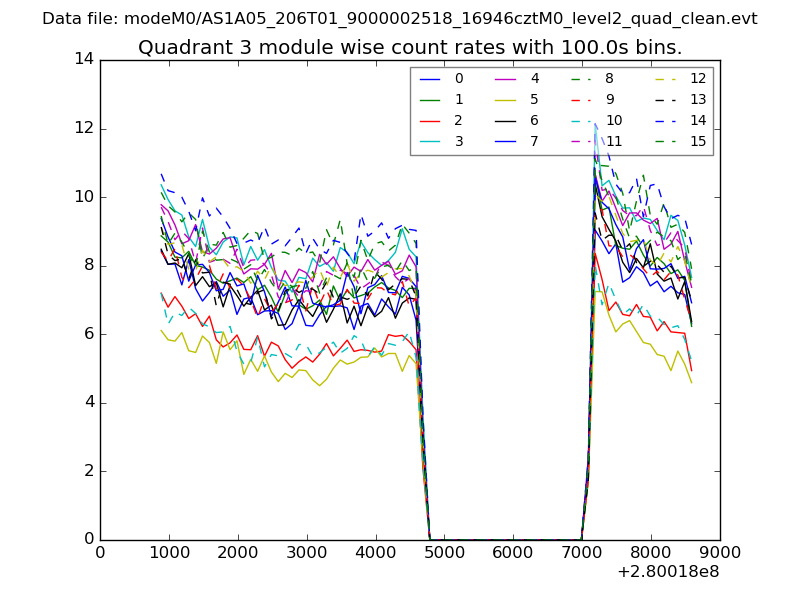
| Quadrant-wise count rates Data is divided into 100 sec bins |
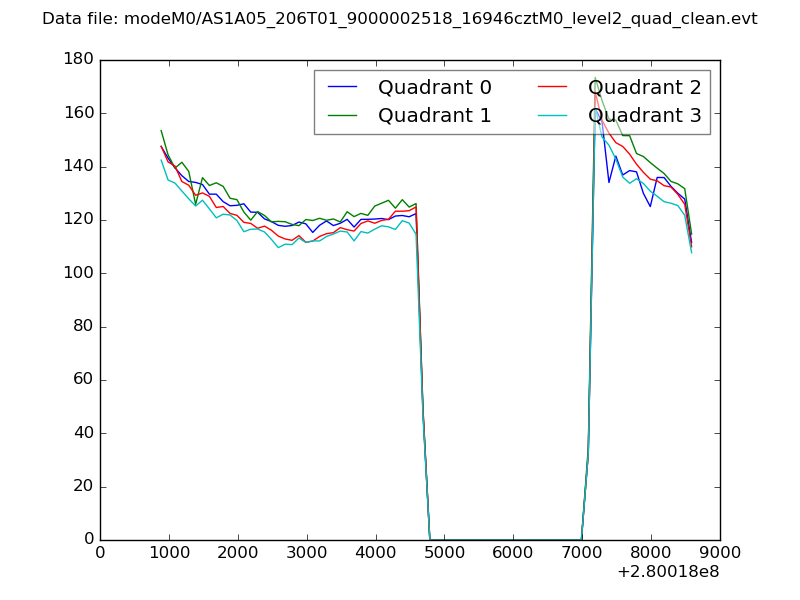 |
|
| Module-wise count rates for Quadrant A Data is divided into 100 sec bins |
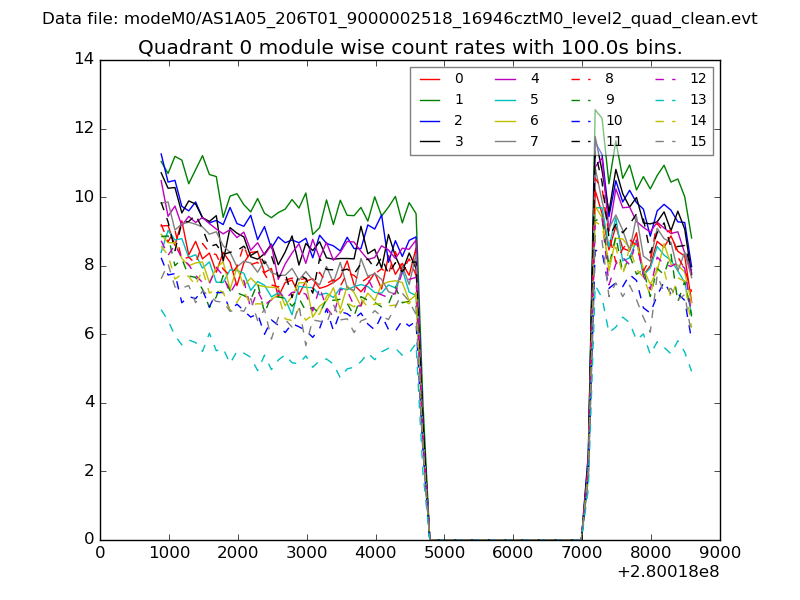 |
 |
| Module-wise count rates for Quadrant B Data is divided into 100 sec bins |
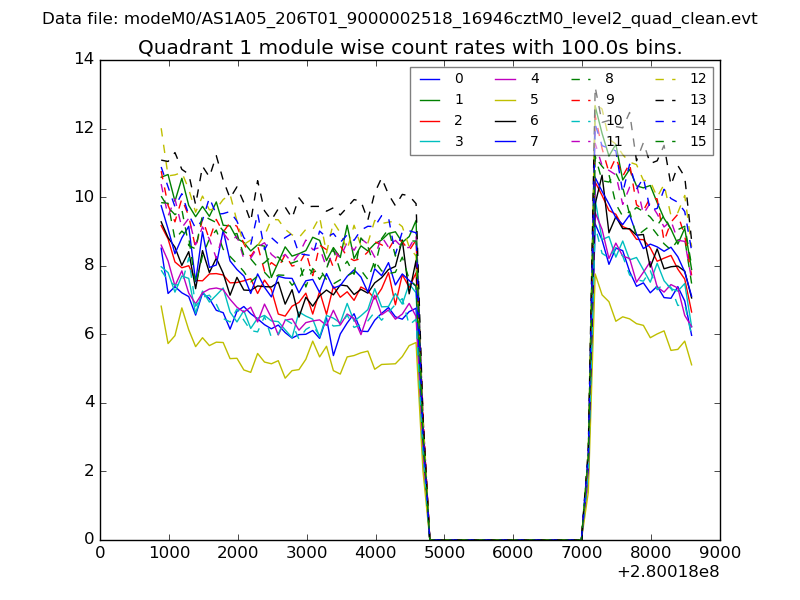 |
 |
| Module-wise count rates for Quadrant C Data is divided into 100 sec bins |
 |
 |
| Module-wise count rates for Quadrant D Data is divided into 100 sec bins |
 |
 |
| Parameter | Plot |
|---|---|
| CZT HV Monitor | 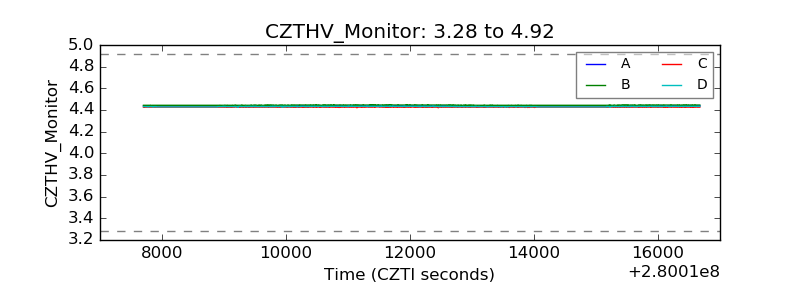 |
| D_VDD | 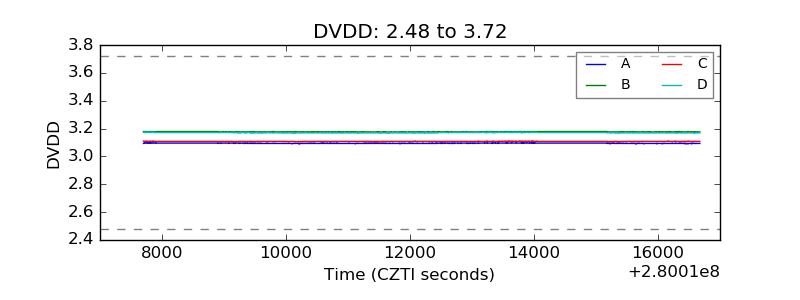 |
| Temperature 1 | 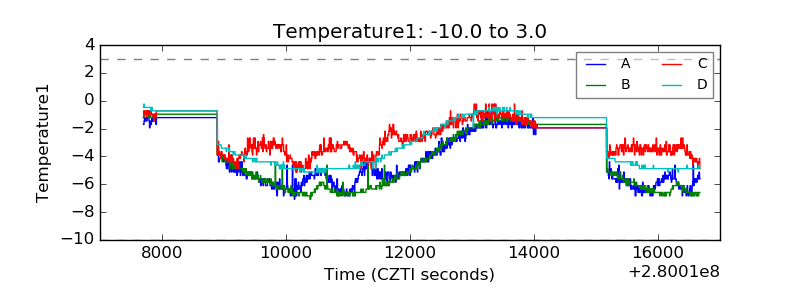 |
| Veto HV Monitor | 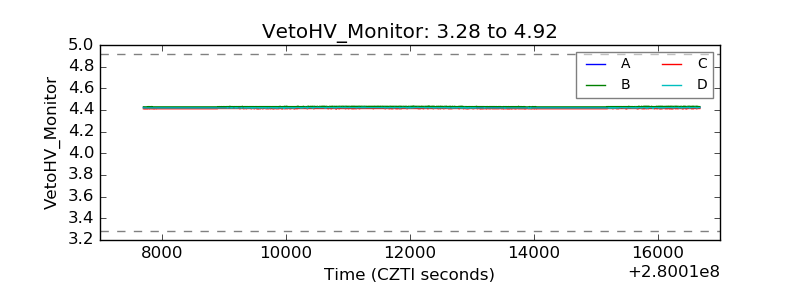 |
| Veto LLD | 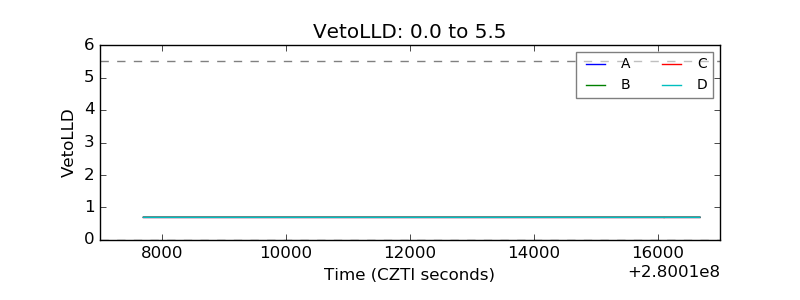 |
| Alpha Counter | 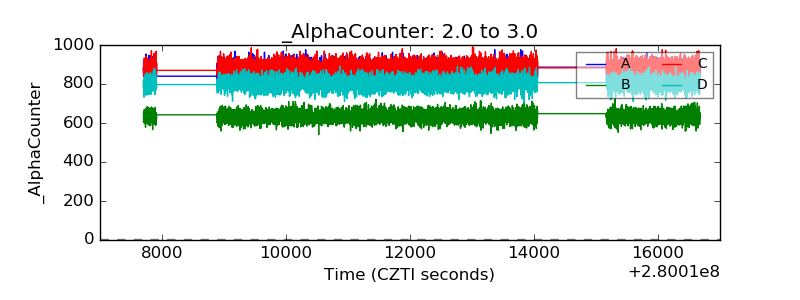 |
| _CPM_Rate | 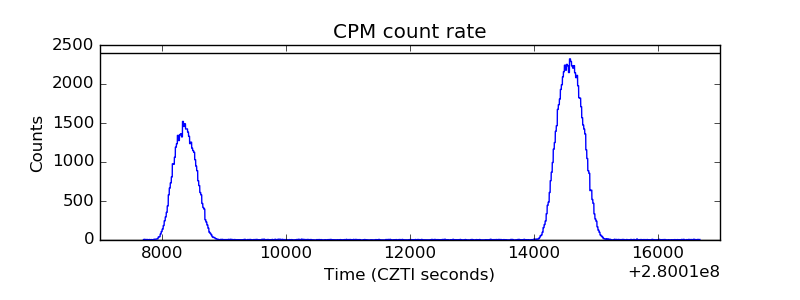 |
| CZT Counter | 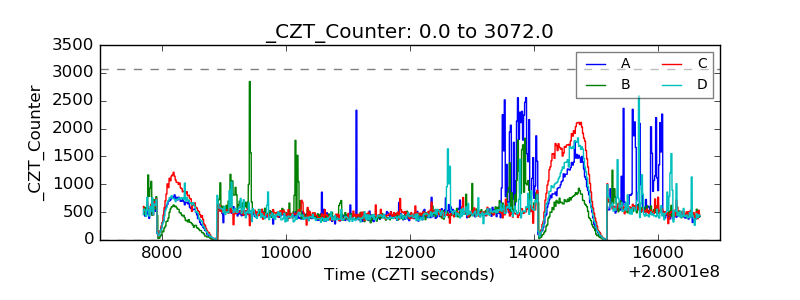 |
| +2.5 Volts monitor |  |
| +5 Volts monitor | 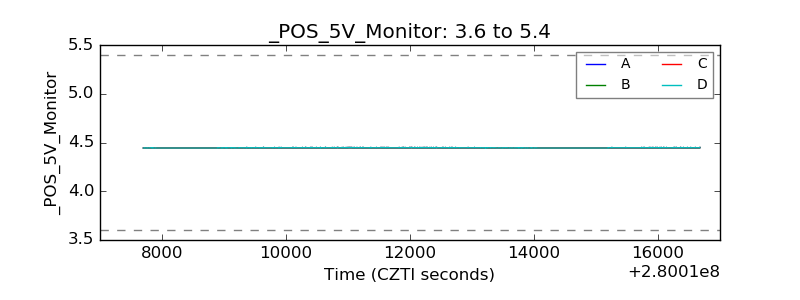 |
| _ROLL_ROT |  |
| _Roll_DEC | 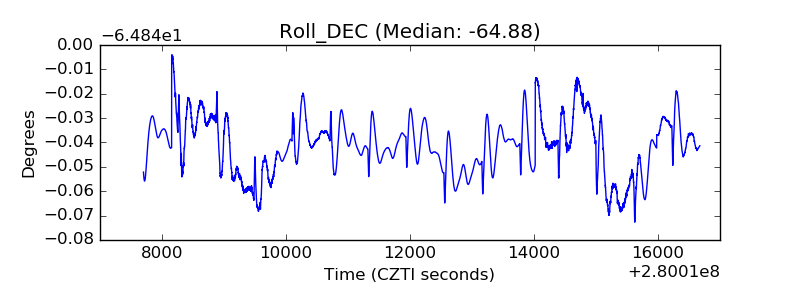 |
| _Roll_RA | 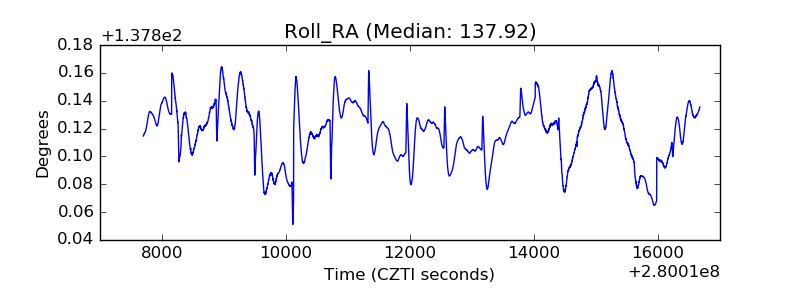 |
| Veto Counter | 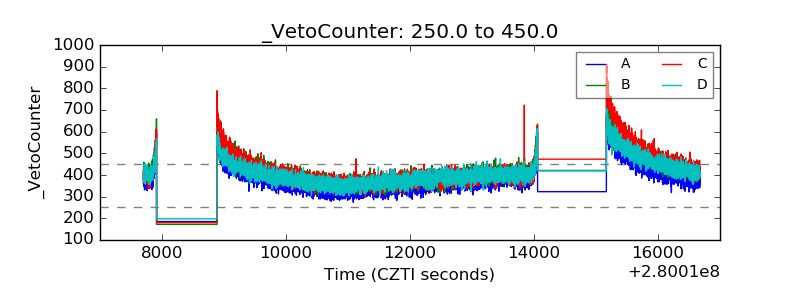 |