| Param | Original file | Final file |
|---|---|---|
| Filename | modeM0/AS1A05_206T01_9000002518_16949cztM0_level2.evt | modeM0/AS1A05_206T01_9000002518_16949cztM0_level2_quad_clean.evt |
| Size (bytes) | 427,608,000 | 99,020,160 |
| Size | 407.8 MB | 94.4 MB |
| Events in quadrant A | 3,388,238 | 644,799 |
| Events in quadrant B | 3,150,859 | 668,671 |
| Events in quadrant C | 2,995,675 | 650,008 |
| Events in quadrant D | 3,026,220 | 634,983 |
| Mode SS | |||
|---|---|---|---|
| Quadrant | BADHDUFLAG | Total packets | Discarded packets |
| A | 0 | 116 | 0 |
| B | 0 | 116 | 0 |
| C | 0 | 116 | 0 |
| D | 0 | 116 | 0 |
| Mode M0 | |||
|---|---|---|---|
| Quadrant | BADHDUFLAG | Total packets | Discarded packets |
| A | 0 | 13643 | 1 |
| B | 0 | 12735 | 1 |
| C | 0 | 12178 | 1 |
| D | 0 | 12412 | 1 |
| Mode M9 | |||
|---|---|---|---|
| Quadrant | BADHDUFLAG | Total packets | Discarded packets |
| A | 0 | 13 | 0 |
| B | 0 | 13 | 0 |
| C | 0 | 13 | 0 |
| D | 0 | 13 | 0 |
| Quadrant | Total seconds | Saturated seconds | Saturation percentage |
|---|---|---|---|
| A | 5728 | 89 | 1.553771% |
| B | 5729 | 61 | 1.064758% |
| C | 5729 | 61 | 1.064758% |
| D | 5729 | 28 | 0.488741% |
Noise dominated data is calculated using 1-second bins in cleaned event files. If a bin has >2000 counts, and if more than 50% of those come from <1% of pixels, then it is considered to be noise-dominated and hence unusable.
| Quadrant | # 1 sec bins | Bins with >0 counts | Bins with >2000 counts | High rate bins dominated by noise | Noise dominated (total time) | Noise dominated (detector-on time) | Marked lightcurve |
|---|---|---|---|---|---|---|---|
| A | 7054 | 5730 | 42 | 42 | 0.60% | 0.73% | 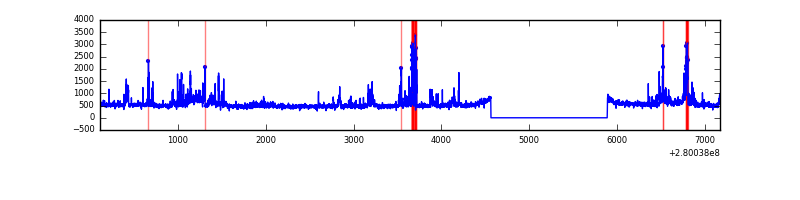 |
| B | 7055 | 5731 | 16 | 16 | 0.23% | 0.28% | 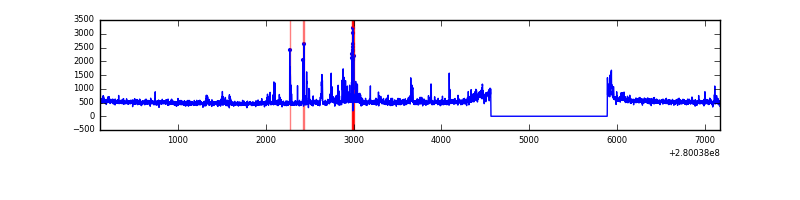 |
| C | 7055 | 5731 | 0 | 0 | 0.00% | 0.00% | 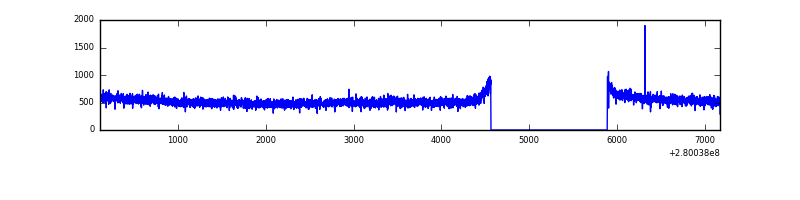 |
| D | 7055 | 5731 | 8 | 8 | 0.11% | 0.14% | 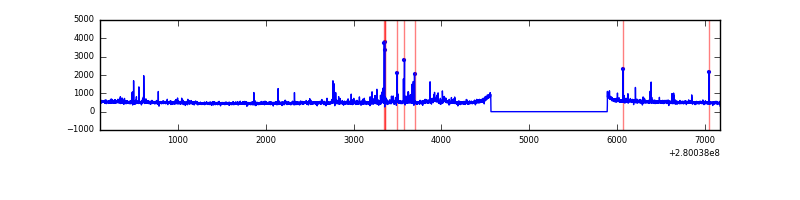 |
Top three noisy pixels from each quadrant. If the there are fewer than three noisy pixels in the level2.evt file, extra rows are filled as -1
| Pixel properties | Quadrant properties | ||||||
|---|---|---|---|---|---|---|---|
| Quadrant | DetID | PixID | Counts | Sigma | Mean | Median | Sigma |
| A | 15 | 174 | 543243 | 3740.86 | 727 | 713 | 145.0 |
| A | 4 | 2 | 23696 | 158.47 | 727 | 713 | 145.0 |
| A | 0 | 23 | 14022 | 91.77 | 727 | 713 | 145.0 |
| B | 15 | 35 | 79893 | 589.65 | 730 | 713 | 134.3 |
| B | 7 | 220 | 65735 | 484.22 | 730 | 713 | 134.3 |
| B | 0 | 229 | 49716 | 364.92 | 730 | 713 | 134.3 |
| C | 14 | 238 | 111086 | 664.29 | 723 | 729 | 166.1 |
| C | 3 | 233 | 60062 | 357.15 | 723 | 729 | 166.1 |
| C | 13 | 61 | 4897 | 25.09 | 723 | 729 | 166.1 |
| D | 10 | 199 | 90702 | 517.79 | 731 | 710 | 173.8 |
| D | 1 | 52 | 61656 | 350.67 | 731 | 710 | 173.8 |
| D | 15 | 0 | 45584 | 258.19 | 731 | 710 | 173.8 |
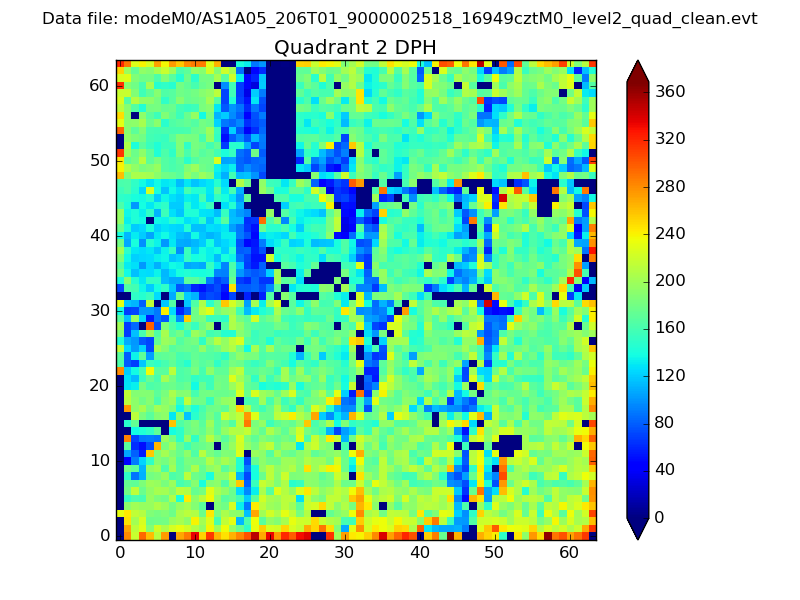
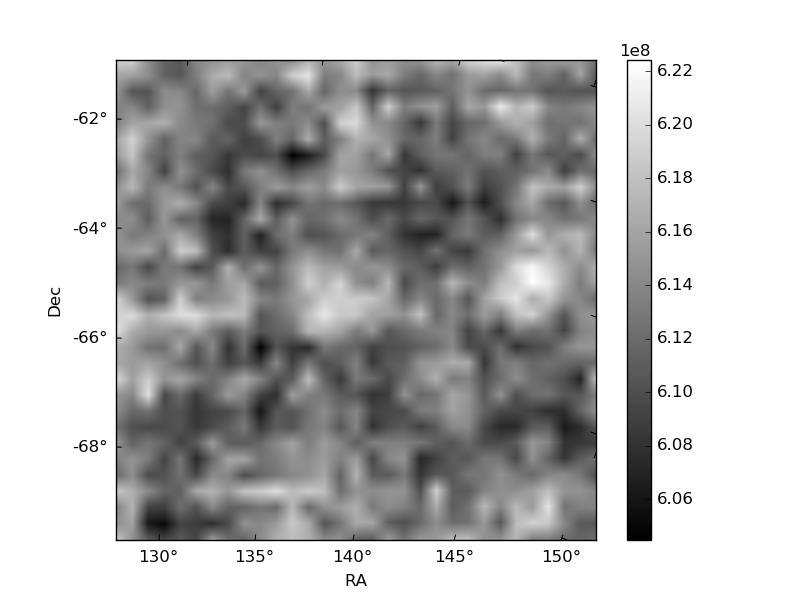
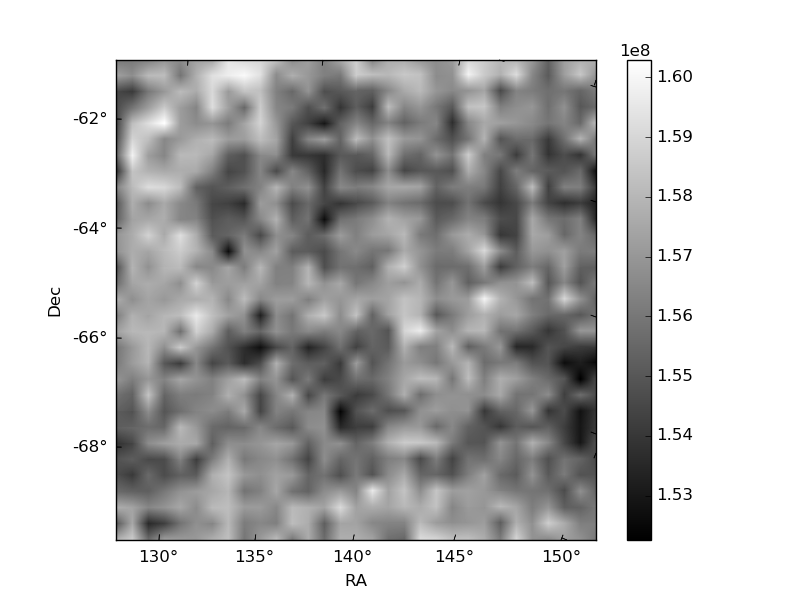
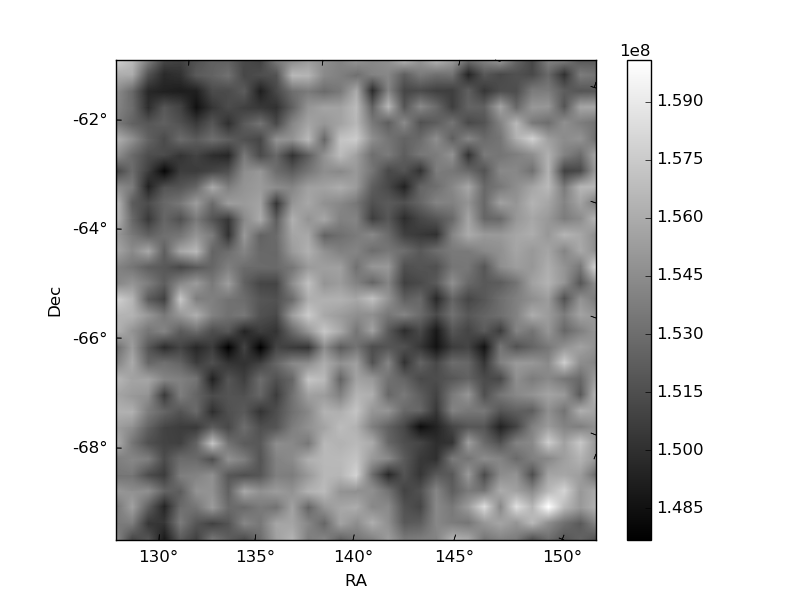
Histogram calculated using DETX and DETY for each event in the final _common_clean file
| Quadrant A | 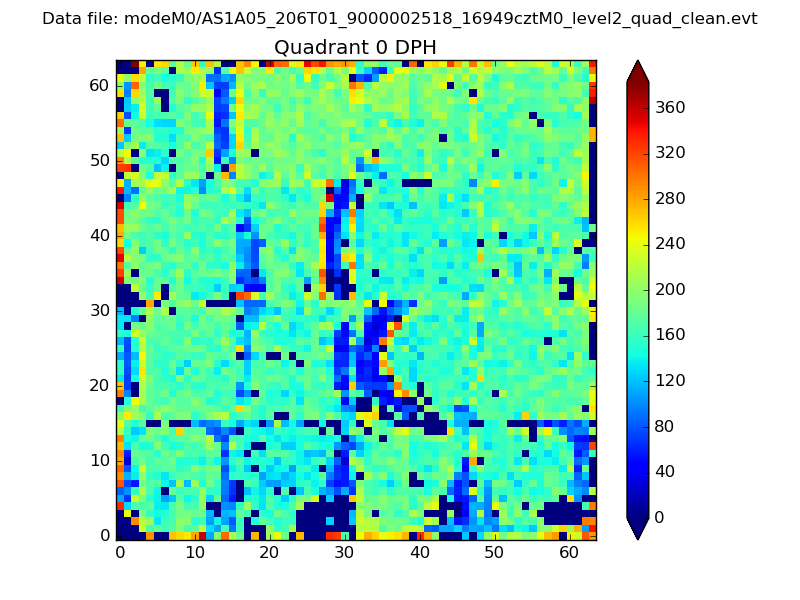 |
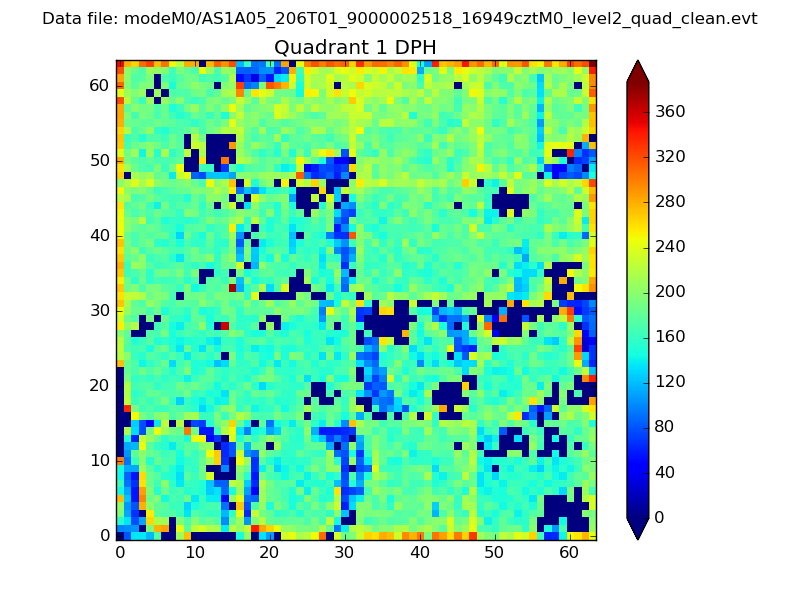 |
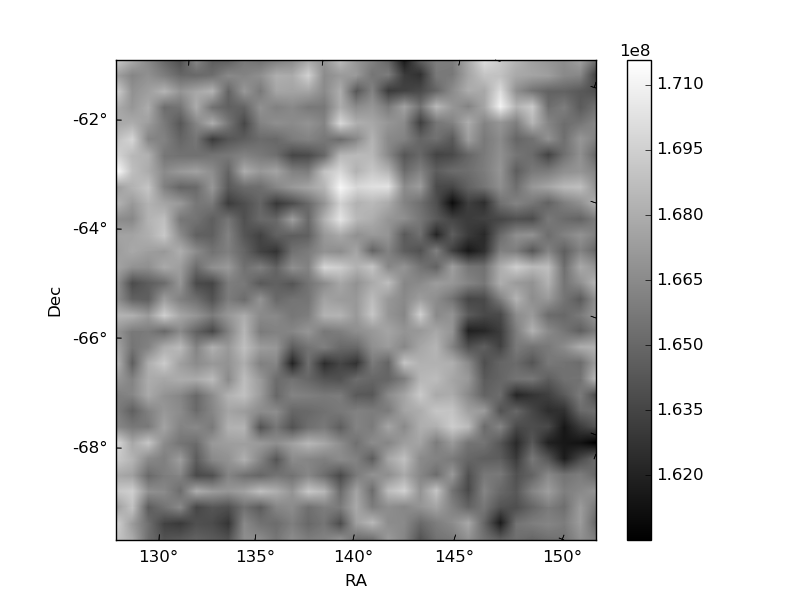
Quadrant B |
|---|---|---|---|
| Quadrant D | 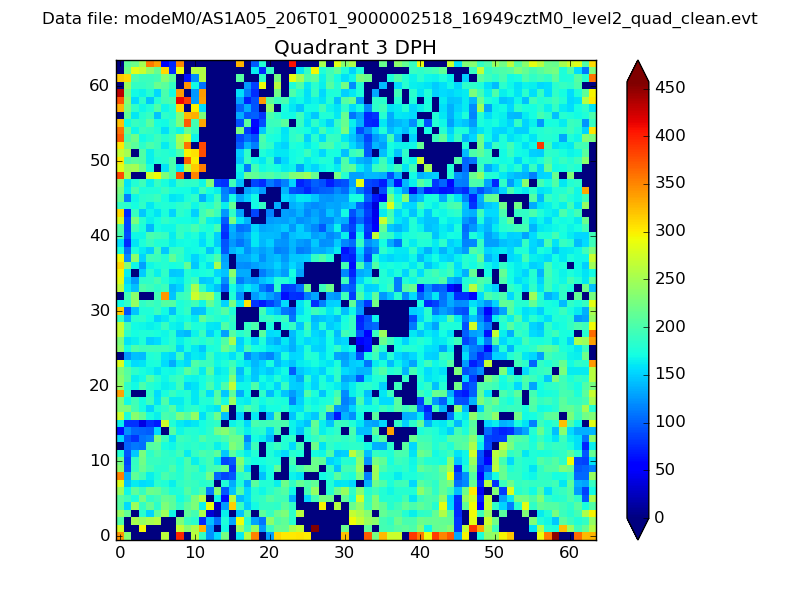 |
 |
Quadrant C |
| Plot type | Count rate plots | Images |
|---|---|---|
| Comparison with Poisson distribution Blue bars denote a histogram of data divided into 1 sec bins. Red curve is a Poisson curve with rate = median count rate of data. |
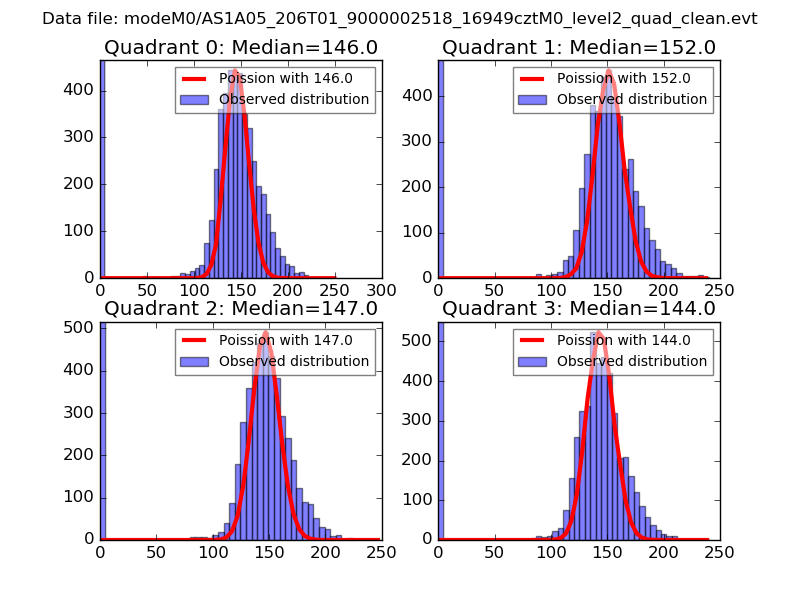 |
 |
| Quadrant-wise count rates Data is divided into 100 sec bins |
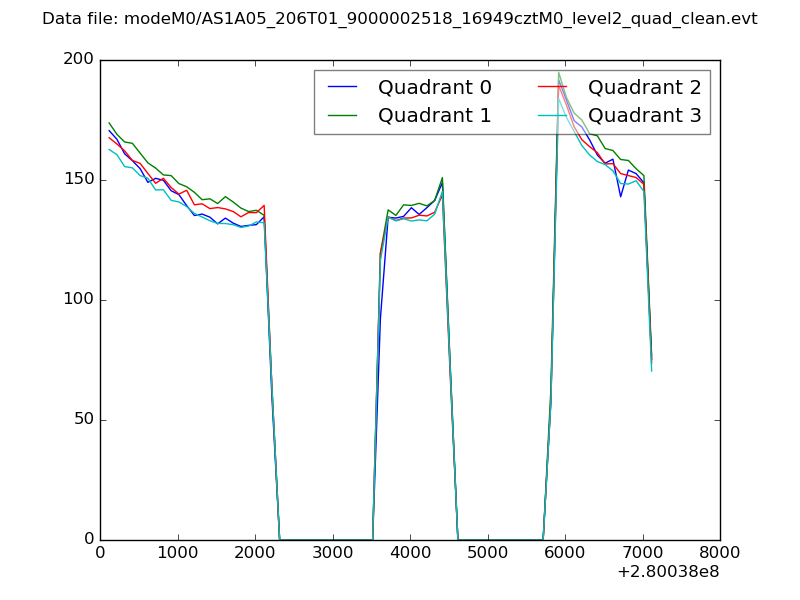 |
|
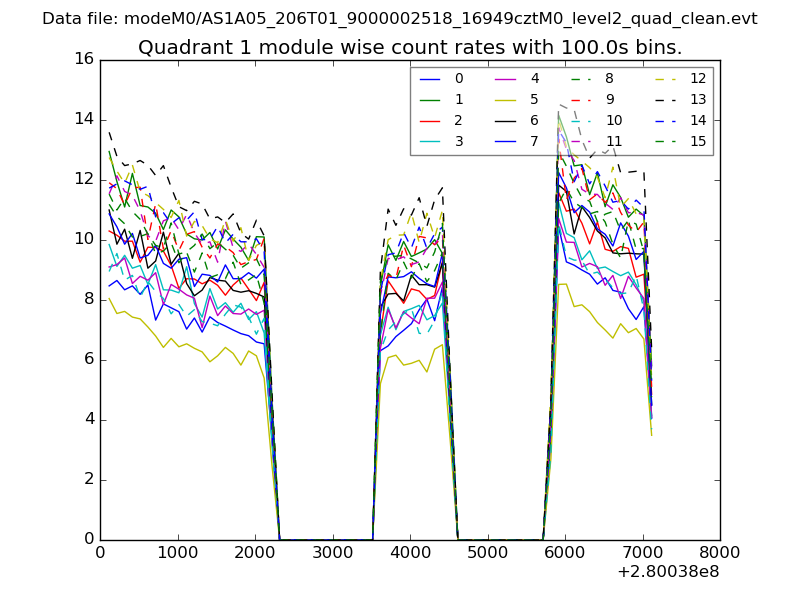
| Module-wise count rates for Quadrant A Data is divided into 100 sec bins |
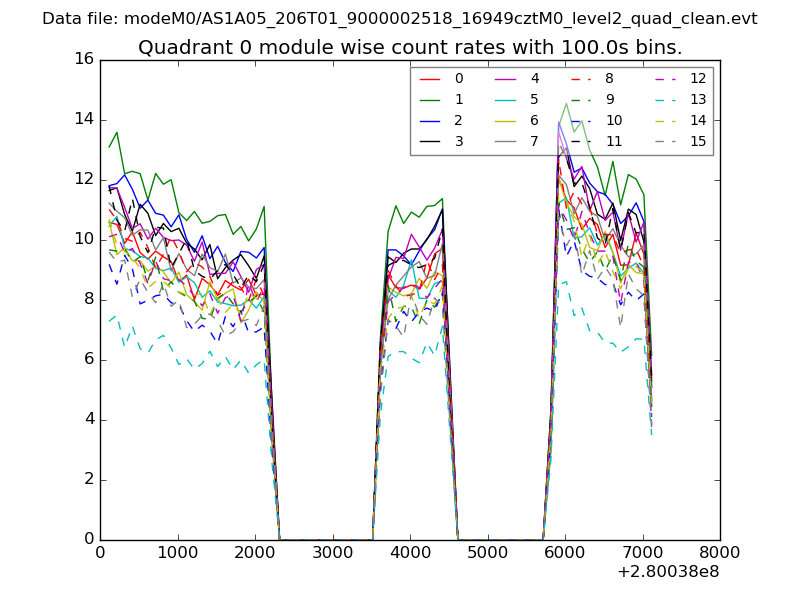 |
 |
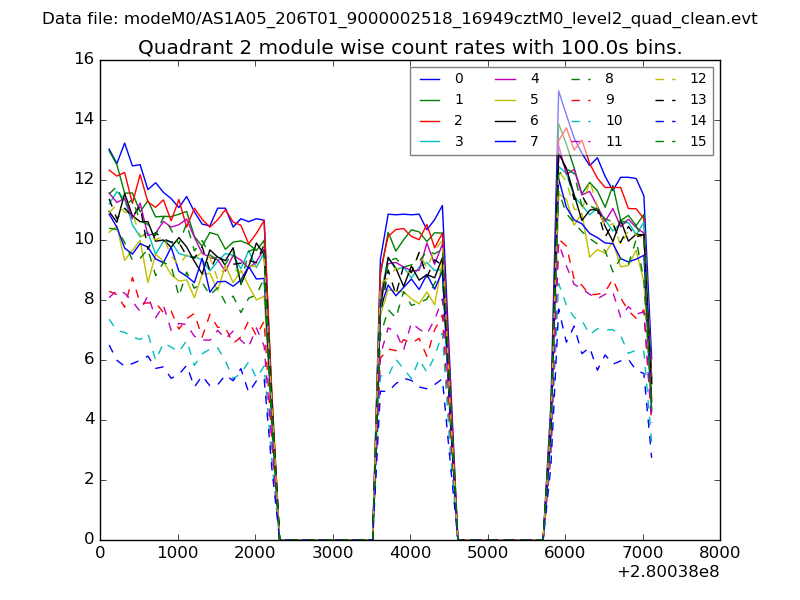
| Module-wise count rates for Quadrant B Data is divided into 100 sec bins |
 |
 |
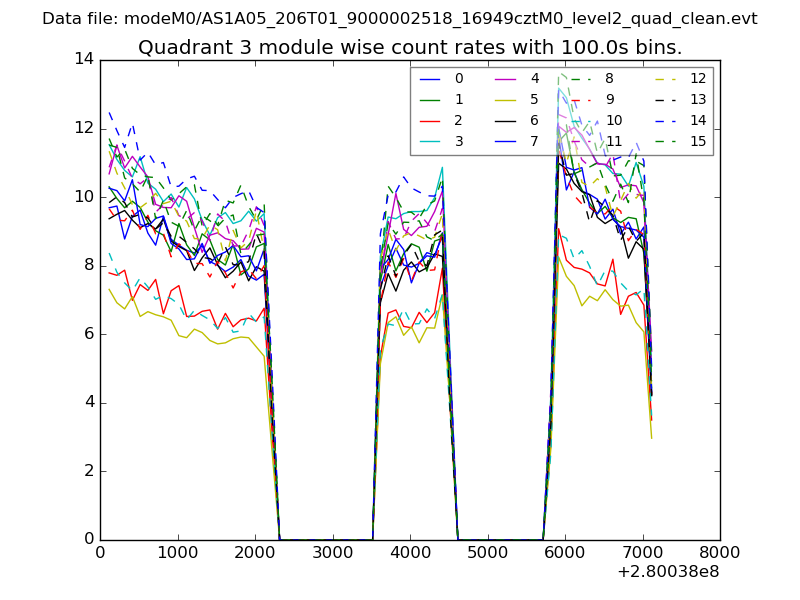
| Module-wise count rates for Quadrant C Data is divided into 100 sec bins |
 |
 |
| Module-wise count rates for Quadrant D Data is divided into 100 sec bins |
 |
 |
| Parameter | Plot |
|---|---|
| CZT HV Monitor | 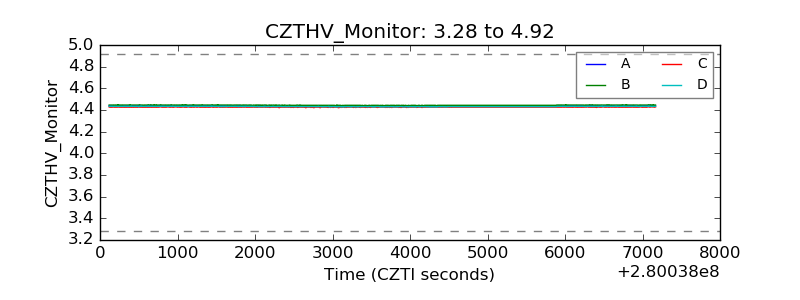 |
| D_VDD | 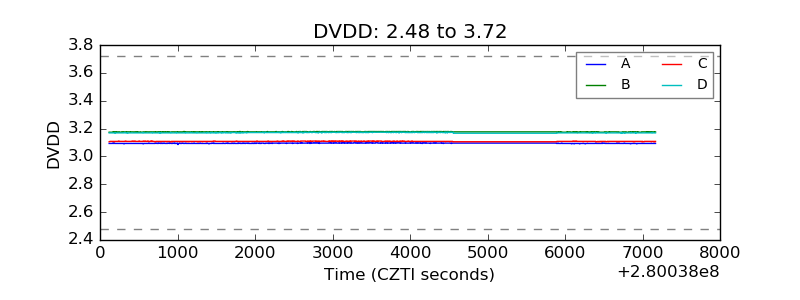 |
| Temperature 1 | 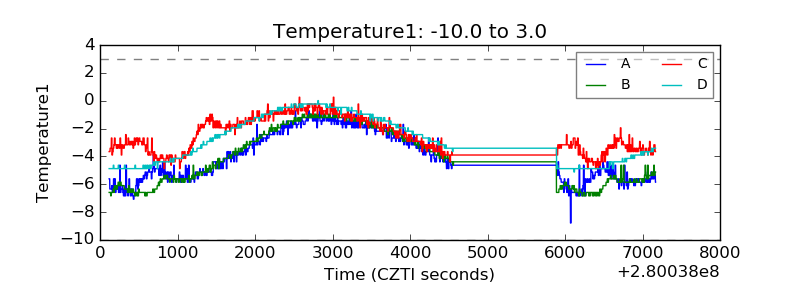 |
| Veto HV Monitor | 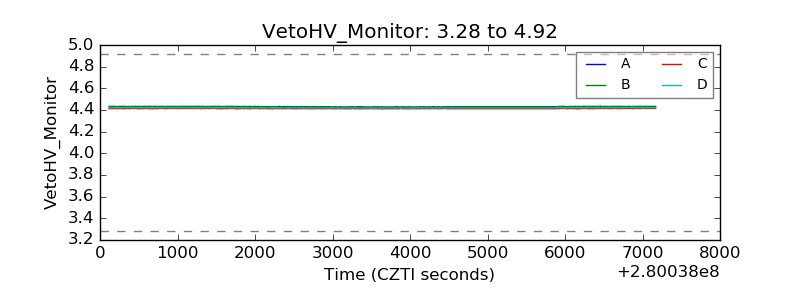 |
| Veto LLD | 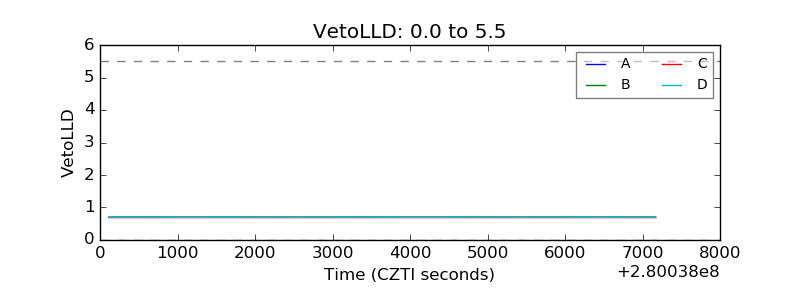 |
| Alpha Counter | 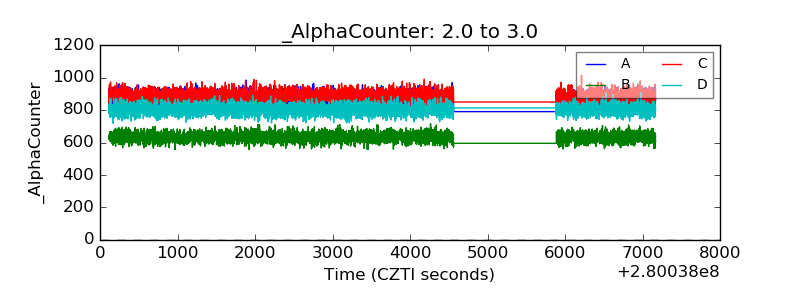 |
| _CPM_Rate | 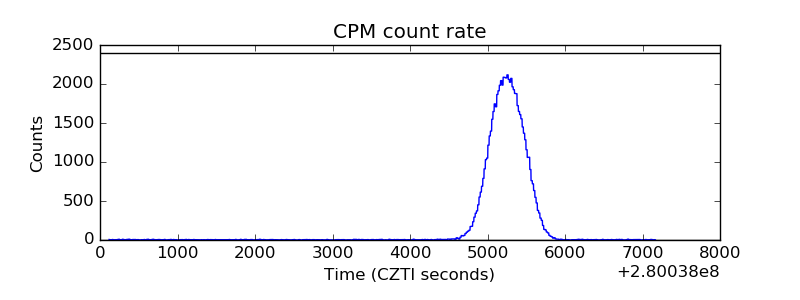 |
| CZT Counter | 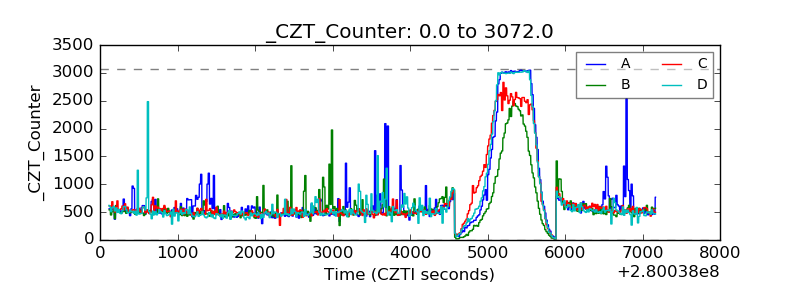 |
| +2.5 Volts monitor |  |
| +5 Volts monitor |  |
| _ROLL_ROT | 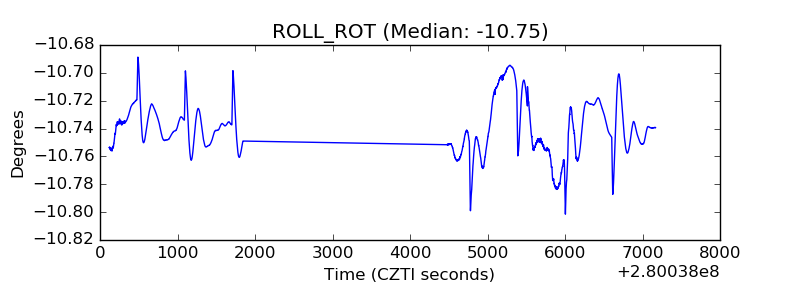 |
| _Roll_DEC | 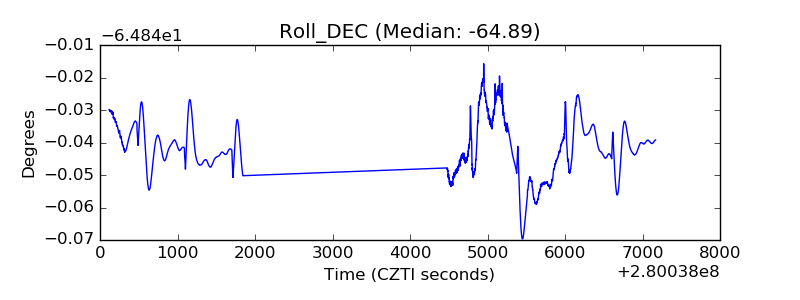 |
| _Roll_RA | 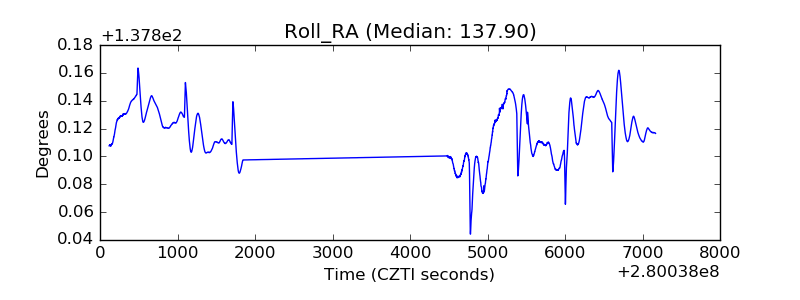 |
| Veto Counter | 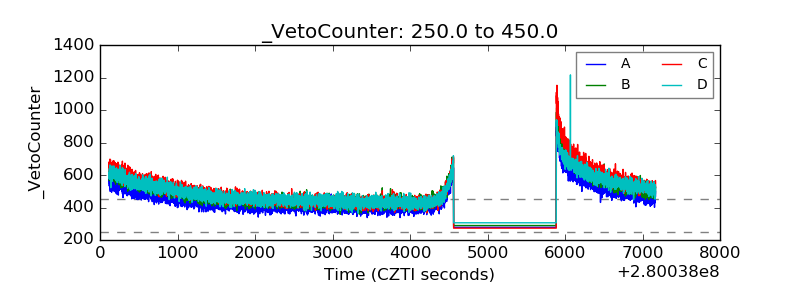 |