| Param | Original file | Final file |
|---|---|---|
| Filename | modeM0/AS1A05_206T01_9000002518_16950cztM0_level2.evt | modeM0/AS1A05_206T01_9000002518_16950cztM0_level2_quad_clean.evt |
| Size (bytes) | 460,785,600 | 101,900,160 |
| Size | 439.4 MB | 97.2 MB |
| Events in quadrant A | 4,090,617 | 661,856 |
| Events in quadrant B | 3,298,063 | 686,897 |
| Events in quadrant C | 3,117,866 | 667,561 |
| Events in quadrant D | 3,043,457 | 653,105 |
| Mode SS | |||
|---|---|---|---|
| Quadrant | BADHDUFLAG | Total packets | Discarded packets |
| A | 0 | 120 | 0 |
| B | 0 | 120 | 0 |
| C | 0 | 120 | 0 |
| D | 0 | 120 | 0 |
| Mode M0 | |||
|---|---|---|---|
| Quadrant | BADHDUFLAG | Total packets | Discarded packets |
| A | 0 | 15899 | 1 |
| B | 0 | 13384 | 1 |
| C | 0 | 12553 | 1 |
| D | 0 | 12649 | 1 |
| Mode M9 | |||
|---|---|---|---|
| Quadrant | BADHDUFLAG | Total packets | Discarded packets |
| A | 0 | 13 | 0 |
| B | 0 | 13 | 0 |
| C | 0 | 13 | 0 |
| D | 0 | 13 | 0 |
| Quadrant | Total seconds | Saturated seconds | Saturation percentage |
|---|---|---|---|
| A | 5968 | 300 | 5.026810% |
| B | 5969 | 64 | 1.072206% |
| C | 5969 | 110 | 1.842855% |
| D | 5969 | 65 | 1.088960% |
Noise dominated data is calculated using 1-second bins in cleaned event files. If a bin has >2000 counts, and if more than 50% of those come from <1% of pixels, then it is considered to be noise-dominated and hence unusable.
| Quadrant | # 1 sec bins | Bins with >0 counts | Bins with >2000 counts | High rate bins dominated by noise | Noise dominated (total time) | Noise dominated (detector-on time) | Marked lightcurve |
|---|---|---|---|---|---|---|---|
| A | 7249 | 5970 | 165 | 165 | 2.28% | 2.76% | 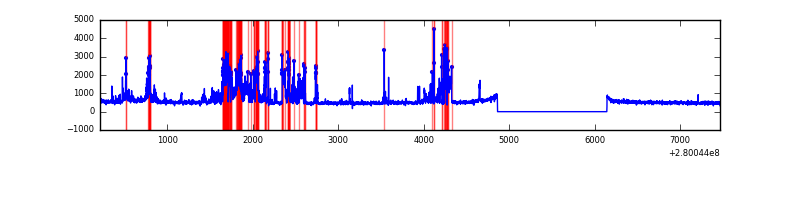 |
| B | 7250 | 5971 | 3 | 3 | 0.04% | 0.05% | 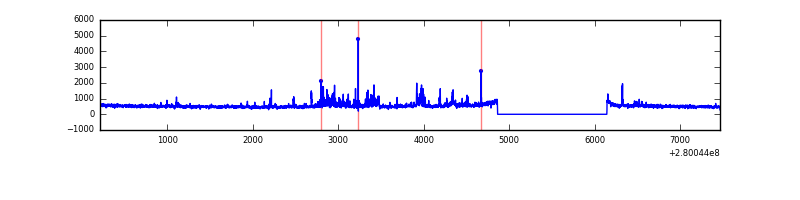 |
| C | 7250 | 5971 | 1 | 1 | 0.01% | 0.02% | 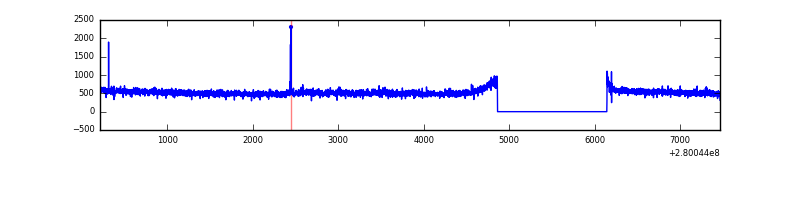 |
| D | 7250 | 5971 | 21 | 21 | 0.29% | 0.35% | 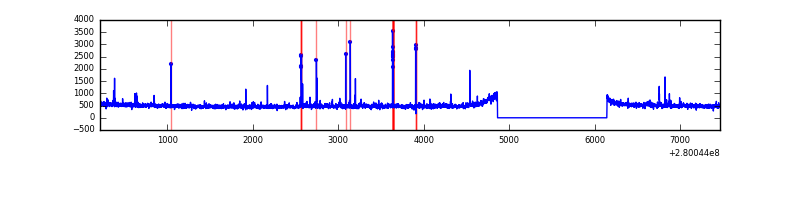 |
Top three noisy pixels from each quadrant. If the there are fewer than three noisy pixels in the level2.evt file, extra rows are filled as -1
| Pixel properties | Quadrant properties | ||||||
|---|---|---|---|---|---|---|---|
| Quadrant | DetID | PixID | Counts | Sigma | Mean | Median | Sigma |
| A | 15 | 174 | 1199767 | 8029.59 | 749 | 734 | 149.3 |
| A | 12 | 189 | 7667 | 46.43 | 749 | 734 | 149.3 |
| A | 0 | 226 | 7046 | 42.27 | 749 | 734 | 149.3 |
| B | 15 | 35 | 137796 | 980.47 | 755 | 737 | 139.8 |
| B | 7 | 220 | 100437 | 713.21 | 755 | 737 | 139.8 |
| B | 0 | 189 | 32172 | 224.87 | 755 | 737 | 139.8 |
| C | 14 | 238 | 117330 | 677.17 | 744 | 753 | 172.2 |
| C | 3 | 233 | 89210 | 513.83 | 744 | 753 | 172.2 |
| C | 5 | 112 | 7095 | 36.84 | 744 | 753 | 172.2 |
| D | 1 | 52 | 97045 | 530.71 | 754 | 734 | 181.5 |
| D | 15 | 0 | 28340 | 152.12 | 754 | 734 | 181.5 |
| D | 2 | 234 | 21877 | 116.51 | 754 | 734 | 181.5 |
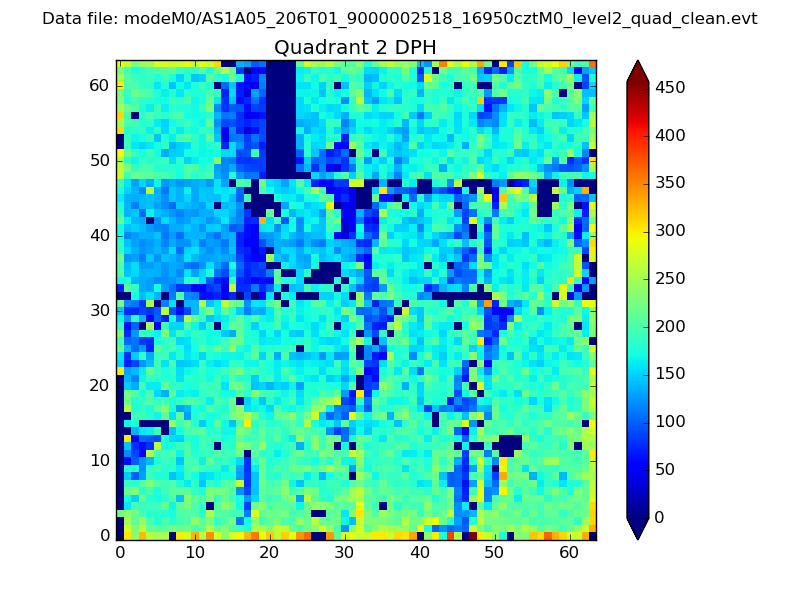
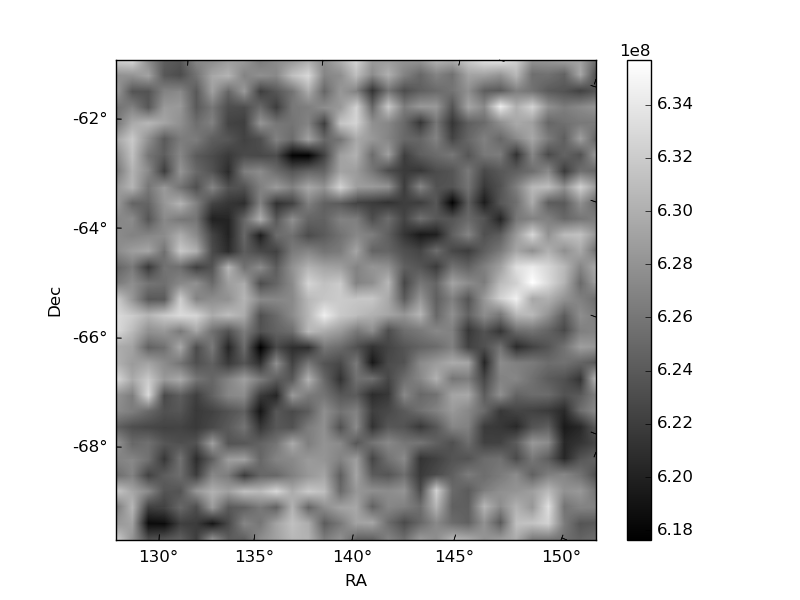
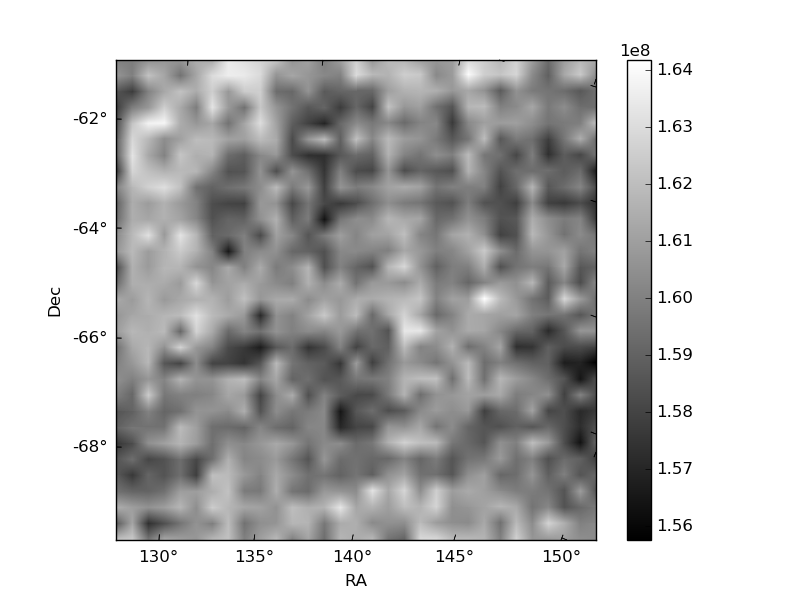
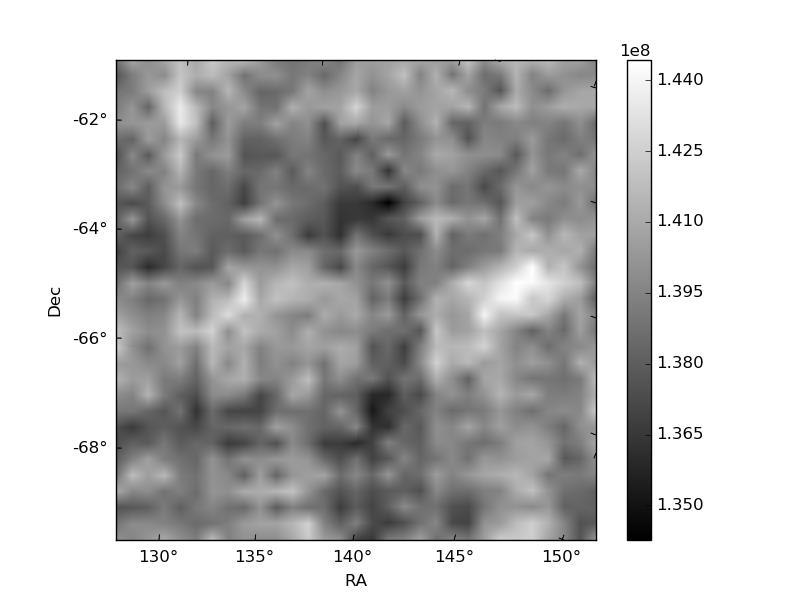
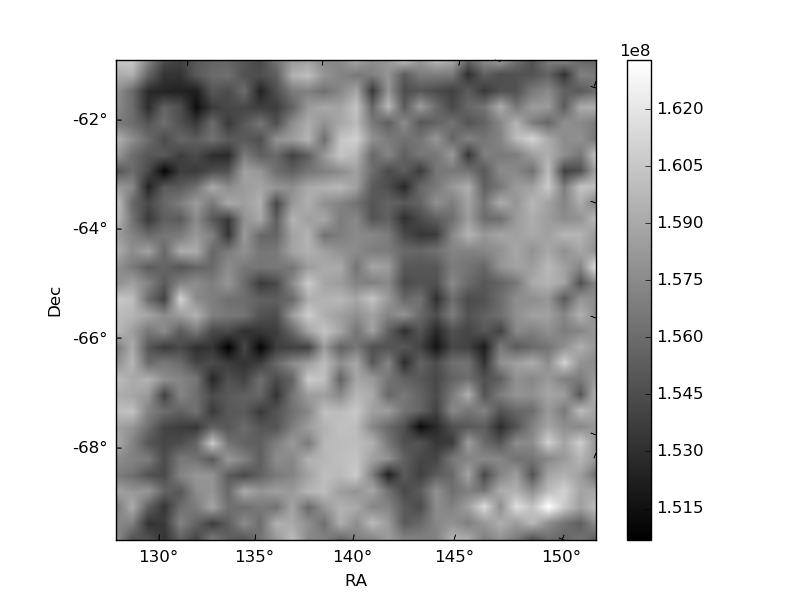
Histogram calculated using DETX and DETY for each event in the final _common_clean file
| Quadrant A | 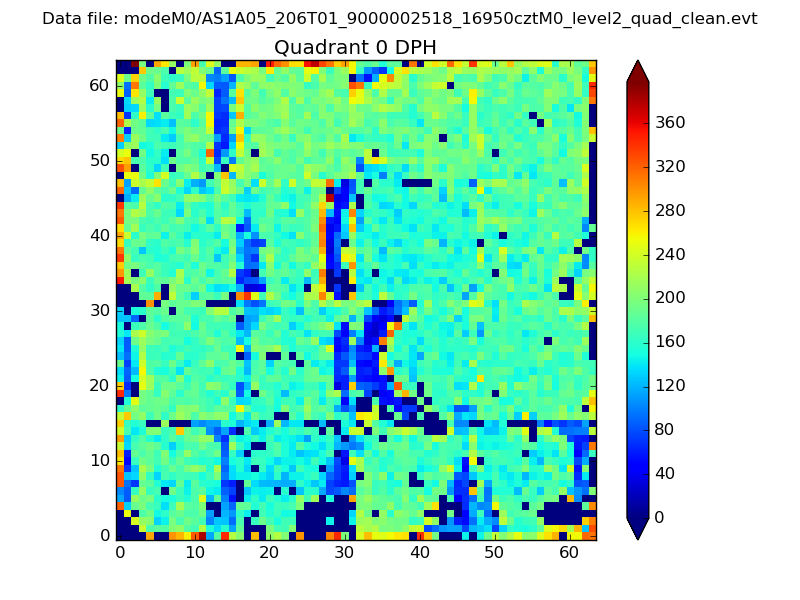 |
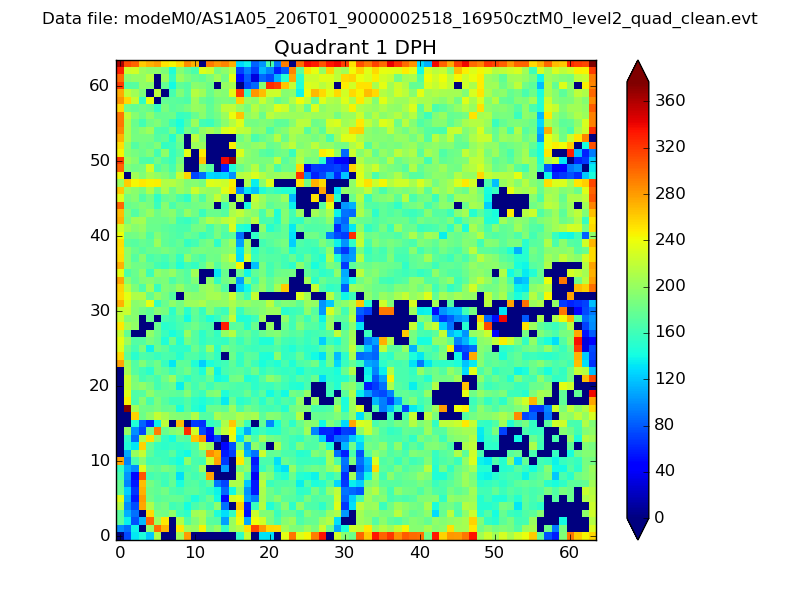 |
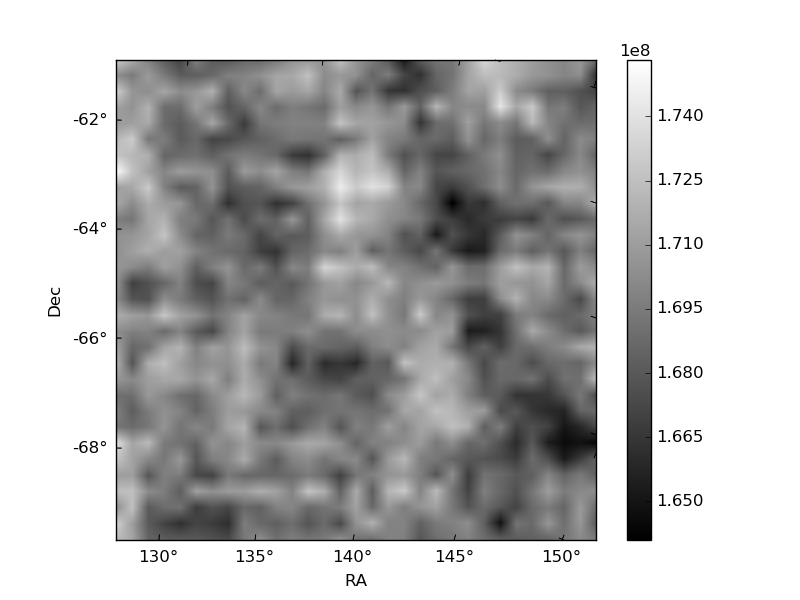
Quadrant B |
|---|---|---|---|
| Quadrant D | 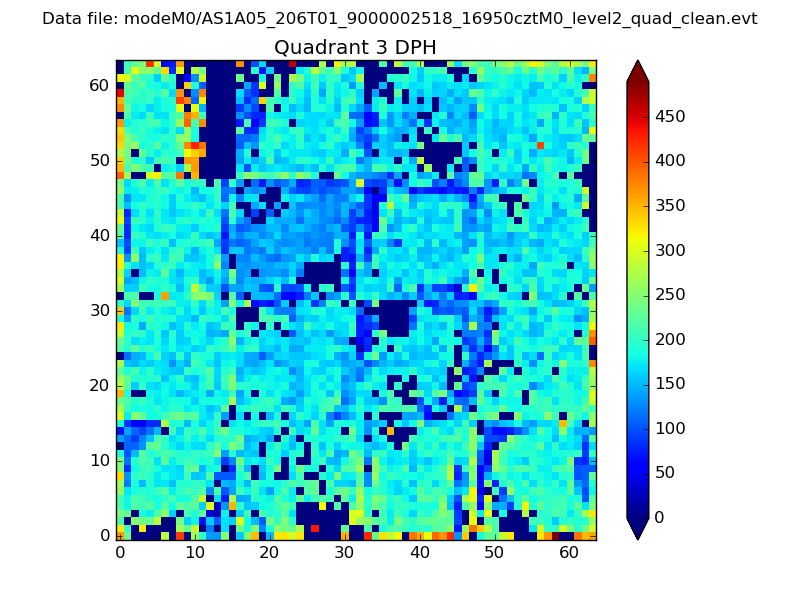 |
 |
Quadrant C |
| Plot type | Count rate plots | Images |
|---|---|---|
| Comparison with Poisson distribution Blue bars denote a histogram of data divided into 1 sec bins. Red curve is a Poisson curve with rate = median count rate of data. |
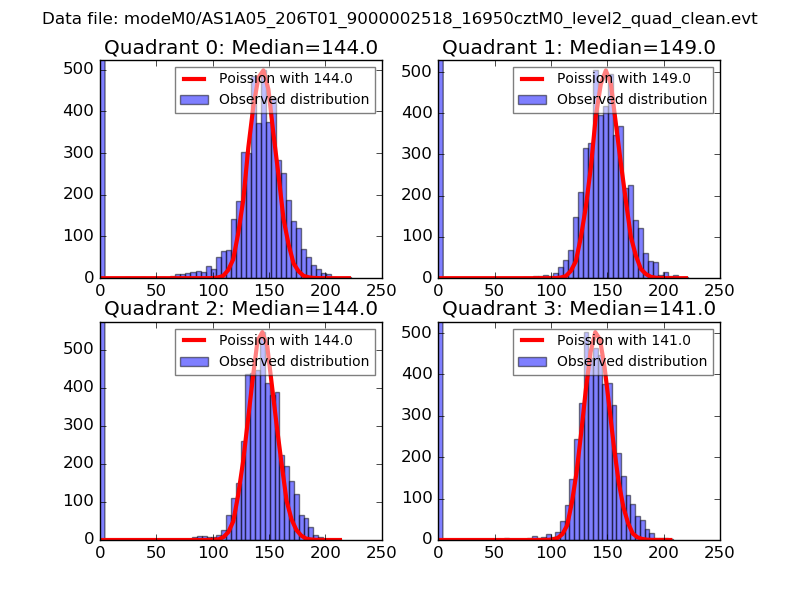 |
 |
| Quadrant-wise count rates Data is divided into 100 sec bins |
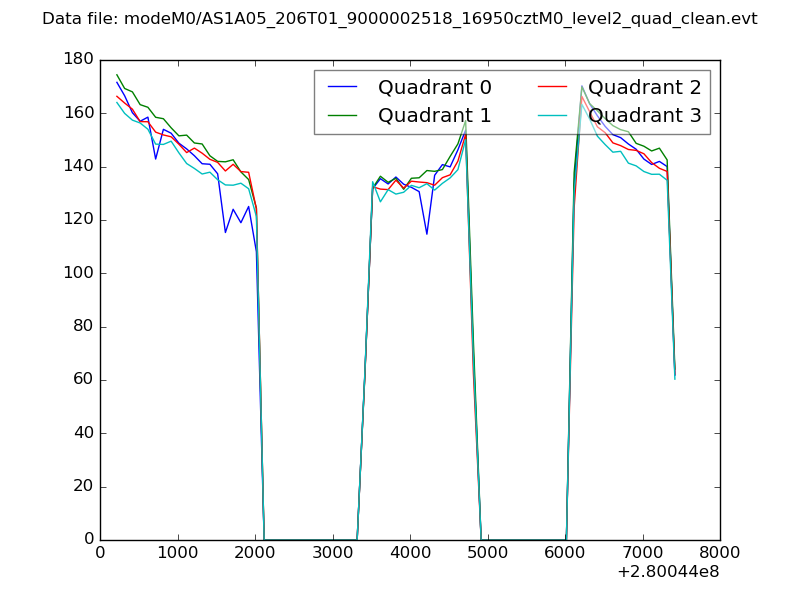 |
|
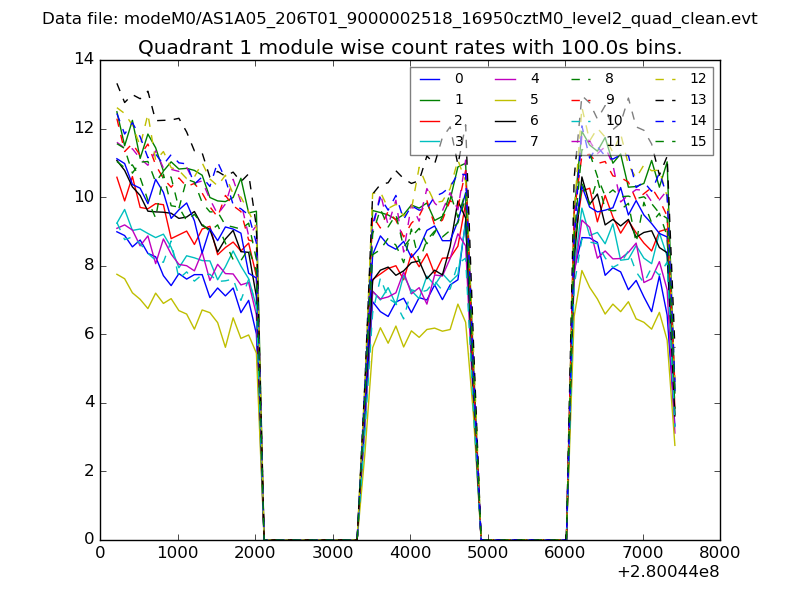
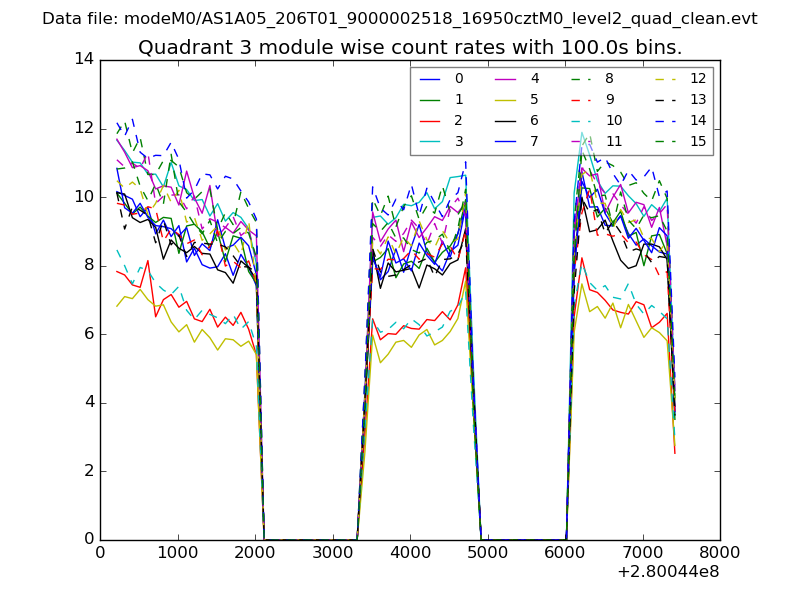
| Module-wise count rates for Quadrant A Data is divided into 100 sec bins |
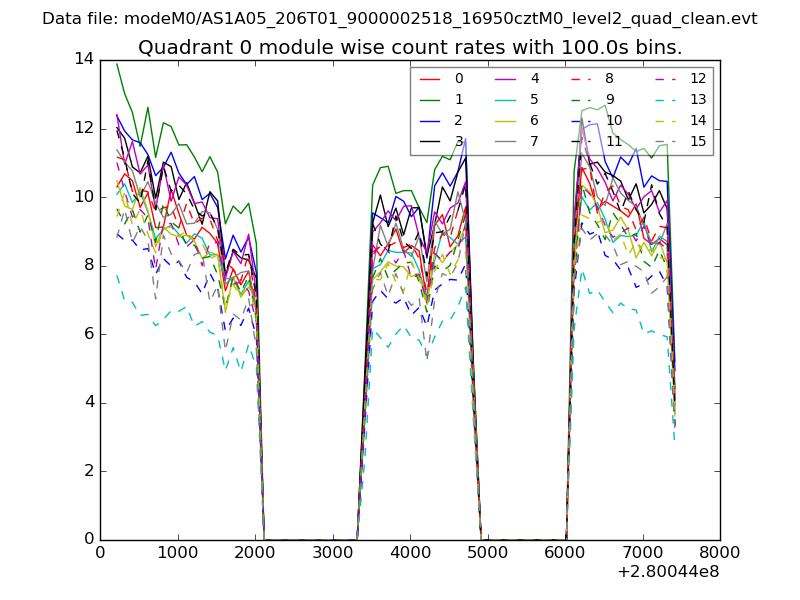 |
 |
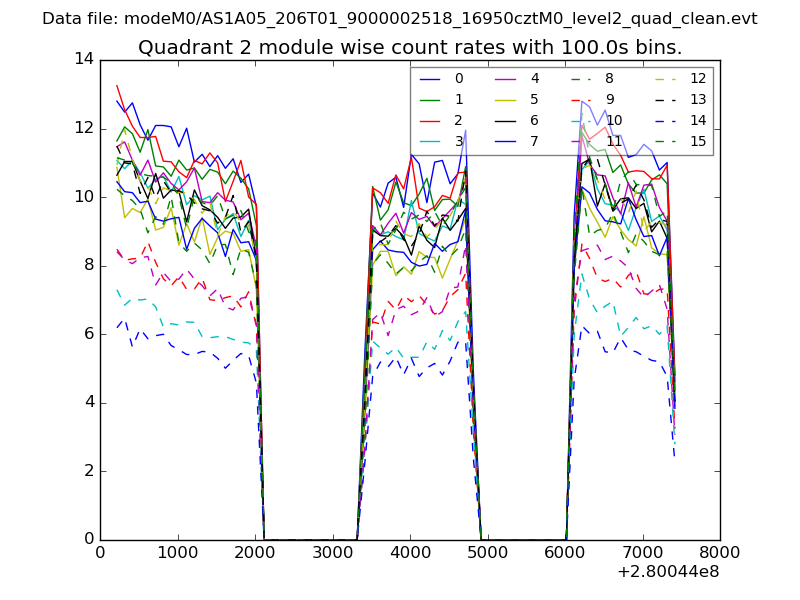
| Module-wise count rates for Quadrant B Data is divided into 100 sec bins |
 |
 |
| Module-wise count rates for Quadrant C Data is divided into 100 sec bins |
 |
 |
| Module-wise count rates for Quadrant D Data is divided into 100 sec bins |
 |
 |
| Parameter | Plot |
|---|---|
| CZT HV Monitor | 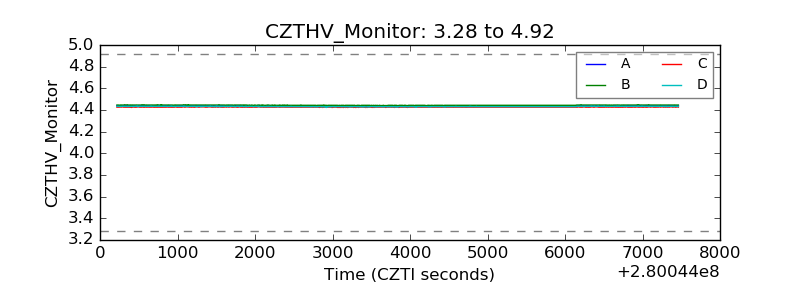 |
| D_VDD | 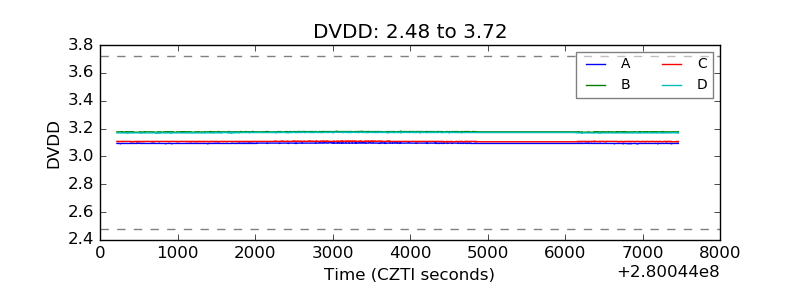 |
| Temperature 1 | 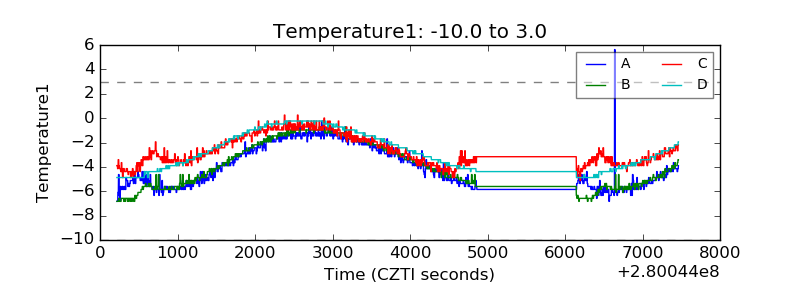 |
| Veto HV Monitor | 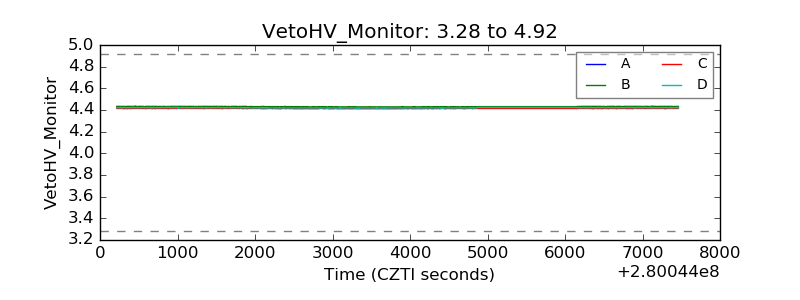 |
| Veto LLD | 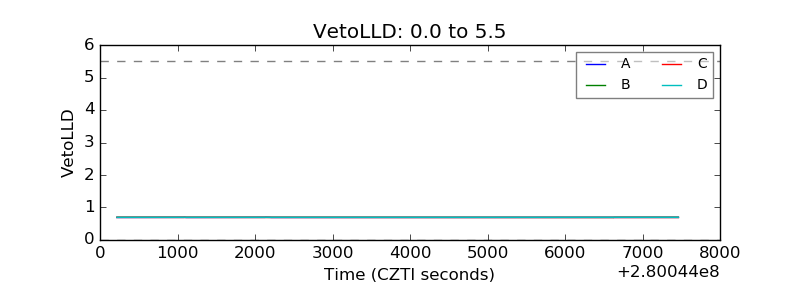 |
| Alpha Counter | 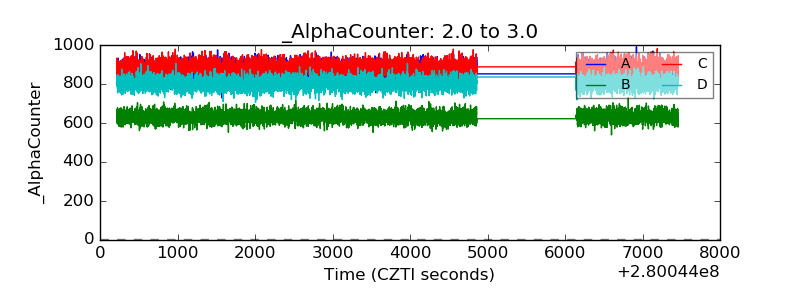 |
| _CPM_Rate | 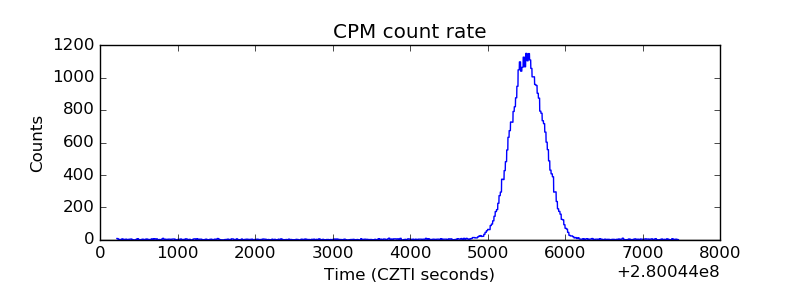 |
| CZT Counter | 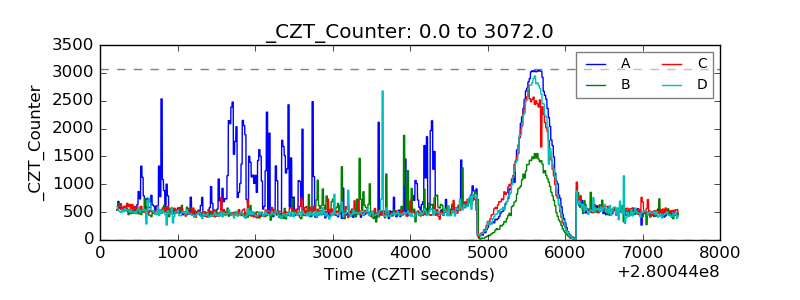 |
| +2.5 Volts monitor |  |
| +5 Volts monitor |  |
| _ROLL_ROT | 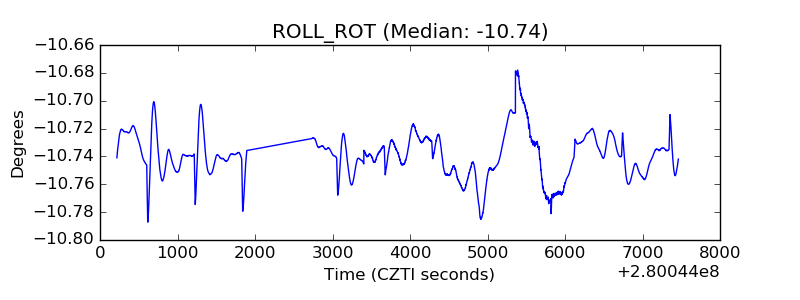 |
| _Roll_DEC | 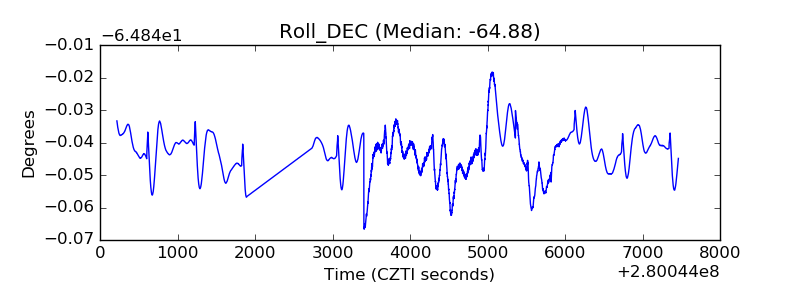 |
| _Roll_RA | 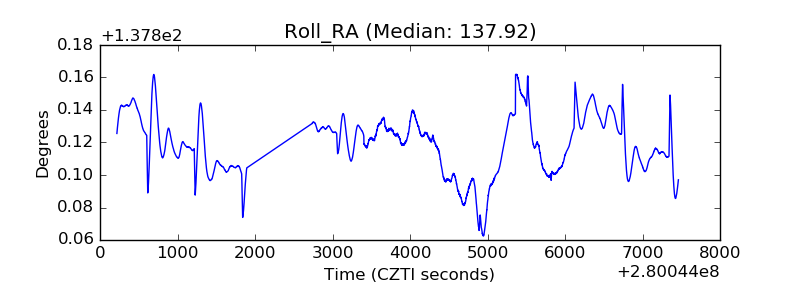 |
| Veto Counter | 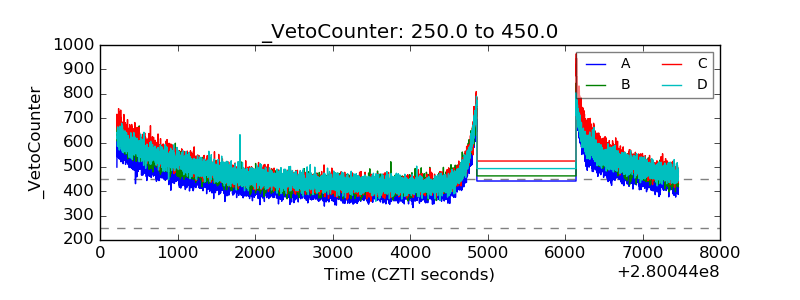 |