| Param | Original file | Final file |
|---|---|---|
| Filename | modeM0/AS1A05_206T01_9000002518_16951cztM0_level2.evt | modeM0/AS1A05_206T01_9000002518_16951cztM0_level2_quad_clean.evt |
| Size (bytes) | 448,859,520 | 99,570,240 |
| Size | 428.1 MB | 95.0 MB |
| Events in quadrant A | 2,968,489 | 652,848 |
| Events in quadrant B | 3,470,533 | 662,978 |
| Events in quadrant C | 3,050,600 | 646,662 |
| Events in quadrant D | 3,689,015 | 626,375 |
| Mode SS | |||
|---|---|---|---|
| Quadrant | BADHDUFLAG | Total packets | Discarded packets |
| A | 0 | 124 | 0 |
| B | 0 | 124 | 0 |
| C | 0 | 124 | 0 |
| D | 0 | 124 | 0 |
| Mode M0 | |||
|---|---|---|---|
| Quadrant | BADHDUFLAG | Total packets | Discarded packets |
| A | 0 | 12648 | 1 |
| B | 0 | 14045 | 1 |
| C | 0 | 12609 | 1 |
| D | 0 | 14834 | 1 |
| Mode M9 | |||
|---|---|---|---|
| Quadrant | BADHDUFLAG | Total packets | Discarded packets |
| A | 0 | 11 | 0 |
| B | 0 | 11 | 0 |
| C | 0 | 11 | 0 |
| D | 0 | 11 | 0 |
| Quadrant | Total seconds | Saturated seconds | Saturation percentage |
|---|---|---|---|
| A | 6111 | 64 | 1.047292% |
| B | 6112 | 95 | 1.554319% |
| C | 6112 | 81 | 1.325262% |
| D | 6112 | 194 | 3.174084% |
Noise dominated data is calculated using 1-second bins in cleaned event files. If a bin has >2000 counts, and if more than 50% of those come from <1% of pixels, then it is considered to be noise-dominated and hence unusable.
| Quadrant | # 1 sec bins | Bins with >0 counts | Bins with >2000 counts | High rate bins dominated by noise | Noise dominated (total time) | Noise dominated (detector-on time) | Marked lightcurve |
|---|---|---|---|---|---|---|---|
| A | 7232 | 6113 | 6 | 6 | 0.08% | 0.10% | 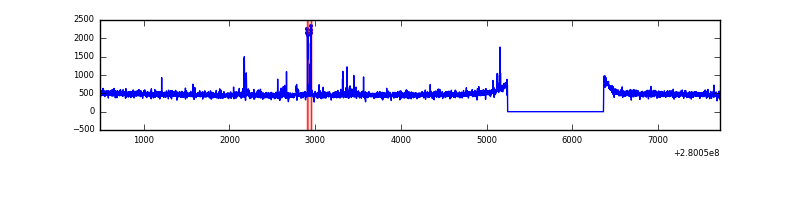 |
| B | 7233 | 6114 | 18 | 18 | 0.25% | 0.29% | 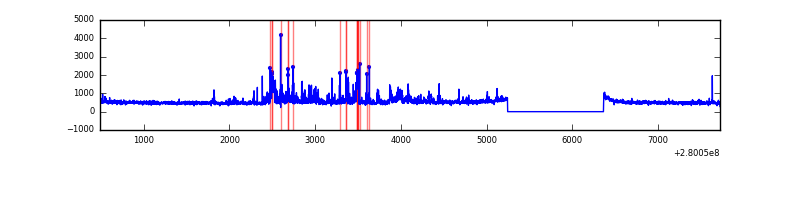 |
| C | 7233 | 6114 | 0 | 0 | 0.00% | 0.00% | 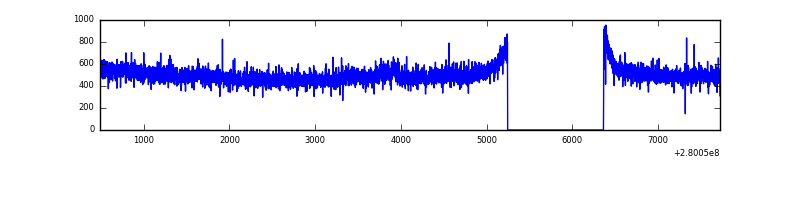 |
| D | 7233 | 6114 | 121 | 121 | 1.67% | 1.98% | 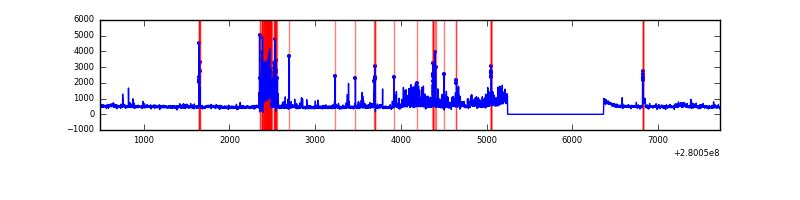 |
Top three noisy pixels from each quadrant. If the there are fewer than three noisy pixels in the level2.evt file, extra rows are filled as -1
| Pixel properties | Quadrant properties | ||||||
|---|---|---|---|---|---|---|---|
| Quadrant | DetID | PixID | Counts | Sigma | Mean | Median | Sigma |
| A | 15 | 174 | 56895 | 371.13 | 753 | 736 | 151.3 |
| A | 12 | 189 | 15484 | 97.46 | 753 | 736 | 151.3 |
| A | 0 | 226 | 7156 | 42.43 | 753 | 736 | 151.3 |
| B | 15 | 35 | 198105 | 1404.1 | 749 | 731 | 140.6 |
| B | 7 | 220 | 166714 | 1180.79 | 749 | 731 | 140.6 |
| B | 0 | 189 | 47868 | 335.33 | 749 | 731 | 140.6 |
| C | 14 | 238 | 112975 | 662.29 | 733 | 736 | 169.5 |
| C | 3 | 233 | 77054 | 450.33 | 733 | 736 | 169.5 |
| C | 13 | 61 | 5106 | 25.78 | 733 | 736 | 169.5 |
| D | 1 | 52 | 443470 | 2486.07 | 736 | 716 | 178.1 |
| D | 15 | 0 | 309085 | 1731.49 | 736 | 716 | 178.1 |
| D | 2 | 152 | 29886 | 163.79 | 736 | 716 | 178.1 |
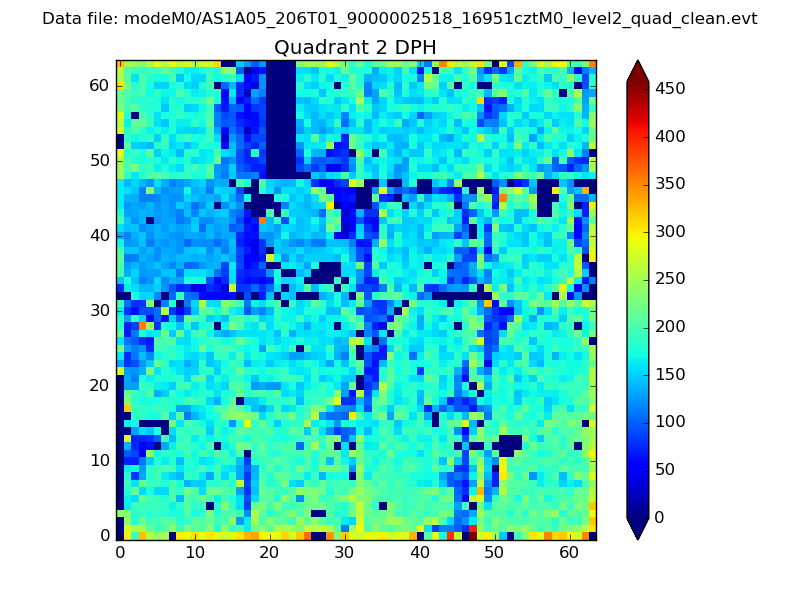
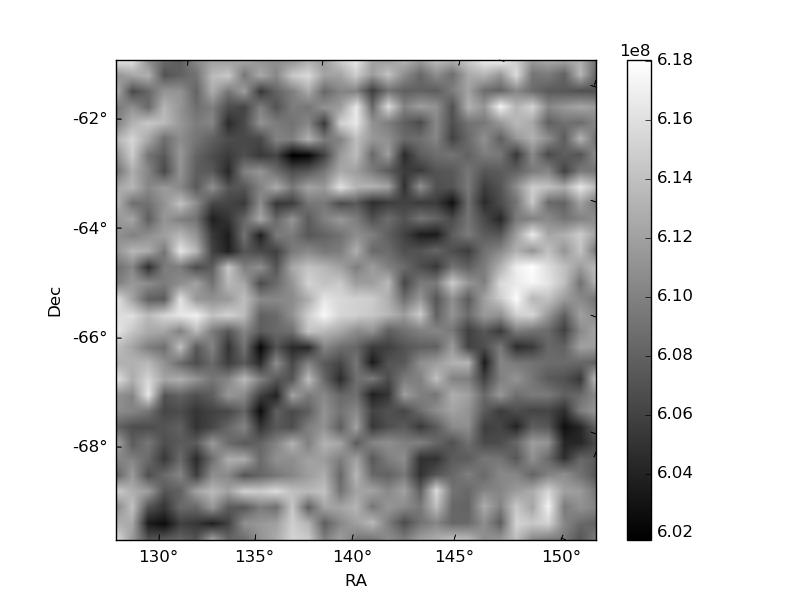
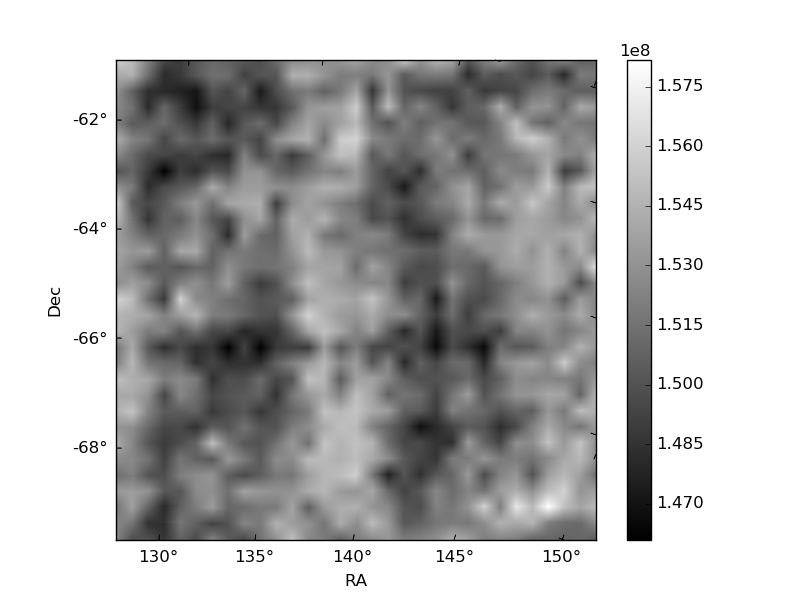
Histogram calculated using DETX and DETY for each event in the final _common_clean file
| Quadrant A | 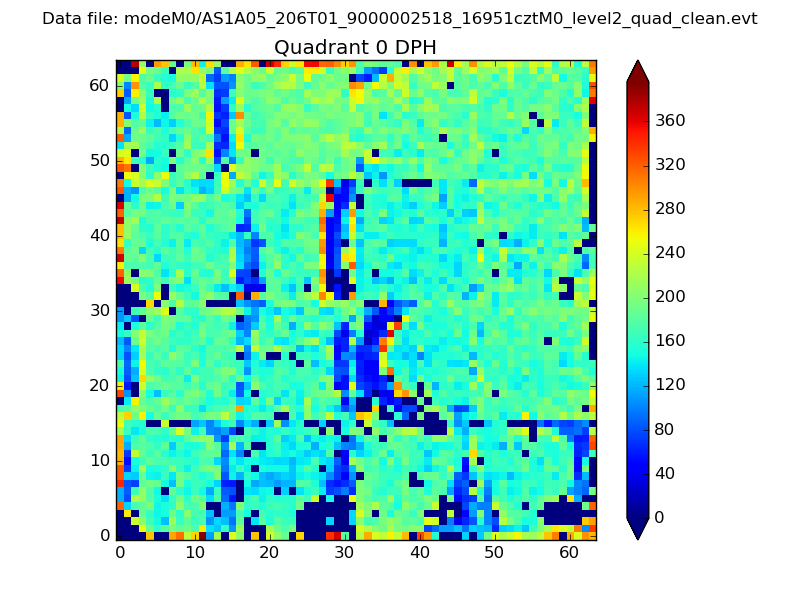 |
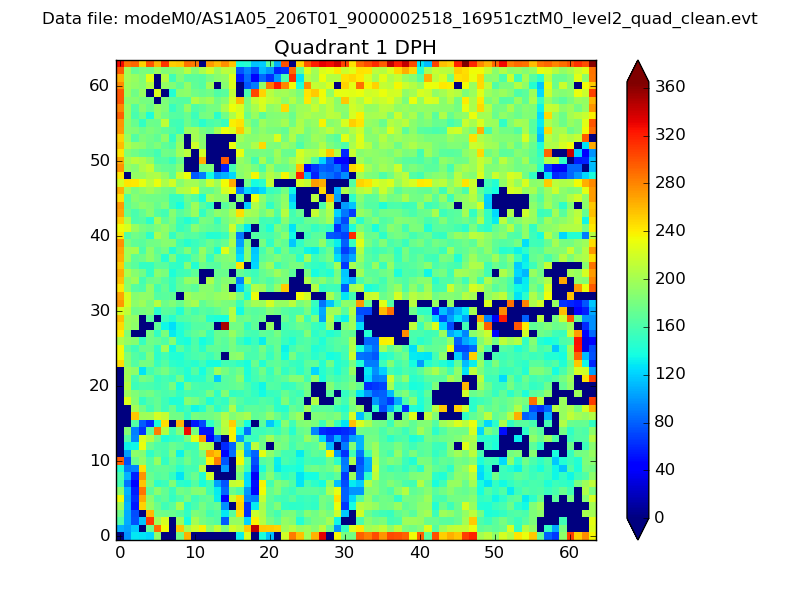 |
Quadrant B |
|---|---|---|---|
| Quadrant D | 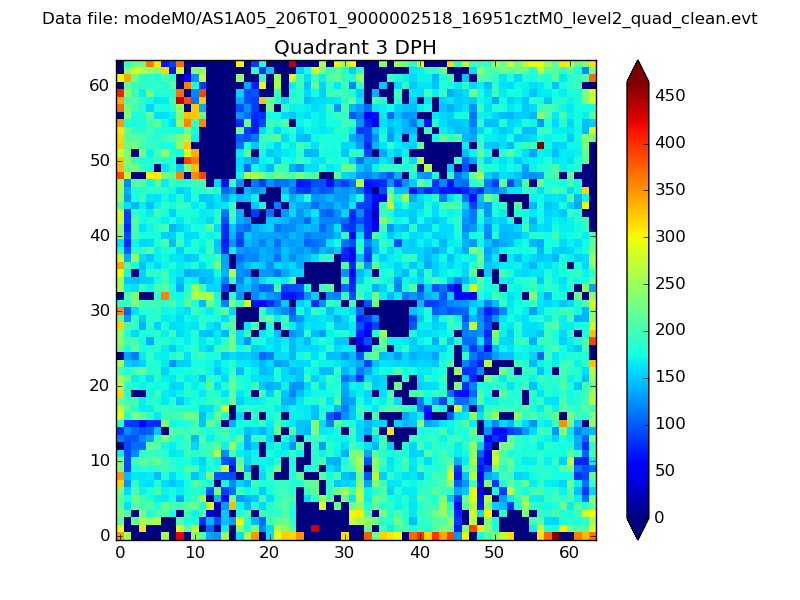 |
 |
Quadrant C |
| Plot type | Count rate plots | Images |
|---|---|---|
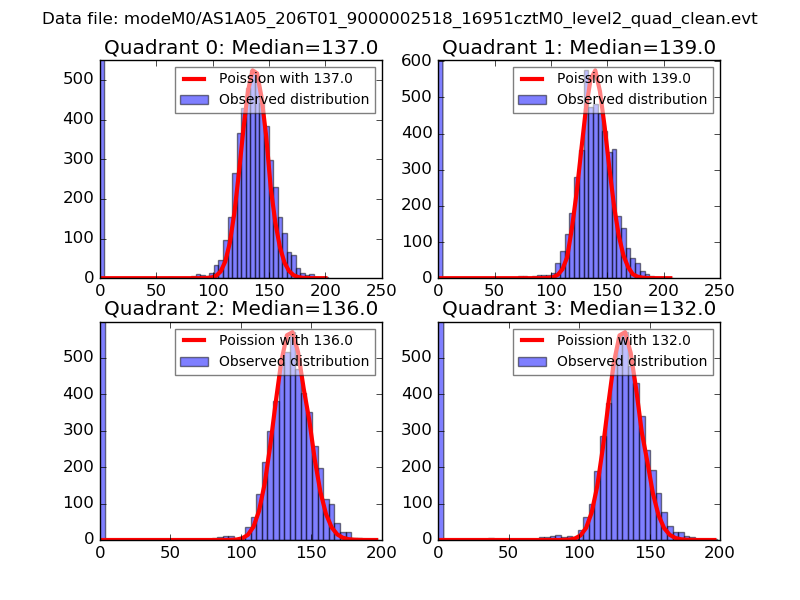
| Comparison with Poisson distribution Blue bars denote a histogram of data divided into 1 sec bins. Red curve is a Poisson curve with rate = median count rate of data. |
 |
 |
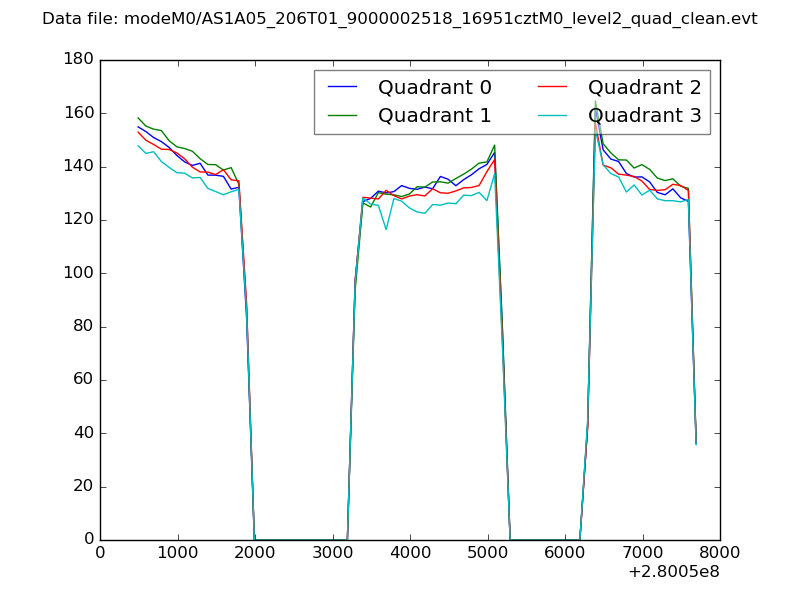
| Quadrant-wise count rates Data is divided into 100 sec bins |
 |
|
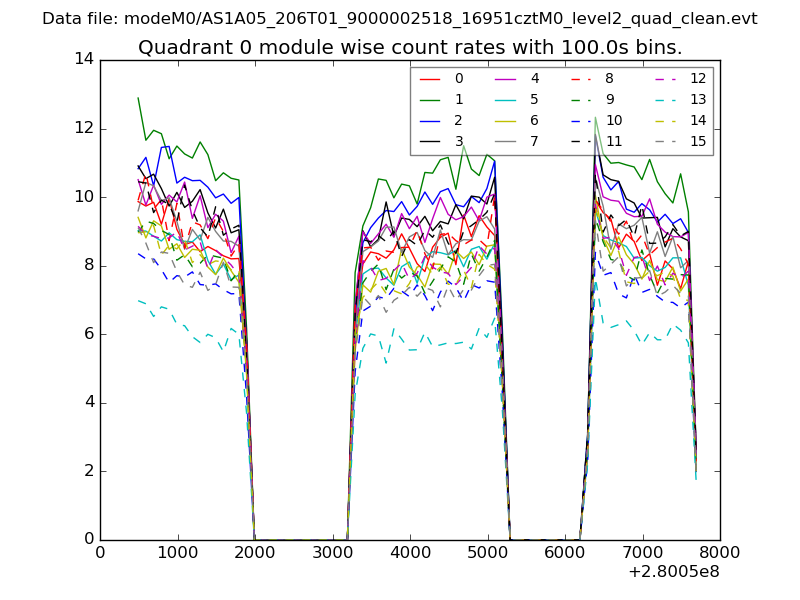
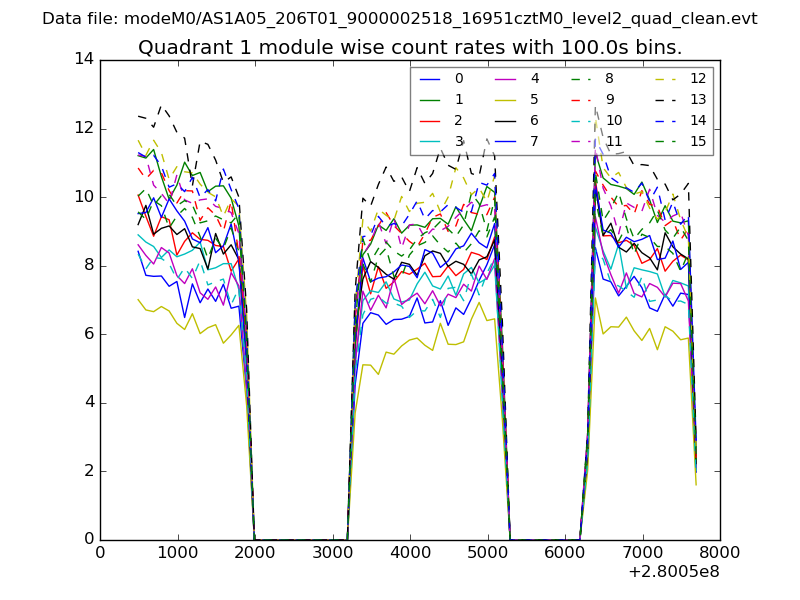
| Module-wise count rates for Quadrant A Data is divided into 100 sec bins |
 |
 |
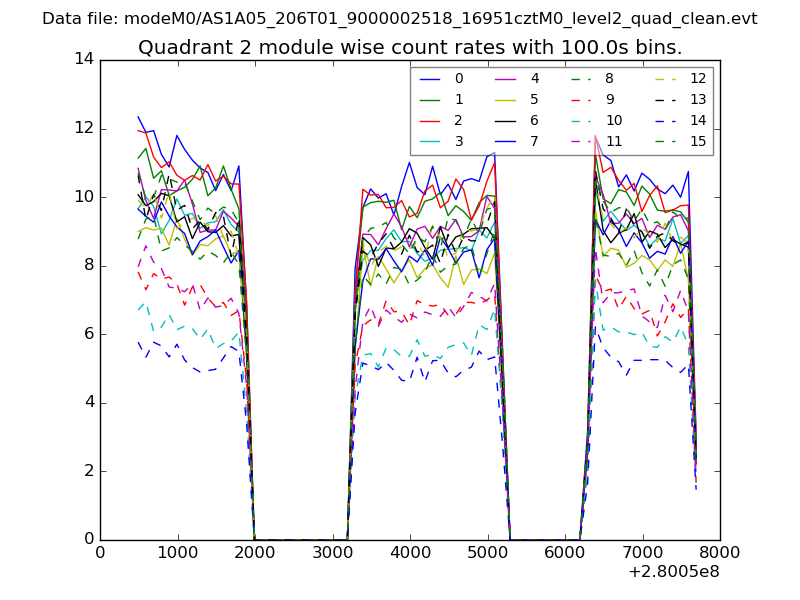
| Module-wise count rates for Quadrant B Data is divided into 100 sec bins |
 |
 |
| Module-wise count rates for Quadrant C Data is divided into 100 sec bins |
 |
 |
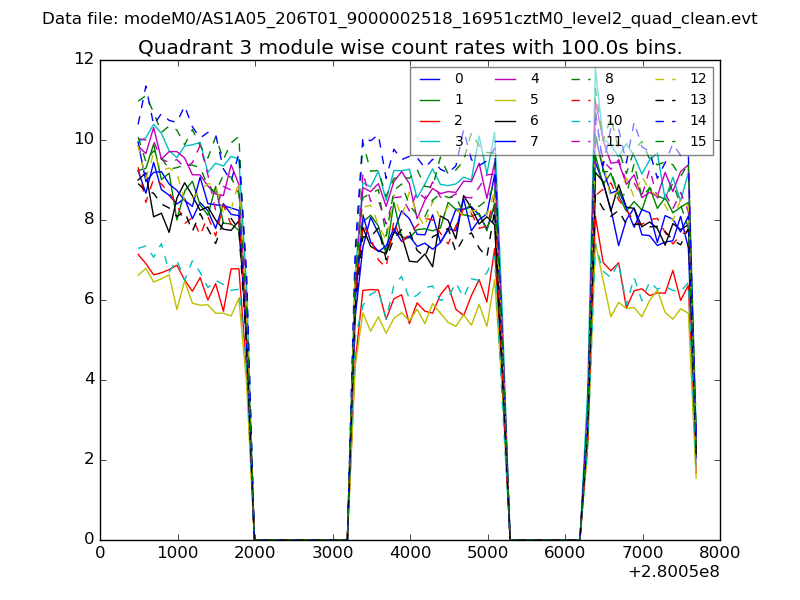
| Module-wise count rates for Quadrant D Data is divided into 100 sec bins |
 |
 |
| Parameter | Plot |
|---|---|
| CZT HV Monitor | 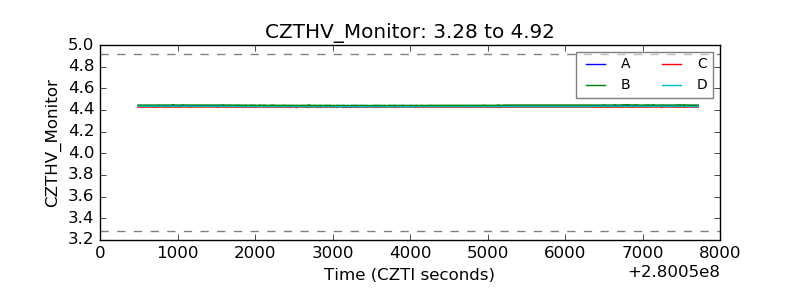 |
| D_VDD | 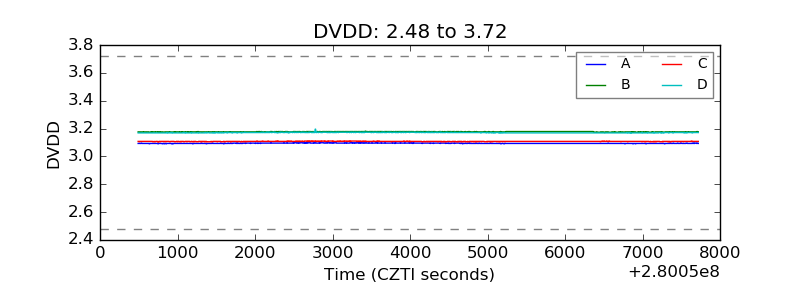 |
| Temperature 1 | 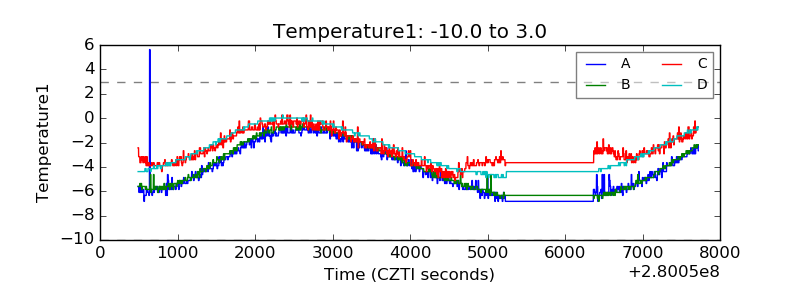 |
| Veto HV Monitor | 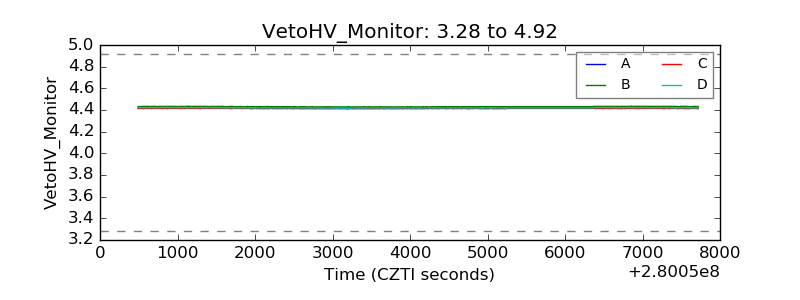 |
| Veto LLD | 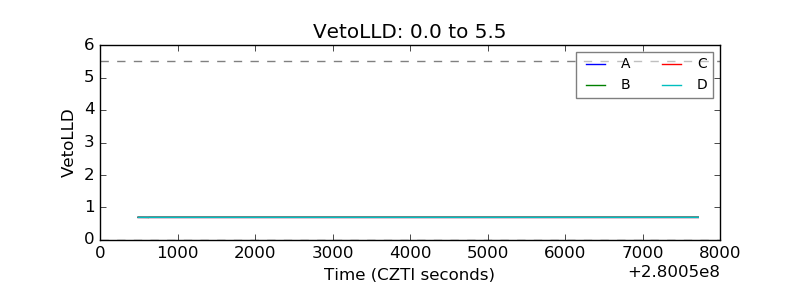 |
| Alpha Counter | 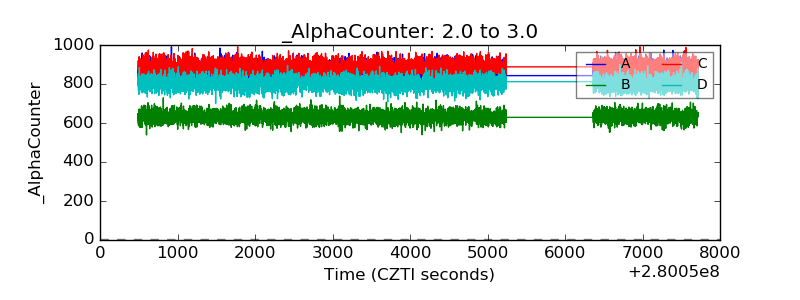 |
| _CPM_Rate | 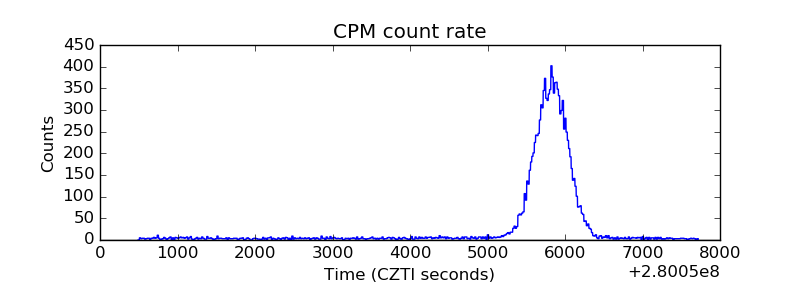 |
| CZT Counter | 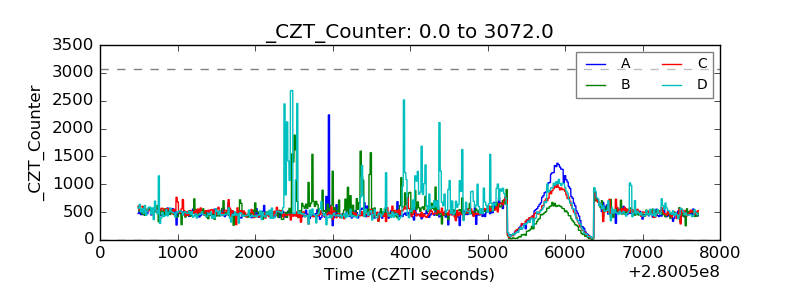 |
| +2.5 Volts monitor | 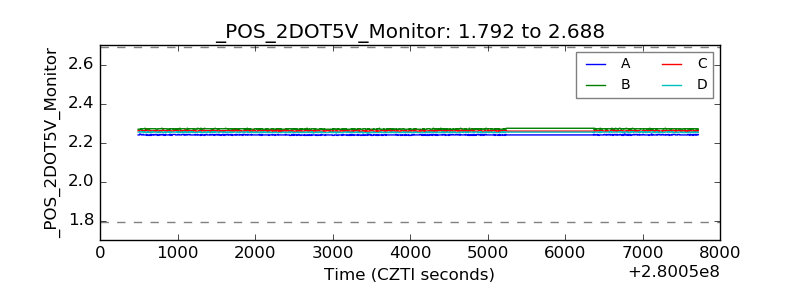 |
| +5 Volts monitor |  |
| _ROLL_ROT | 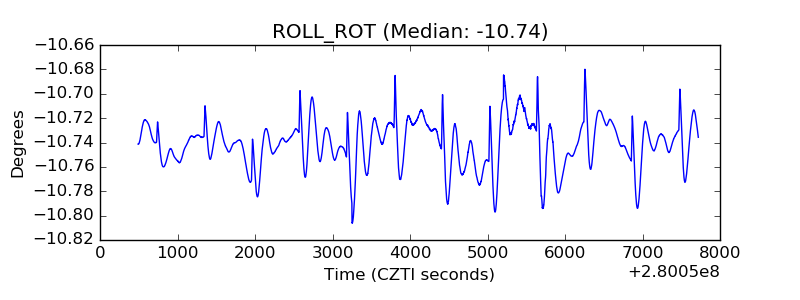 |
| _Roll_DEC |  |
| _Roll_RA | 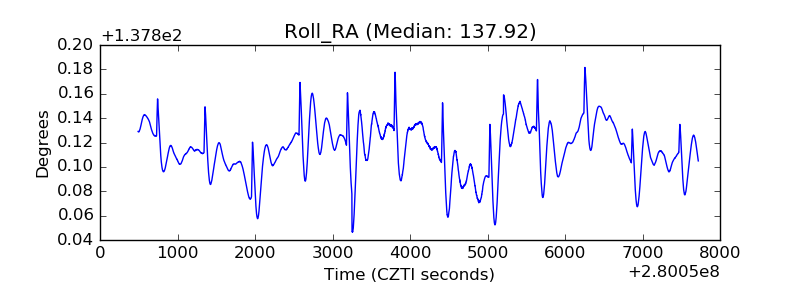 |
| Veto Counter | 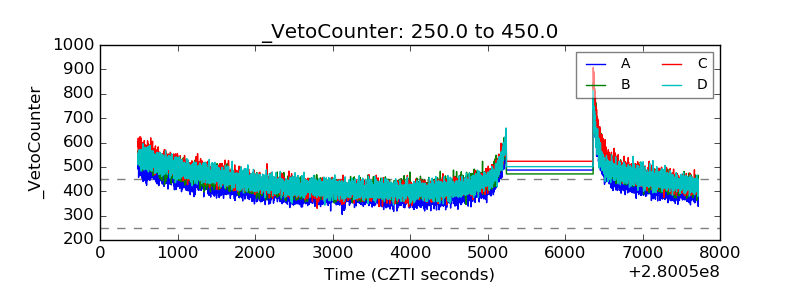 |