| Param | Original file | Final file |
|---|---|---|
| Filename | modeM0/AS1A05_206T01_9000002518_16953cztM0_level2.evt | modeM0/AS1A05_206T01_9000002518_16953cztM0_level2_quad_clean.evt |
| Size (bytes) | 563,780,160 | 103,904,640 |
| Size | 537.7 MB | 99.1 MB |
| Events in quadrant A | 3,854,444 | 658,436 |
| Events in quadrant B | 4,075,498 | 670,367 |
| Events in quadrant C | 3,890,912 | 650,461 |
| Events in quadrant D | 4,731,922 | 632,845 |
| Mode SS | |||
|---|---|---|---|
| Quadrant | BADHDUFLAG | Total packets | Discarded packets |
| A | 0 | 156 | 0 |
| B | 0 | 156 | 0 |
| C | 0 | 156 | 0 |
| D | 0 | 156 | 0 |
| Mode M0 | |||
|---|---|---|---|
| Quadrant | BADHDUFLAG | Total packets | Discarded packets |
| A | 0 | 16654 | 1 |
| B | 0 | 16863 | 1 |
| C | 0 | 16300 | 1 |
| D | 0 | 19156 | 1 |
| Mode M9 | |||
|---|---|---|---|
| Quadrant | BADHDUFLAG | Total packets | Discarded packets |
| A | 0 | 4 | 0 |
| B | 0 | 5 | 0 |
| C | 0 | 5 | 0 |
| D | 0 | 5 | 0 |
| Quadrant | Total seconds | Saturated seconds | Saturation percentage |
|---|---|---|---|
| A | 7687 | 251 | 3.265253% |
| B | 7687 | 234 | 3.044100% |
| C | 7687 | 230 | 2.992065% |
| D | 7687 | 452 | 5.880057% |
Noise dominated data is calculated using 1-second bins in cleaned event files. If a bin has >2000 counts, and if more than 50% of those come from <1% of pixels, then it is considered to be noise-dominated and hence unusable.
| Quadrant | # 1 sec bins | Bins with >0 counts | Bins with >2000 counts | High rate bins dominated by noise | Noise dominated (total time) | Noise dominated (detector-on time) | Marked lightcurve |
|---|---|---|---|---|---|---|---|
| A | 8008 | 7690 | 38 | 38 | 0.47% | 0.49% | 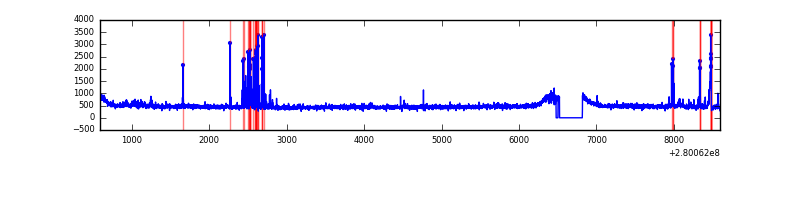 |
| B | 8008 | 7690 | 7 | 7 | 0.09% | 0.09% |  |
| C | 8008 | 7690 | 1 | 1 | 0.01% | 0.01% | 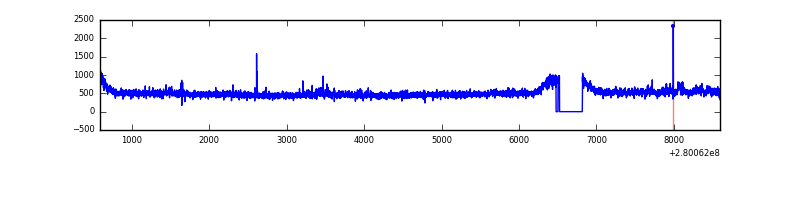 |
| D | 8008 | 7690 | 211 | 211 | 2.63% | 2.74% | 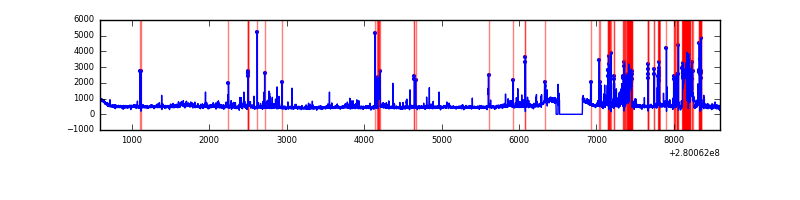 |
Top three noisy pixels from each quadrant. If the there are fewer than three noisy pixels in the level2.evt file, extra rows are filled as -1
| Pixel properties | Quadrant properties | ||||||
|---|---|---|---|---|---|---|---|
| Quadrant | DetID | PixID | Counts | Sigma | Mean | Median | Sigma |
| A | 15 | 174 | 261924 | 1383.79 | 924 | 901 | 188.6 |
| A | 12 | 189 | 33088 | 170.64 | 924 | 901 | 188.6 |
| A | 9 | 143 | 10264 | 49.64 | 924 | 901 | 188.6 |
| B | 3 | 64 | 100846 | 570.81 | 921 | 898 | 175.1 |
| B | 0 | 229 | 69740 | 393.16 | 921 | 898 | 175.1 |
| B | 6 | 36 | 53357 | 299.6 | 921 | 898 | 175.1 |
| C | 3 | 233 | 259495 | 1248.38 | 893 | 897 | 207.1 |
| C | 14 | 238 | 139394 | 668.59 | 893 | 897 | 207.1 |
| C | 13 | 61 | 6373 | 26.44 | 893 | 897 | 207.1 |
| D | 1 | 52 | 417854 | 1909.23 | 899 | 873 | 218.4 |
| D | 15 | 0 | 399372 | 1824.6 | 899 | 873 | 218.4 |
| D | 13 | 187 | 255472 | 1165.73 | 899 | 873 | 218.4 |
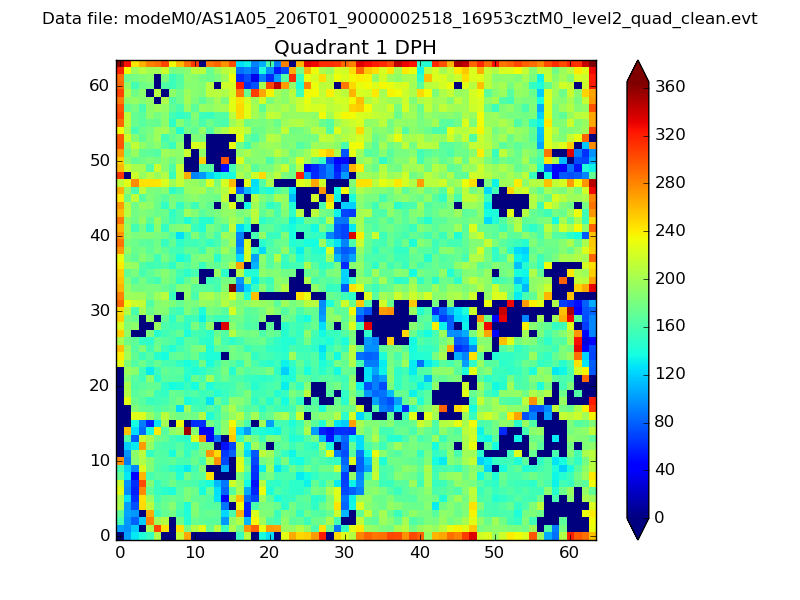
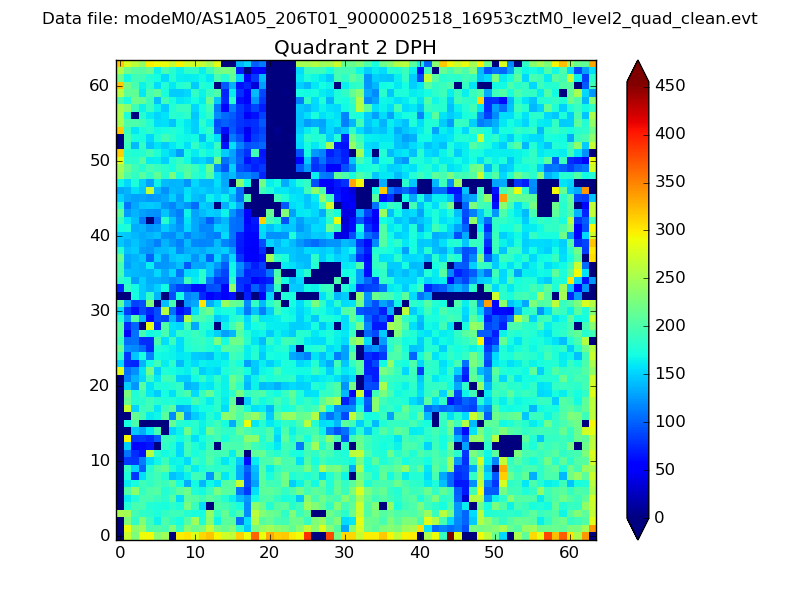
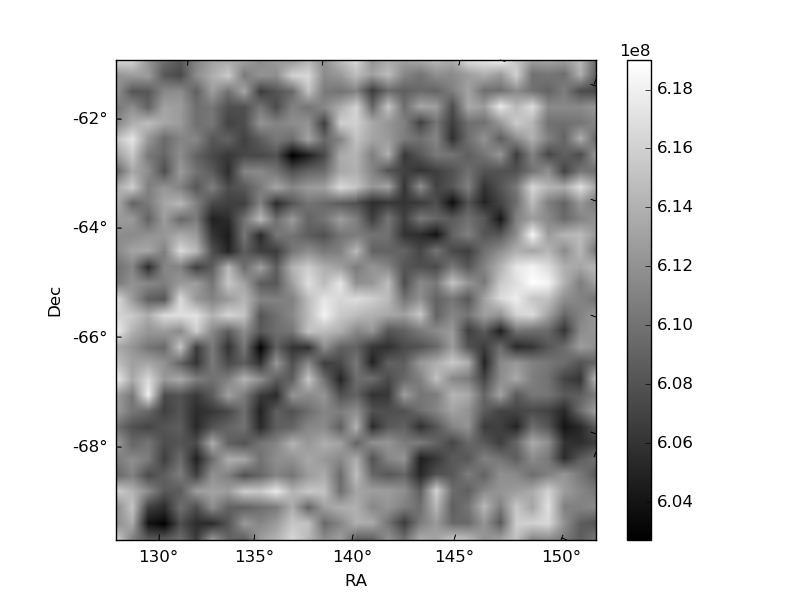
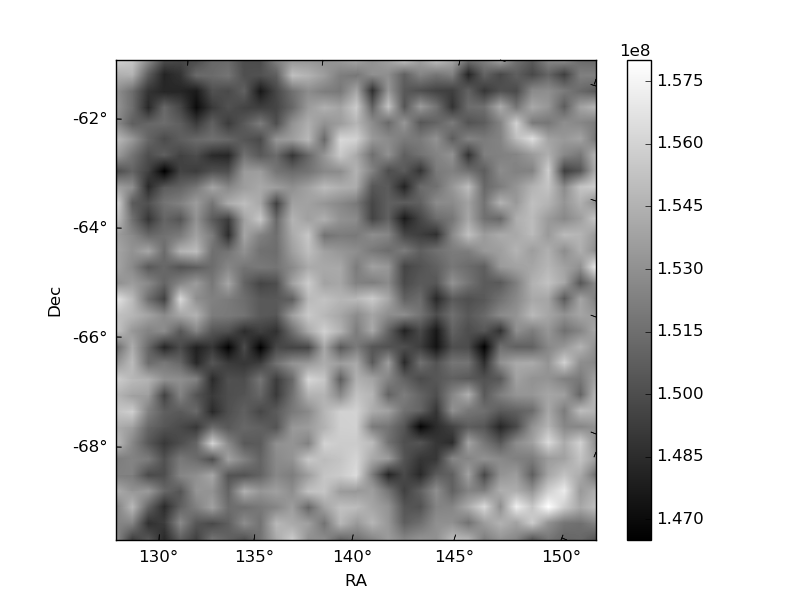
Histogram calculated using DETX and DETY for each event in the final _common_clean file
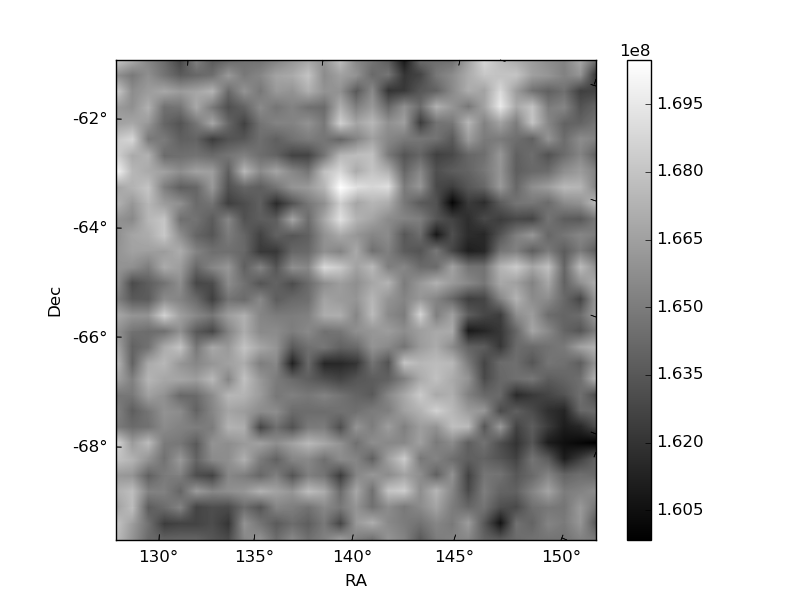
| Quadrant A | 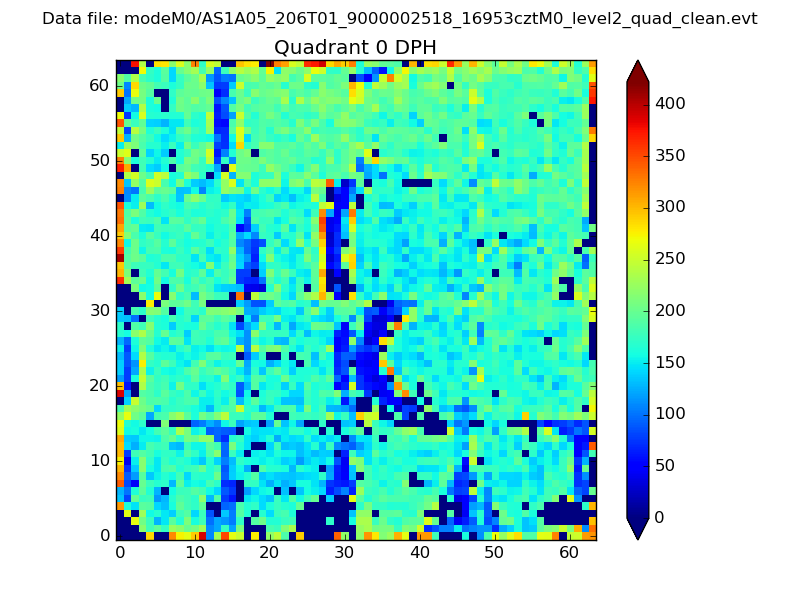 |
 |
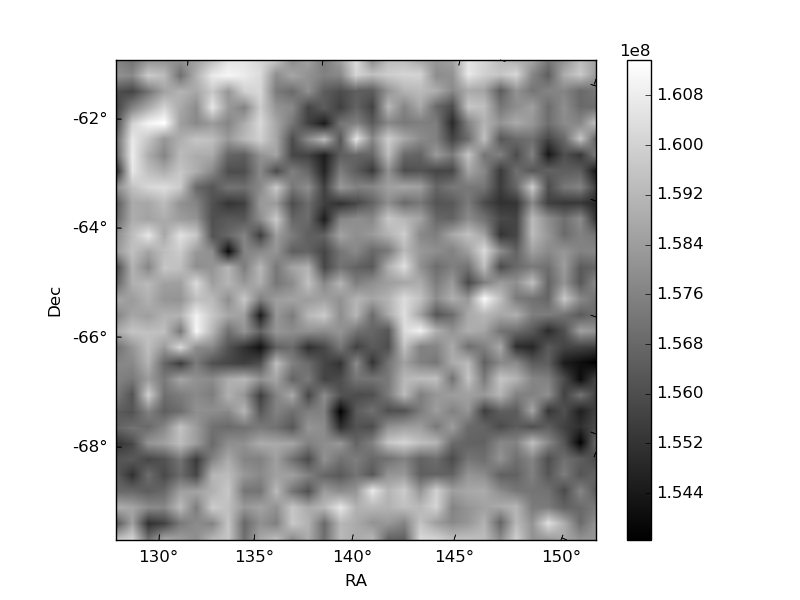
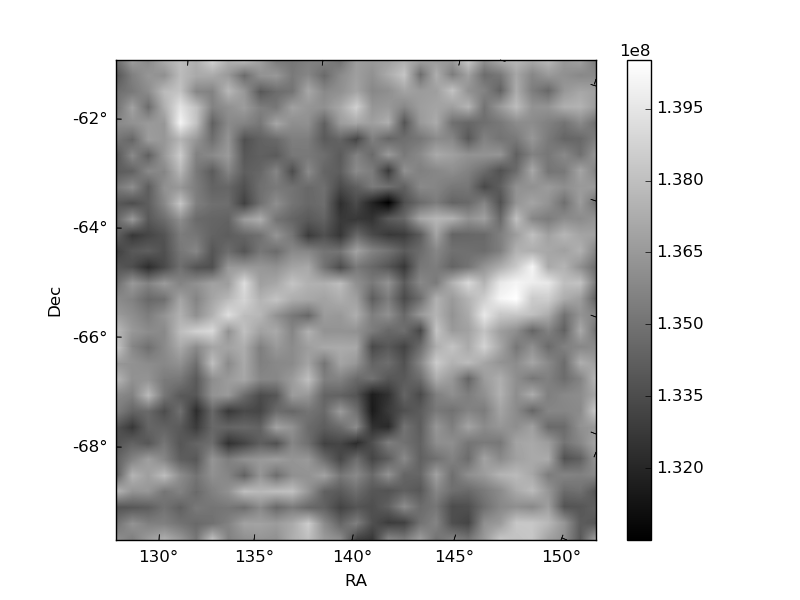
Quadrant B |
|---|---|---|---|
| Quadrant D | 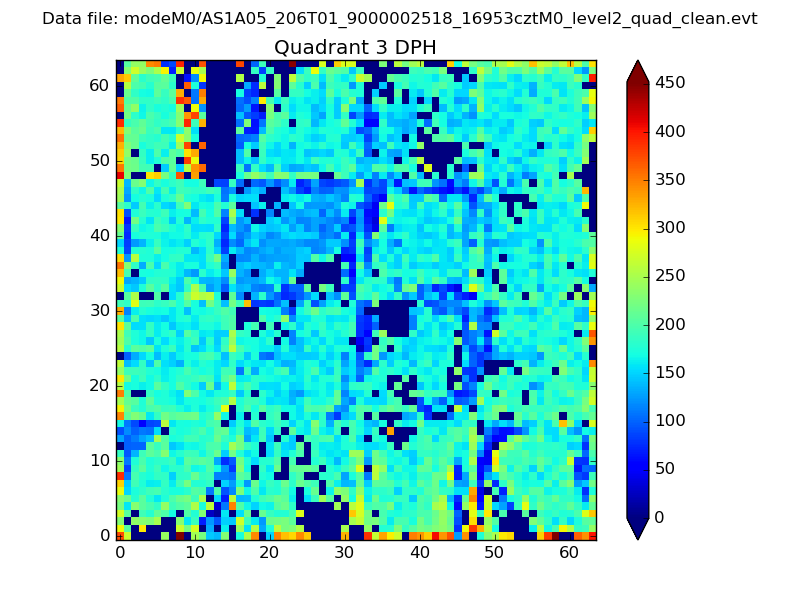 |
 |
Quadrant C |
| Plot type | Count rate plots | Images |
|---|---|---|
| Comparison with Poisson distribution Blue bars denote a histogram of data divided into 1 sec bins. Red curve is a Poisson curve with rate = median count rate of data. |
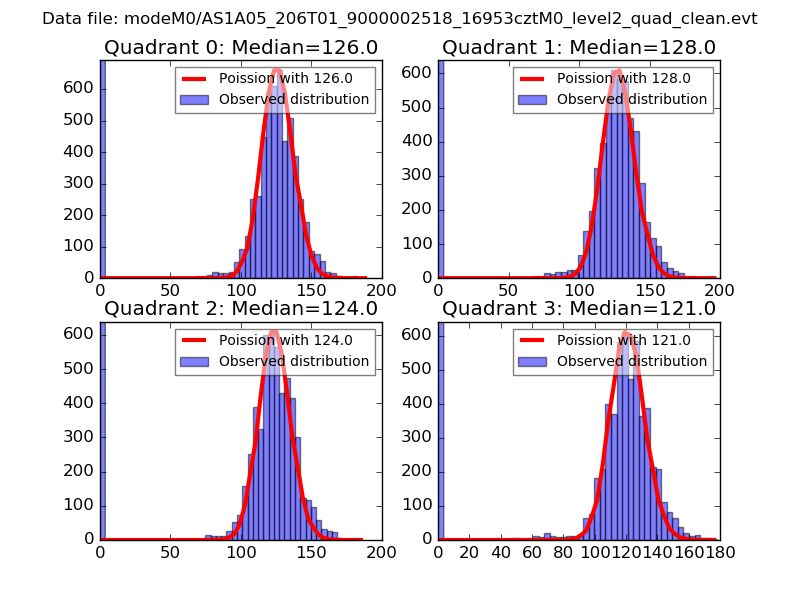 |
 |
| Quadrant-wise count rates Data is divided into 100 sec bins |
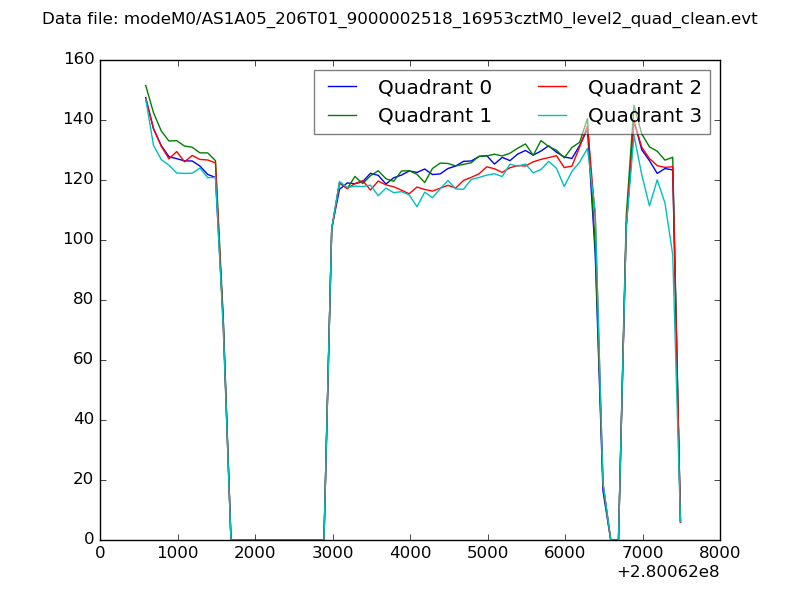 |
|
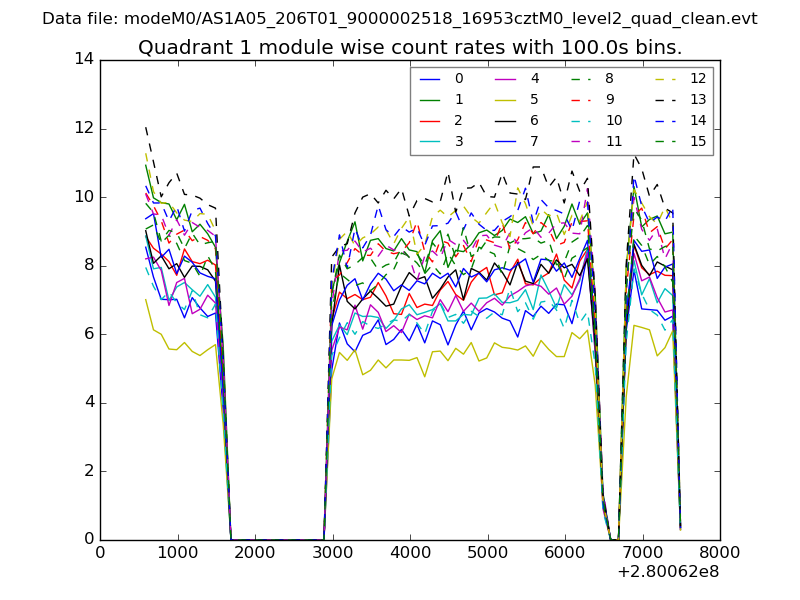
| Module-wise count rates for Quadrant A Data is divided into 100 sec bins |
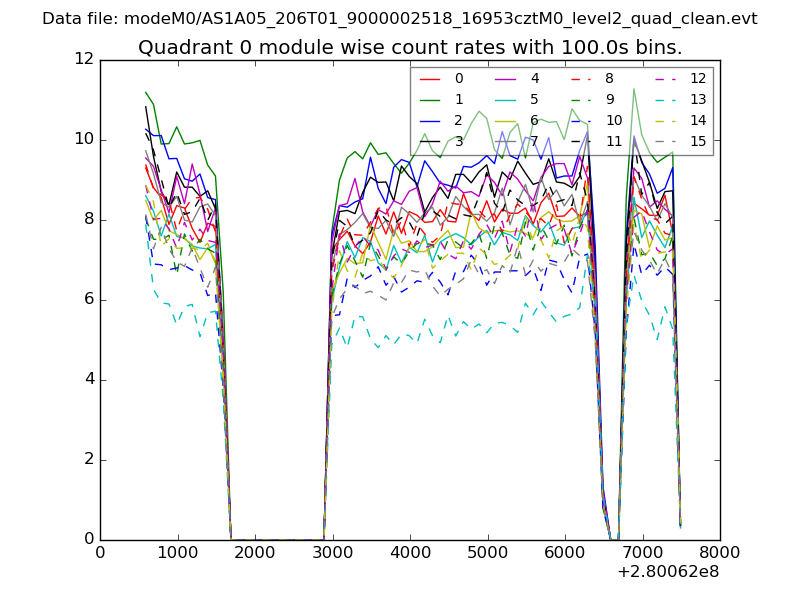 |
 |
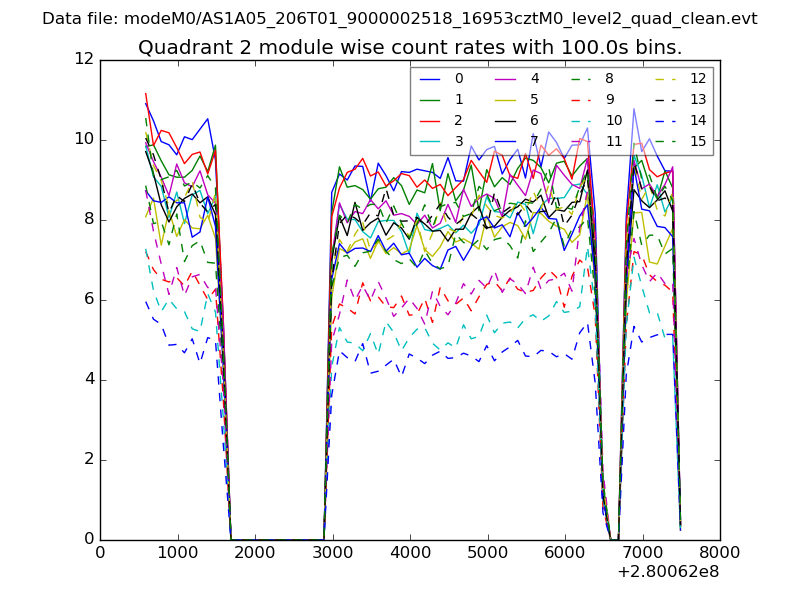
| Module-wise count rates for Quadrant B Data is divided into 100 sec bins |
 |
 |
| Module-wise count rates for Quadrant C Data is divided into 100 sec bins |
 |
 |
| Module-wise count rates for Quadrant D Data is divided into 100 sec bins |
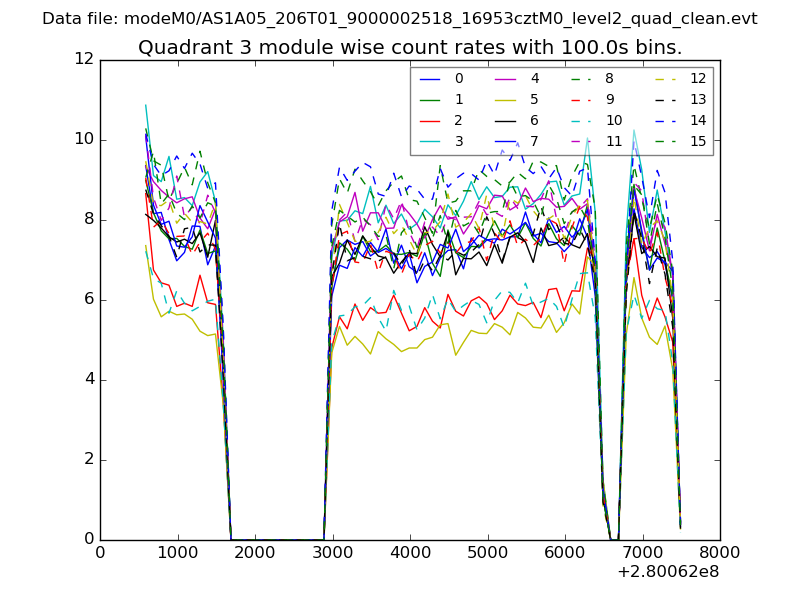 |
 |
| Parameter | Plot |
|---|---|
| CZT HV Monitor | 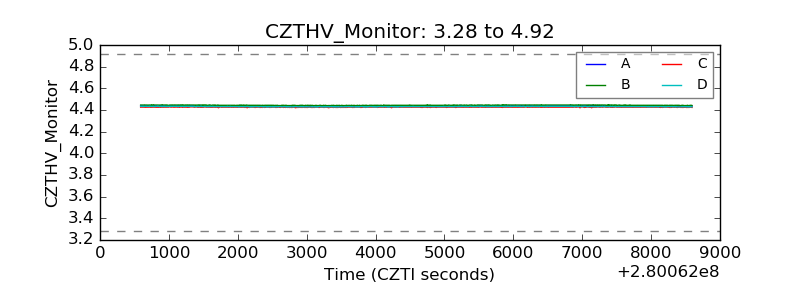 |
| D_VDD | 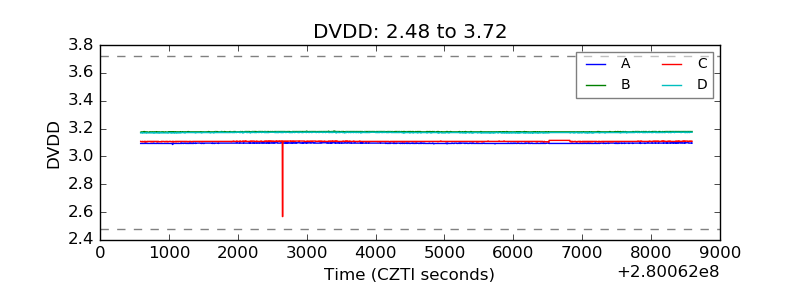 |
| Temperature 1 |  |
| Veto HV Monitor | 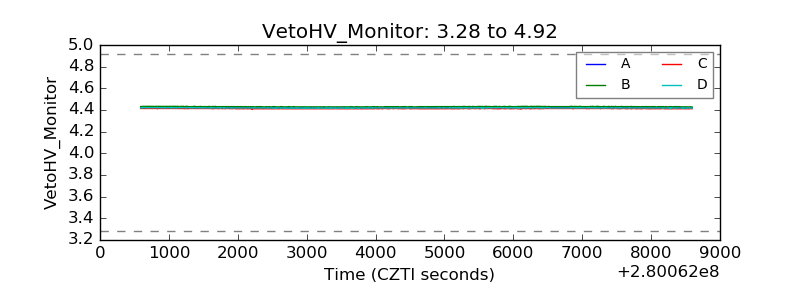 |
| Veto LLD |  |
| Alpha Counter | 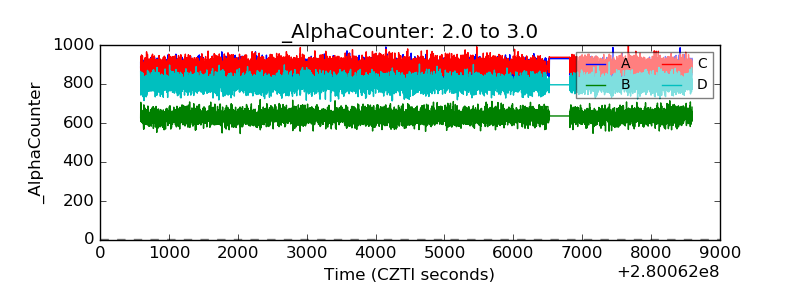 |
| _CPM_Rate | 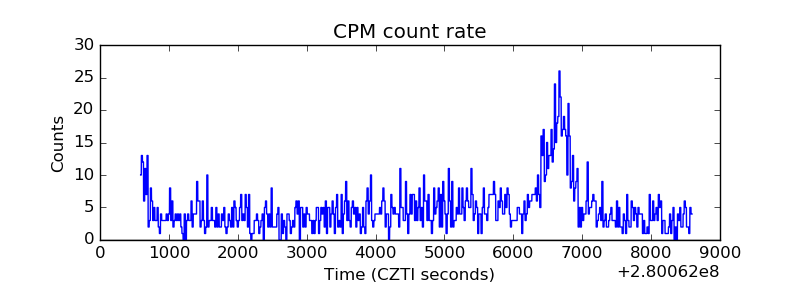 |
| CZT Counter | 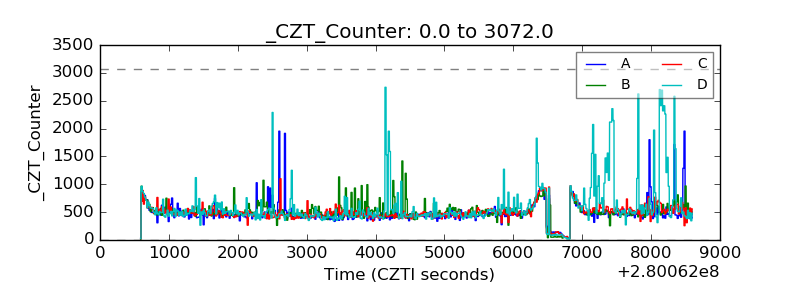 |
| +2.5 Volts monitor |  |
| +5 Volts monitor | 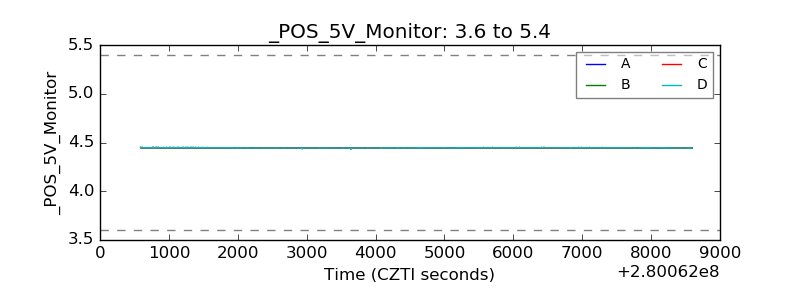 |
| _ROLL_ROT | 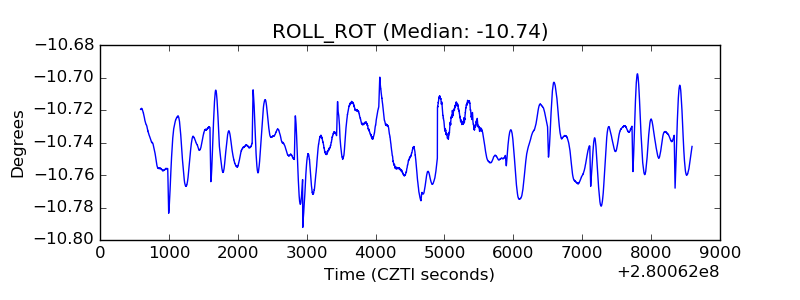 |
| _Roll_DEC | 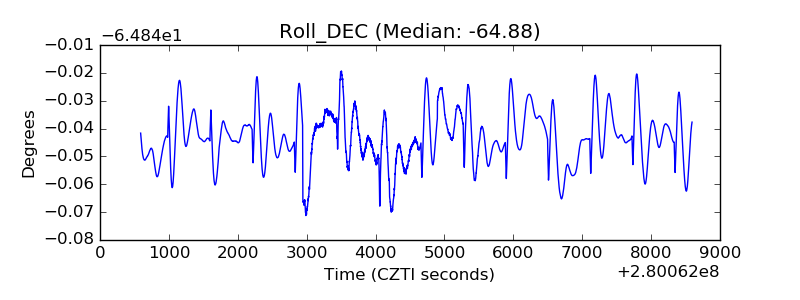 |
| _Roll_RA | 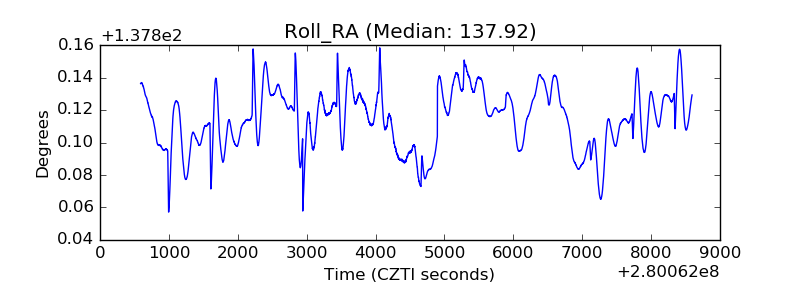 |
| Veto Counter | 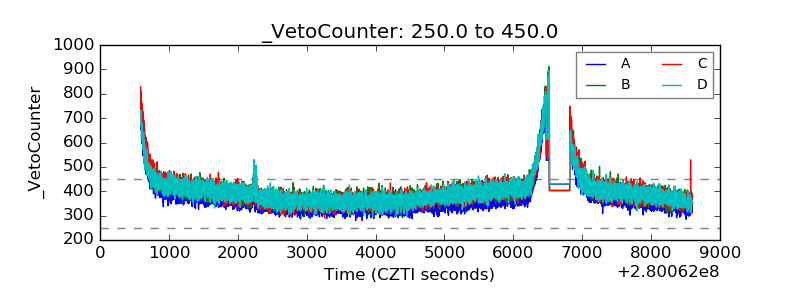 |