| Param | Original file | Final file |
|---|---|---|
| Filename | modeM0/AS1A05_206T01_9000002518_16954cztM0_level2.evt | modeM0/AS1A05_206T01_9000002518_16954cztM0_level2_quad_clean.evt |
| Size (bytes) | 587,551,680 | 98,046,720 |
| Size | 560.3 MB | 93.5 MB |
| Events in quadrant A | 4,060,614 | 618,608 |
| Events in quadrant B | 4,320,842 | 622,099 |
| Events in quadrant C | 4,221,938 | 601,496 |
| Events in quadrant D | 4,670,914 | 593,556 |
| Mode SS | |||
|---|---|---|---|
| Quadrant | BADHDUFLAG | Total packets | Discarded packets |
| A | 0 | 158 | 0 |
| B | 0 | 158 | 0 |
| C | 0 | 158 | 0 |
| D | 0 | 158 | 0 |
| Mode M0 | |||
|---|---|---|---|
| Quadrant | BADHDUFLAG | Total packets | Discarded packets |
| A | 0 | 17266 | 2 |
| B | 0 | 17755 | 3 |
| C | 0 | 17238 | 2 |
| D | 0 | 19069 | 2 |
| Mode M9 | |||
|---|---|---|---|
| Quadrant | BADHDUFLAG | Total packets | Discarded packets |
| A | 0 | 1 | 0 |
| B | 0 | 1 | 0 |
| C | 0 | 1 | 0 |
| D | 0 | 1 | 0 |
| Quadrant | Total seconds | Saturated seconds | Saturation percentage |
|---|---|---|---|
| A | 7654 | 334 | 4.363731% |
| B | 7654 | 254 | 3.318526% |
| C | 7654 | 212 | 2.769794% |
| D | 7654 | 376 | 4.912464% |
Noise dominated data is calculated using 1-second bins in cleaned event files. If a bin has >2000 counts, and if more than 50% of those come from <1% of pixels, then it is considered to be noise-dominated and hence unusable.
| Quadrant | # 1 sec bins | Bins with >0 counts | Bins with >2000 counts | High rate bins dominated by noise | Noise dominated (total time) | Noise dominated (detector-on time) | Marked lightcurve |
|---|---|---|---|---|---|---|---|
| A | 7820 | 7656 | 106 | 106 | 1.36% | 1.38% | 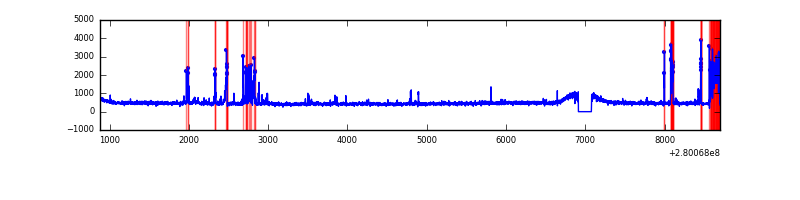 |
| B | 7820 | 7656 | 28 | 28 | 0.36% | 0.37% | 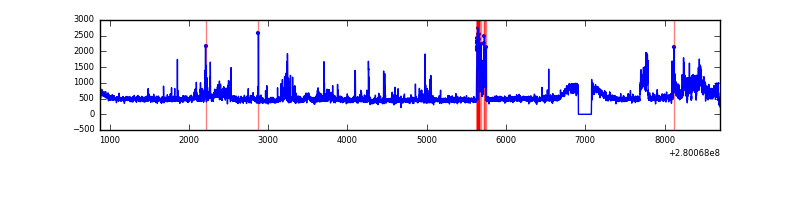 |
| C | 7820 | 7656 | 1 | 1 | 0.01% | 0.01% | 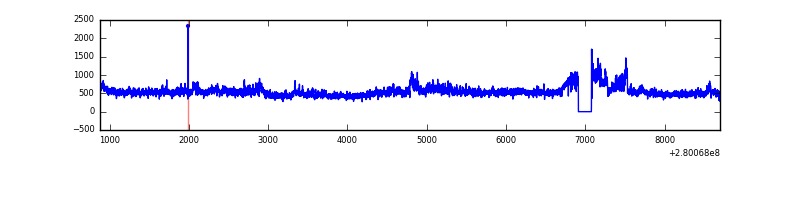 |
| D | 7820 | 7656 | 189 | 189 | 2.42% | 2.47% | 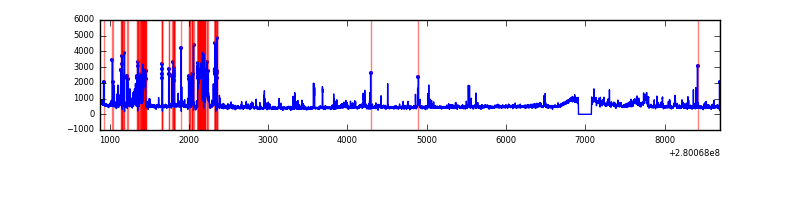 |
Top three noisy pixels from each quadrant. If the there are fewer than three noisy pixels in the level2.evt file, extra rows are filled as -1
| Pixel properties | Quadrant properties | ||||||
|---|---|---|---|---|---|---|---|
| Quadrant | DetID | PixID | Counts | Sigma | Mean | Median | Sigma |
| A | 15 | 174 | 541197 | 2892.92 | 910 | 886 | 186.8 |
| A | 12 | 189 | 14086 | 70.68 | 910 | 886 | 186.8 |
| A | 0 | 226 | 8217 | 39.25 | 910 | 886 | 186.8 |
| B | 15 | 33 | 164544 | 926.84 | 914 | 888 | 176.6 |
| B | 15 | 35 | 159978 | 900.98 | 914 | 888 | 176.6 |
| B | 5 | 250 | 126281 | 710.14 | 914 | 888 | 176.6 |
| C | 3 | 233 | 648581 | 3155.18 | 881 | 886 | 205.3 |
| C | 14 | 238 | 133510 | 646.07 | 881 | 886 | 205.3 |
| C | 13 | 61 | 6207 | 25.92 | 881 | 886 | 205.3 |
| D | 15 | 0 | 383006 | 1772.08 | 888 | 859 | 215.6 |
| D | 1 | 52 | 377179 | 1745.06 | 888 | 859 | 215.6 |
| D | 13 | 187 | 206625 | 954.17 | 888 | 859 | 215.6 |
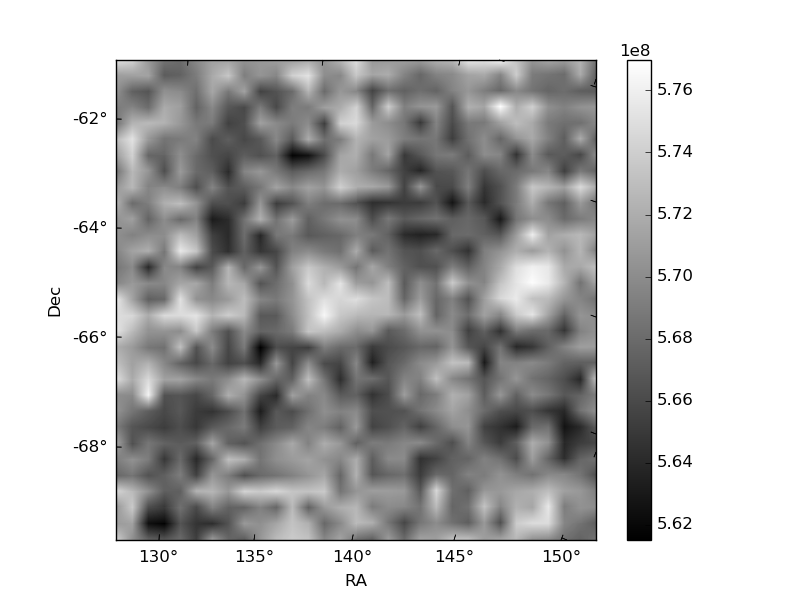
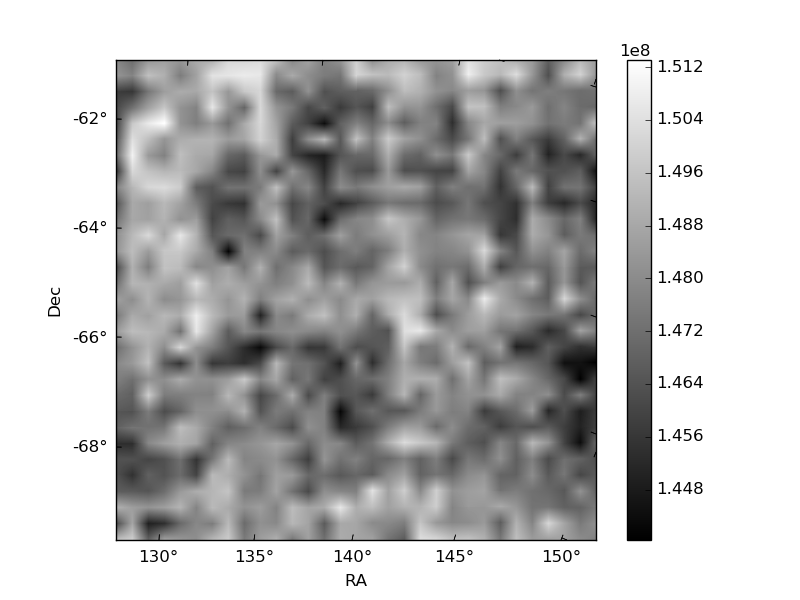
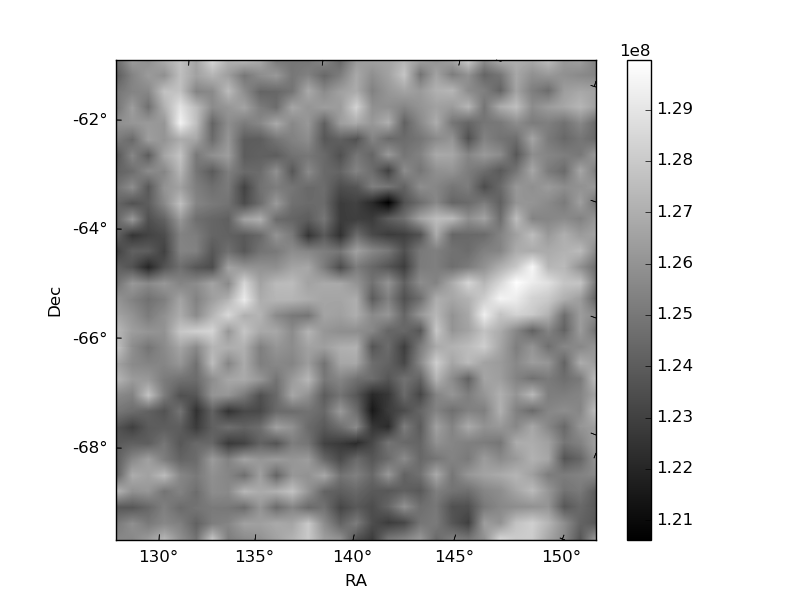
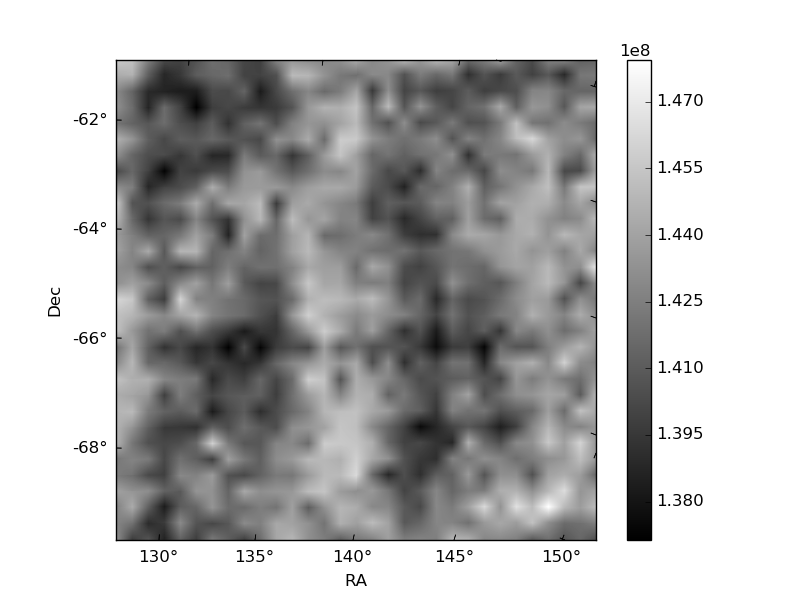
Histogram calculated using DETX and DETY for each event in the final _common_clean file
| Quadrant A | 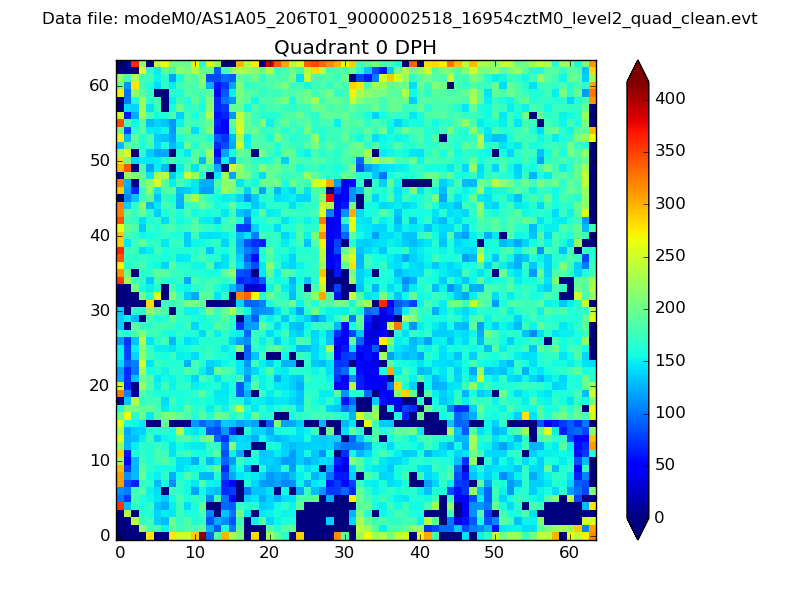 |
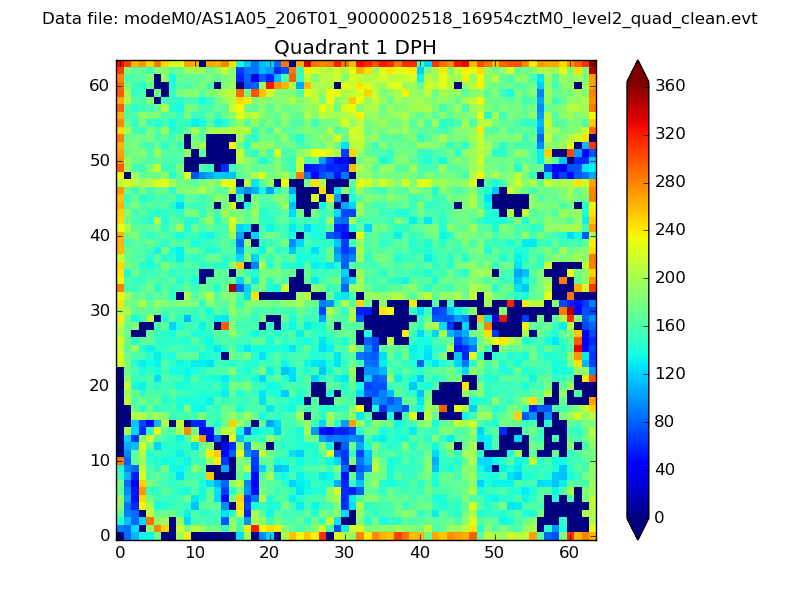 |
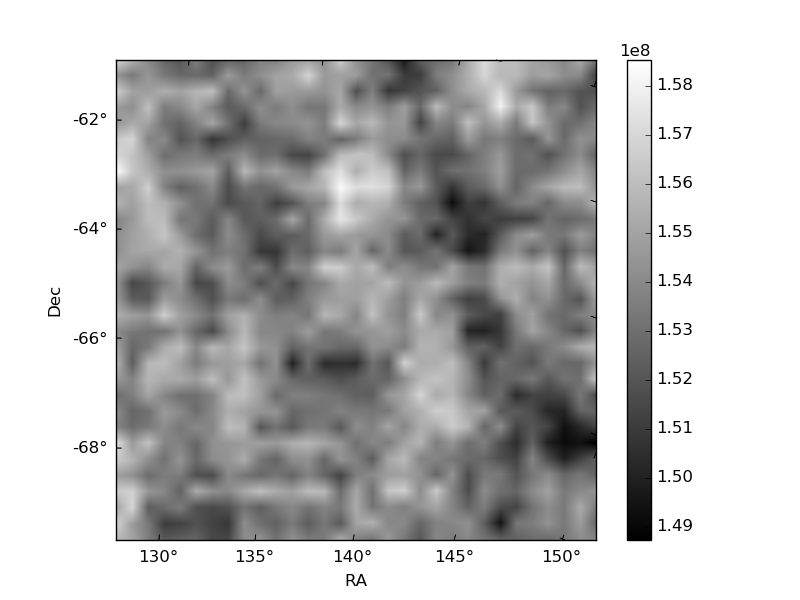
Quadrant B |
|---|---|---|---|
| Quadrant D | 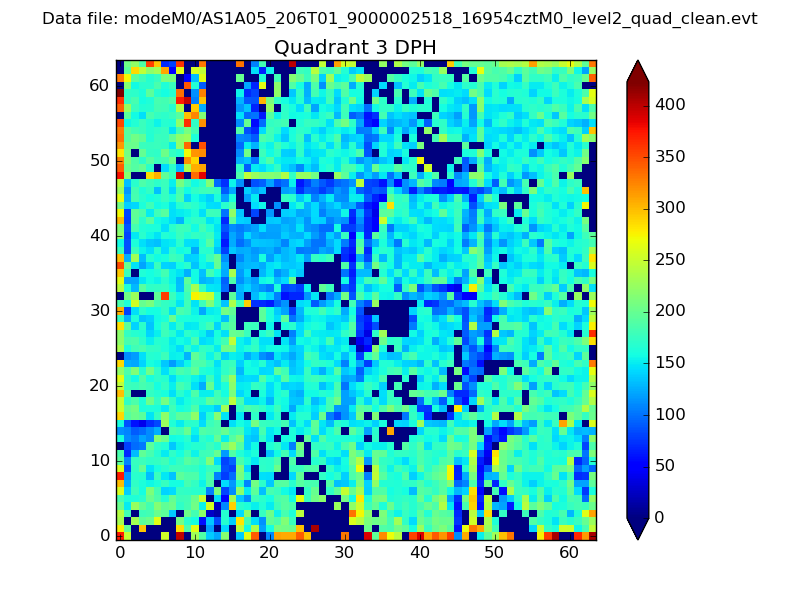 |
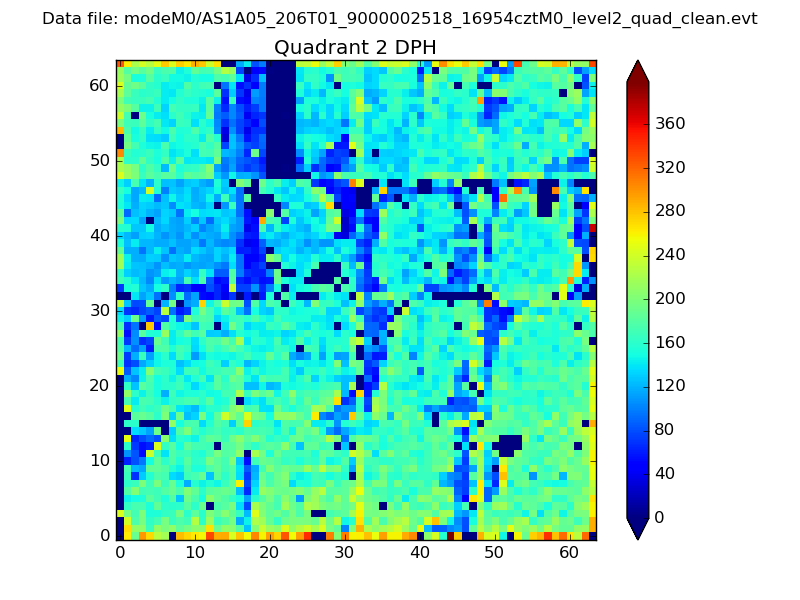 |
Quadrant C |
| Plot type | Count rate plots | Images |
|---|---|---|
| Comparison with Poisson distribution Blue bars denote a histogram of data divided into 1 sec bins. Red curve is a Poisson curve with rate = median count rate of data. |
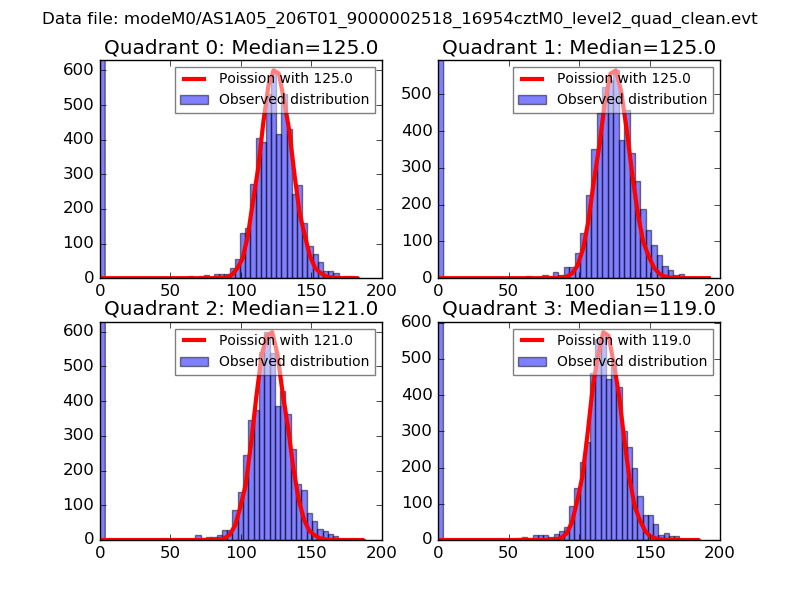 |
 |
| Quadrant-wise count rates Data is divided into 100 sec bins |
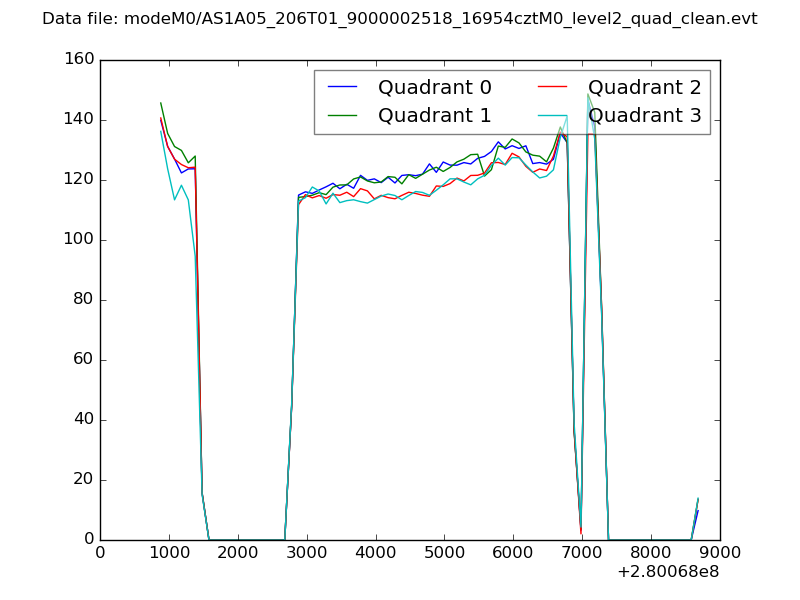 |
|
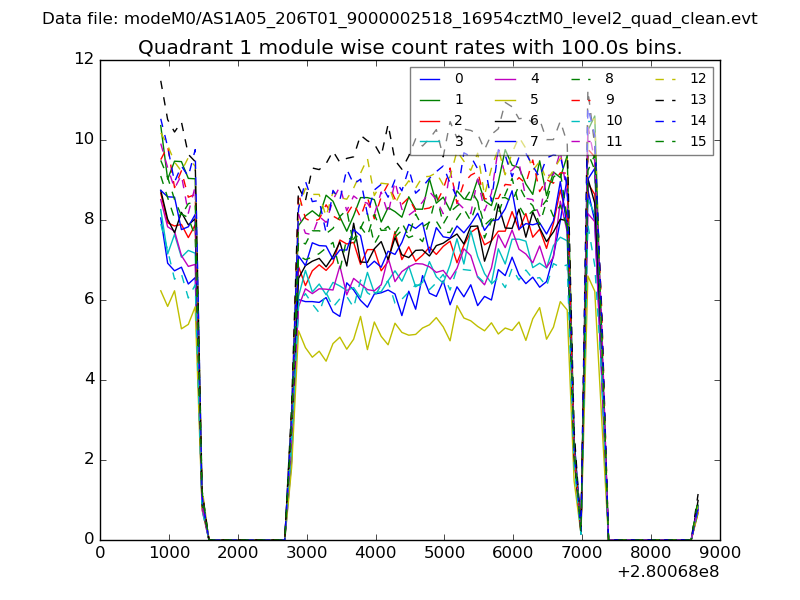
| Module-wise count rates for Quadrant A Data is divided into 100 sec bins |
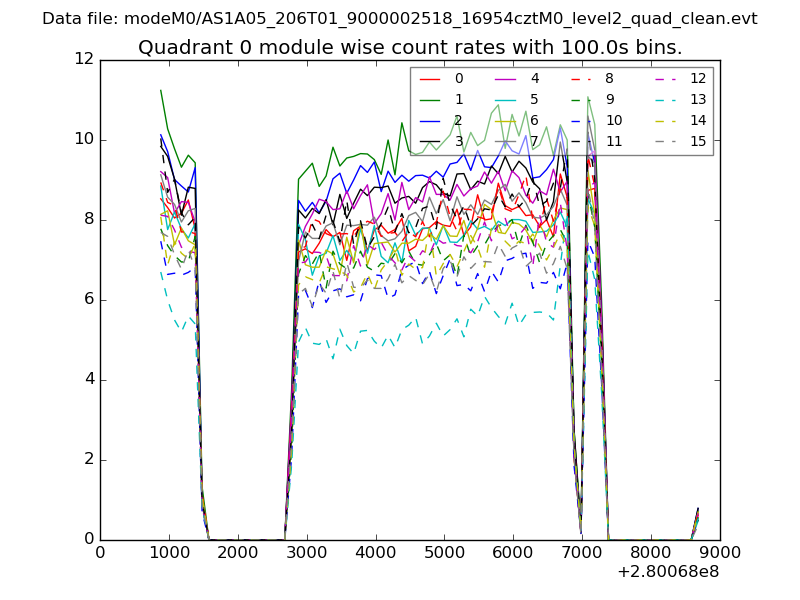 |
 |
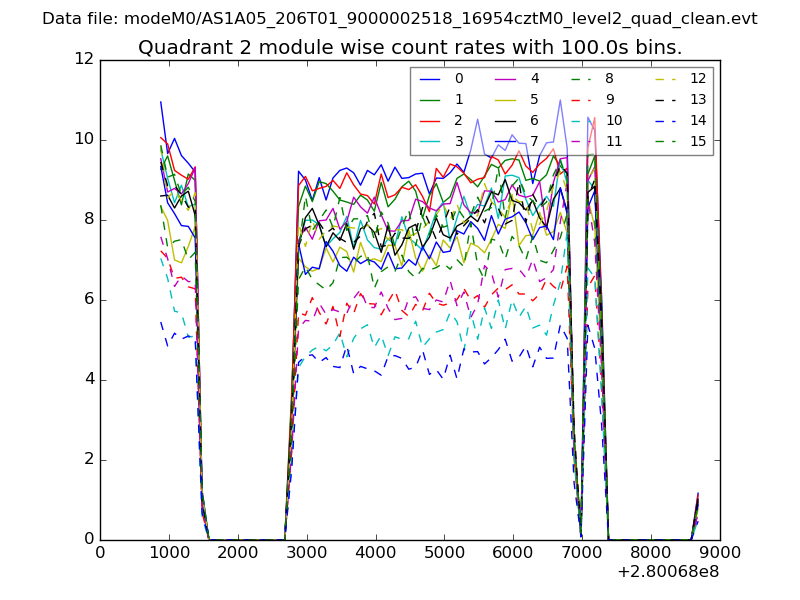
| Module-wise count rates for Quadrant B Data is divided into 100 sec bins |
 |
 |
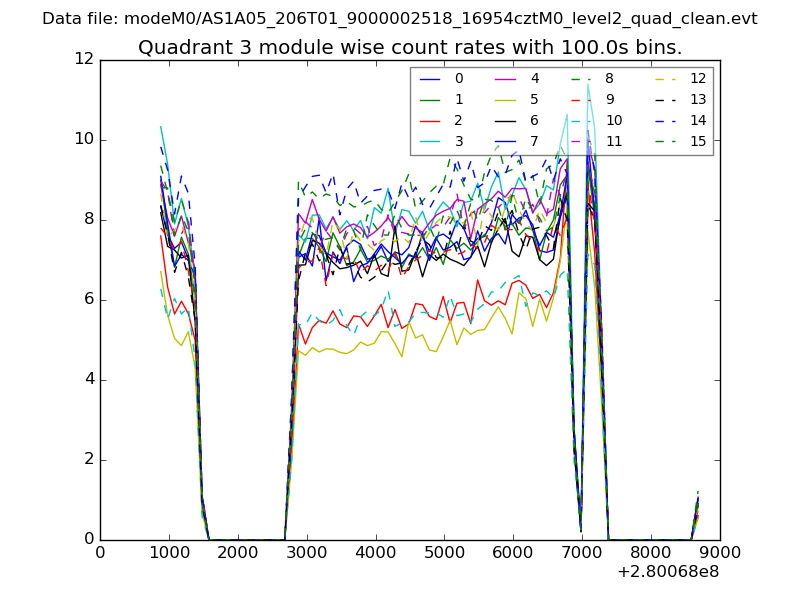
| Module-wise count rates for Quadrant C Data is divided into 100 sec bins |
 |
 |
| Module-wise count rates for Quadrant D Data is divided into 100 sec bins |
 |
 |
| Parameter | Plot |
|---|---|
| CZT HV Monitor | 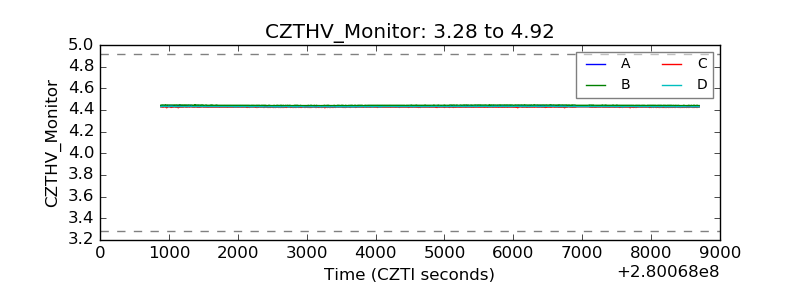 |
| D_VDD | 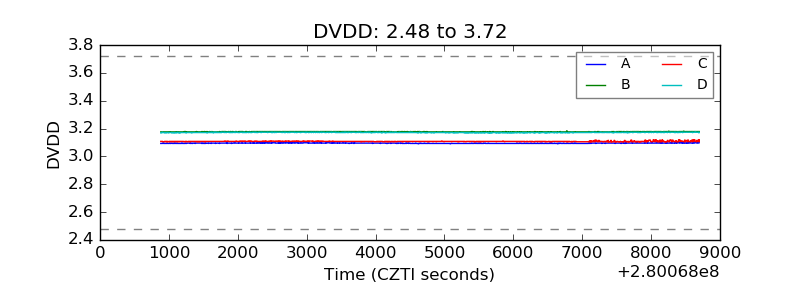 |
| Temperature 1 | 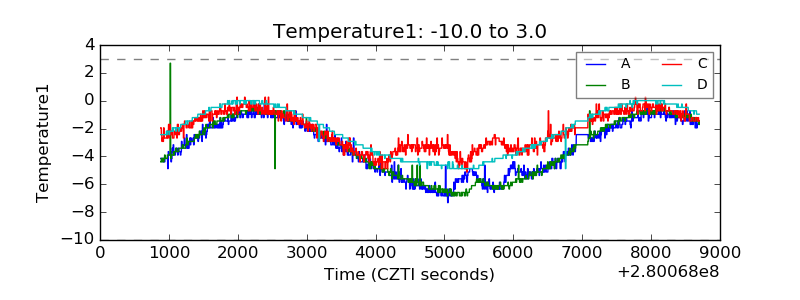 |
| Veto HV Monitor | 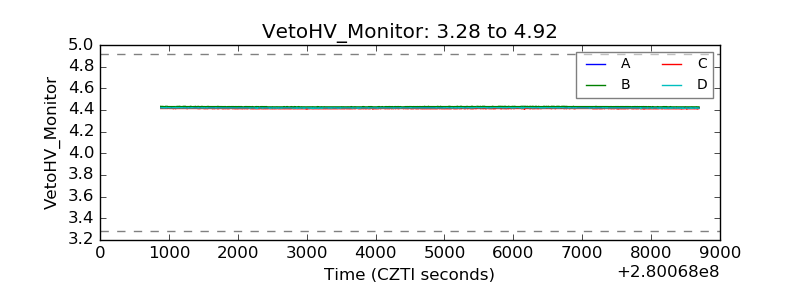 |
| Veto LLD | 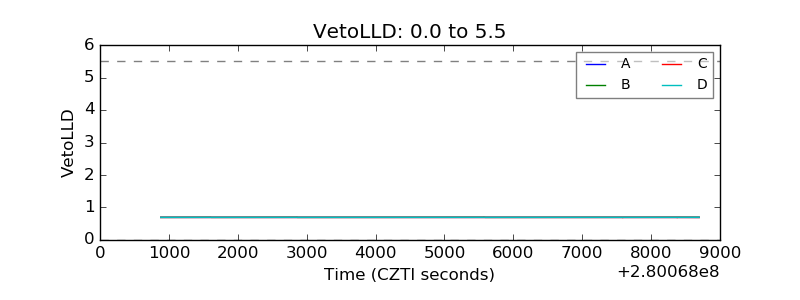 |
| Alpha Counter | 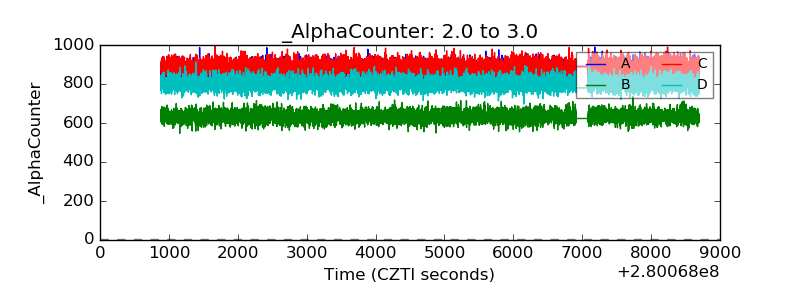 |
| _CPM_Rate | 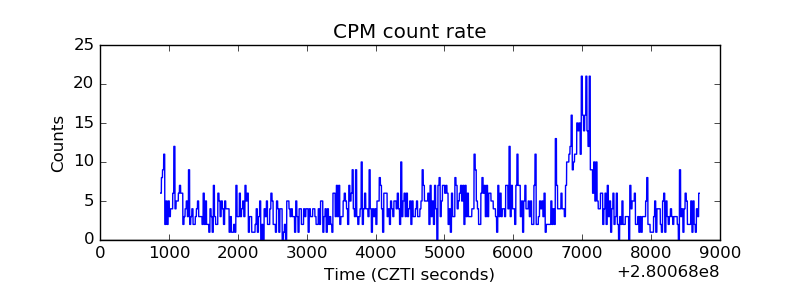 |
| CZT Counter | 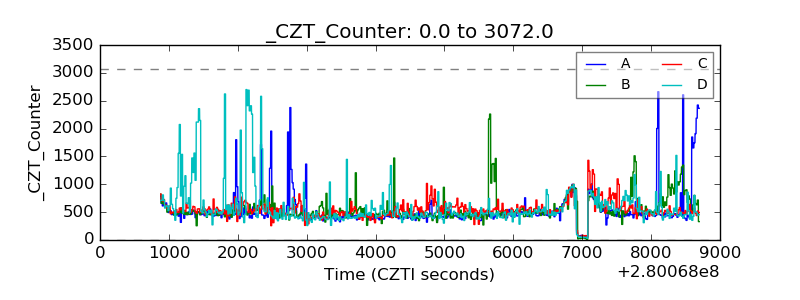 |
| +2.5 Volts monitor | 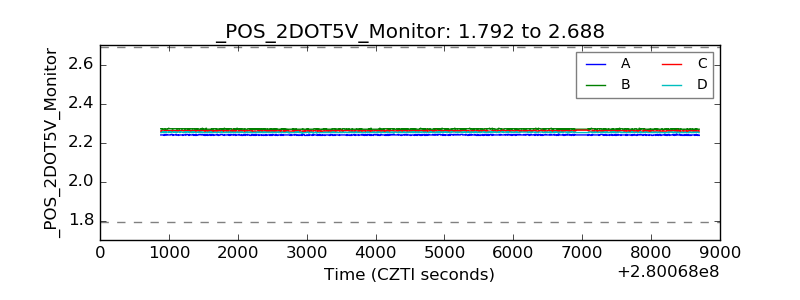 |
| +5 Volts monitor |  |
| _ROLL_ROT |  |
| _Roll_DEC |  |
| _Roll_RA | 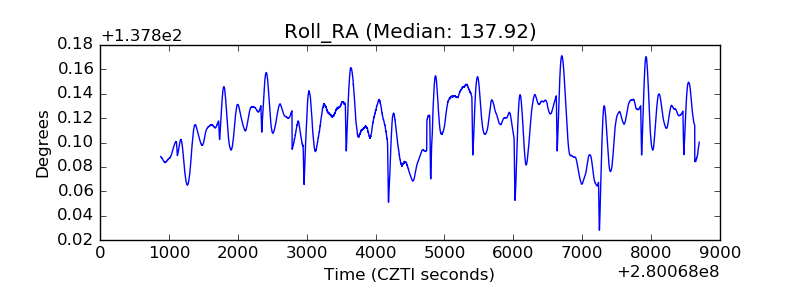 |
| Veto Counter | 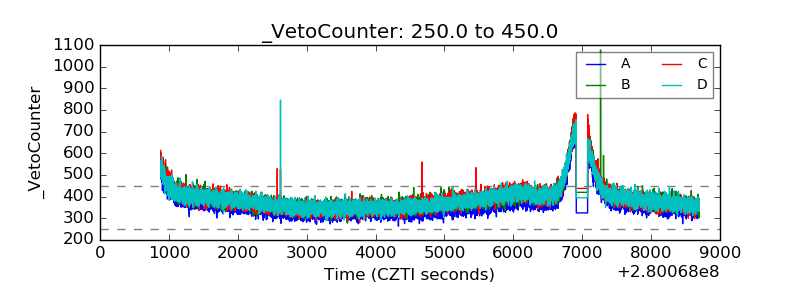 |