| Param | Original file | Final file |
|---|---|---|
| Filename | modeM0/AS1A05_206T01_9000002518_16955cztM0_level2.evt | modeM0/AS1A05_206T01_9000002518_16955cztM0_level2_quad_clean.evt |
| Size (bytes) | 572,325,120 | 97,116,480 |
| Size | 545.8 MB | 92.6 MB |
| Events in quadrant A | 4,131,135 | 614,147 |
| Events in quadrant B | 4,524,441 | 618,770 |
| Events in quadrant C | 4,036,935 | 598,704 |
| Events in quadrant D | 4,135,247 | 591,119 |
| Mode SS | |||
|---|---|---|---|
| Quadrant | BADHDUFLAG | Total packets | Discarded packets |
| A | 0 | 150 | 0 |
| B | 0 | 150 | 0 |
| C | 0 | 150 | 0 |
| D | 0 | 150 | 0 |
| Mode M0 | |||
|---|---|---|---|
| Quadrant | BADHDUFLAG | Total packets | Discarded packets |
| A | 0 | 17367 | 1 |
| B | 0 | 18325 | 1 |
| C | 0 | 16617 | 1 |
| D | 0 | 17395 | 1 |
| Mode M9 | |||
|---|---|---|---|
| Quadrant | BADHDUFLAG | Total packets | Discarded packets |
| A | 0 | 4 | 0 |
| B | 0 | 4 | 0 |
| C | 0 | 4 | 0 |
| D | 0 | 4 | 0 |
| Quadrant | Total seconds | Saturated seconds | Saturation percentage |
|---|---|---|---|
| A | 7449 | 349 | 4.685193% |
| B | 7450 | 332 | 4.456376% |
| C | 7450 | 151 | 2.026846% |
| D | 7450 | 108 | 1.449664% |
Noise dominated data is calculated using 1-second bins in cleaned event files. If a bin has >2000 counts, and if more than 50% of those come from <1% of pixels, then it is considered to be noise-dominated and hence unusable.
| Quadrant | # 1 sec bins | Bins with >0 counts | Bins with >2000 counts | High rate bins dominated by noise | Noise dominated (total time) | Noise dominated (detector-on time) | Marked lightcurve |
|---|---|---|---|---|---|---|---|
| A | 7825 | 7451 | 151 | 151 | 1.93% | 2.03% | 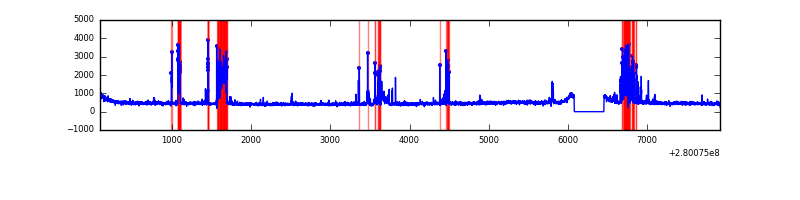 |
| B | 7826 | 7452 | 97 | 97 | 1.24% | 1.30% | 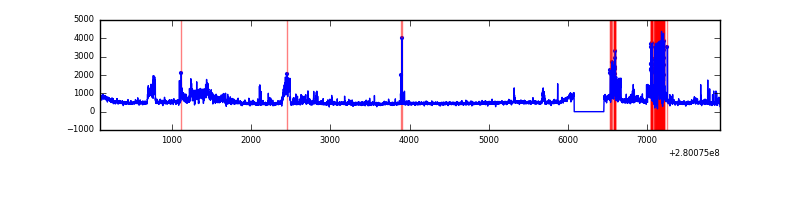 |
| C | 7826 | 7452 | 0 | 0 | 0.00% | 0.00% | 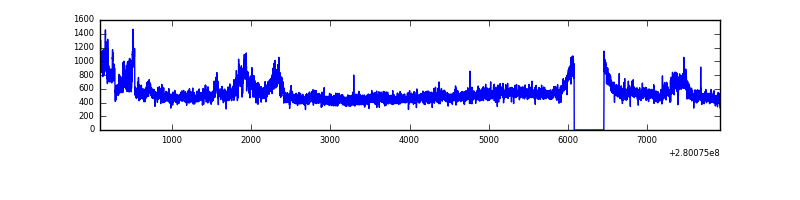 |
| D | 7826 | 7452 | 27 | 27 | 0.35% | 0.36% | 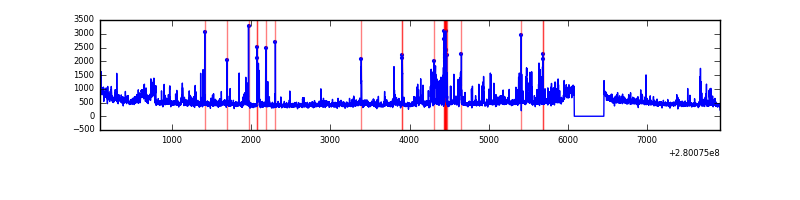 |
Top three noisy pixels from each quadrant. If the there are fewer than three noisy pixels in the level2.evt file, extra rows are filled as -1
| Pixel properties | Quadrant properties | ||||||
|---|---|---|---|---|---|---|---|
| Quadrant | DetID | PixID | Counts | Sigma | Mean | Median | Sigma |
| A | 15 | 174 | 749939 | 4197.91 | 875 | 854 | 178.4 |
| A | 12 | 189 | 11658 | 60.55 | 875 | 854 | 178.4 |
| A | 0 | 226 | 7603 | 37.82 | 875 | 854 | 178.4 |
| B | 3 | 64 | 374332 | 2221.79 | 873 | 849 | 168.1 |
| B | 15 | 35 | 280198 | 1661.8 | 873 | 849 | 168.1 |
| B | 15 | 33 | 159186 | 941.92 | 873 | 849 | 168.1 |
| C | 3 | 233 | 585138 | 2962.56 | 847 | 851 | 197.2 |
| C | 14 | 238 | 129808 | 653.86 | 847 | 851 | 197.2 |
| C | 8 | 128 | 9077 | 41.71 | 847 | 851 | 197.2 |
| D | 1 | 52 | 444842 | 2106.85 | 864 | 836 | 210.7 |
| D | 11 | 129 | 213611 | 1009.64 | 864 | 836 | 210.7 |
| D | 15 | 0 | 116735 | 549.95 | 864 | 836 | 210.7 |
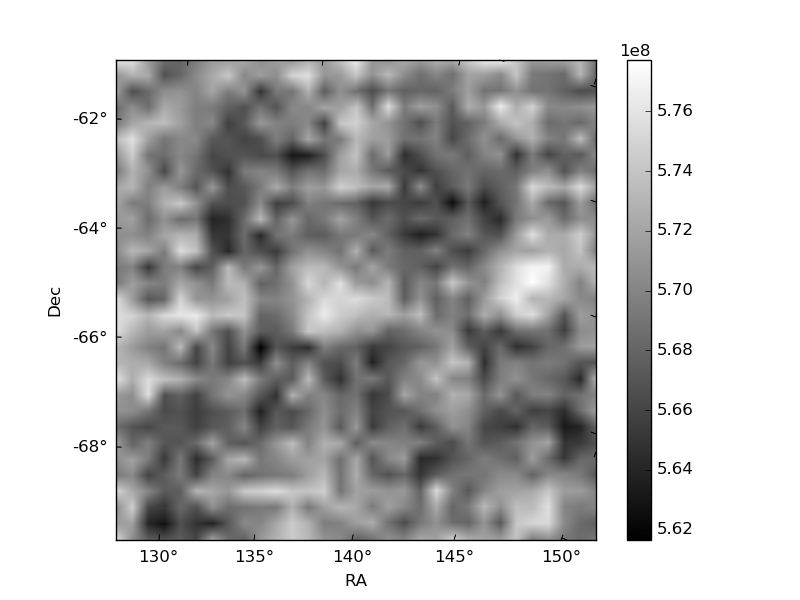
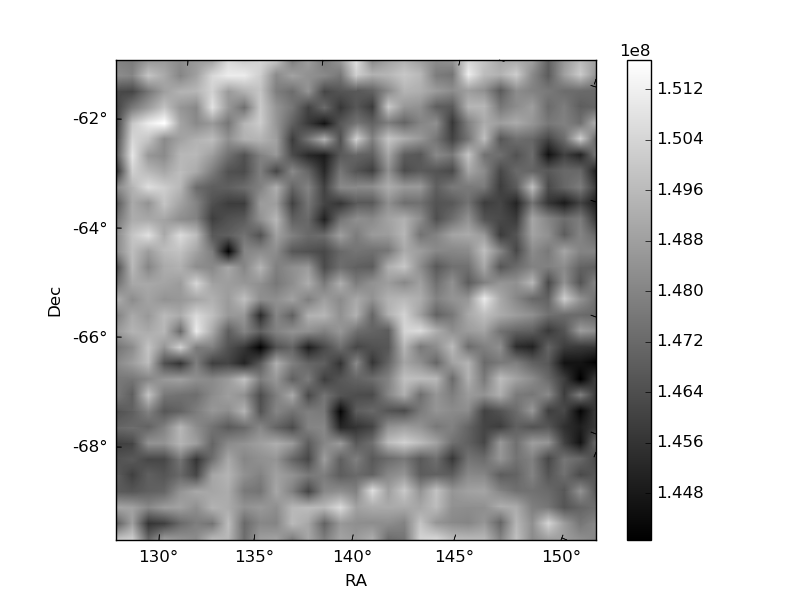
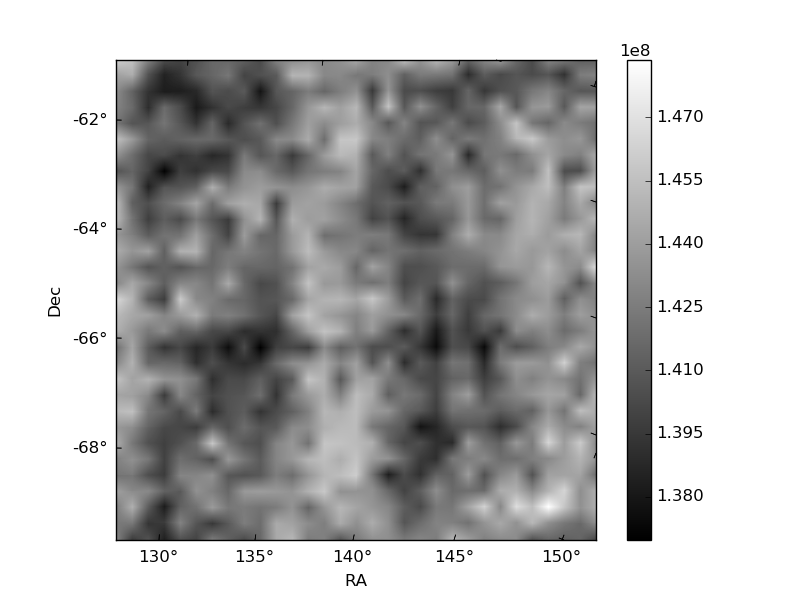
Histogram calculated using DETX and DETY for each event in the final _common_clean file
| Quadrant A | 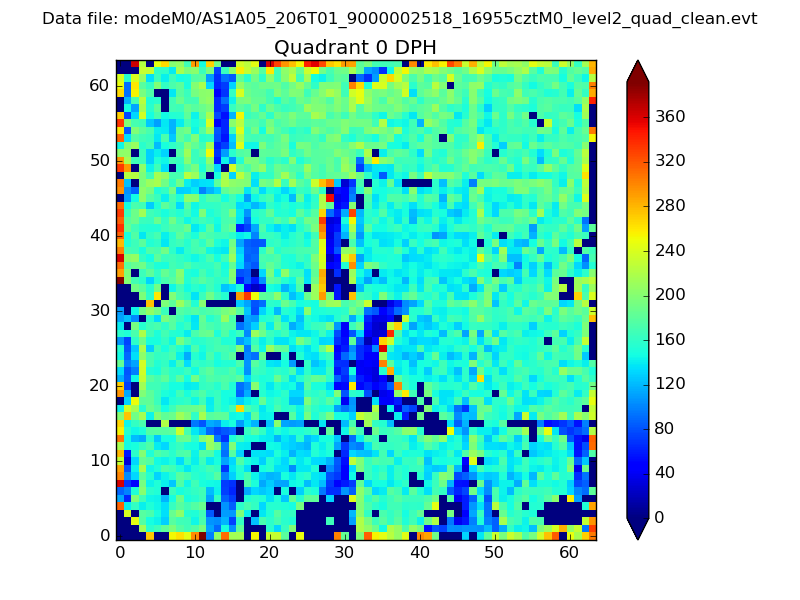 |
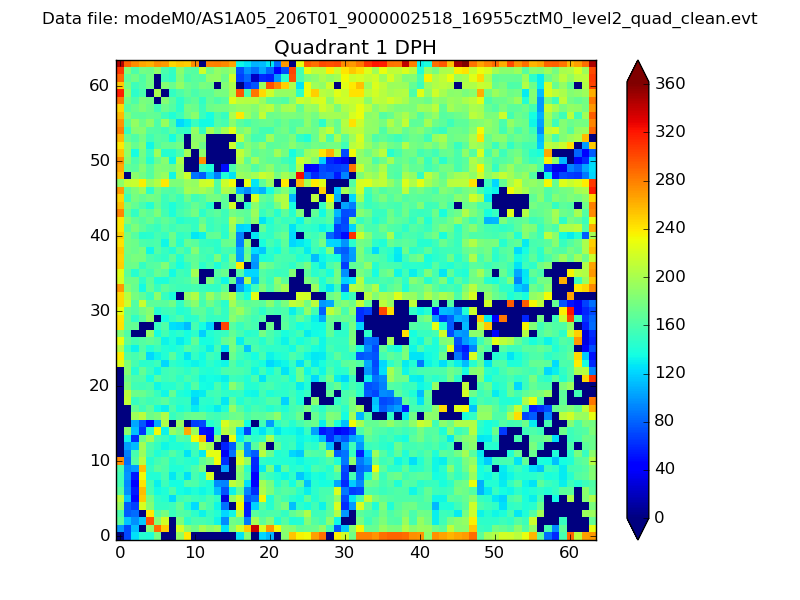 |
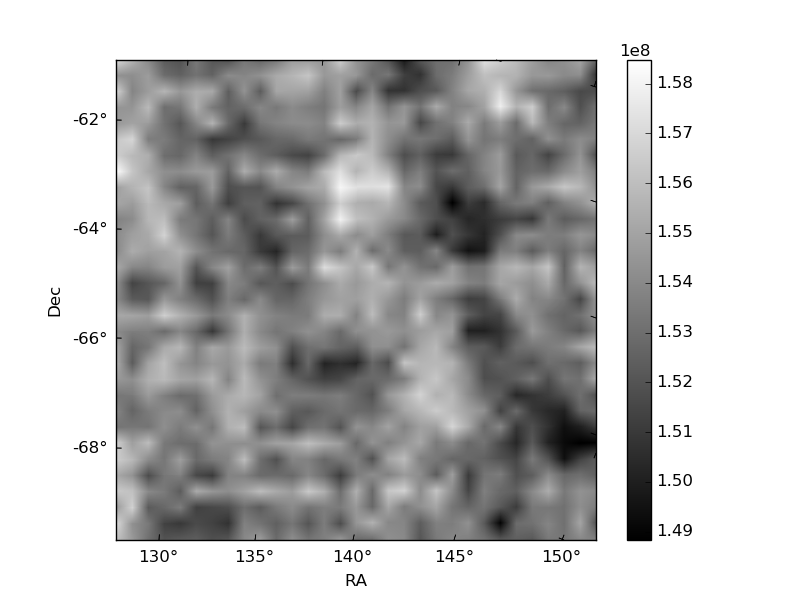
Quadrant B |
|---|---|---|---|
| Quadrant D | 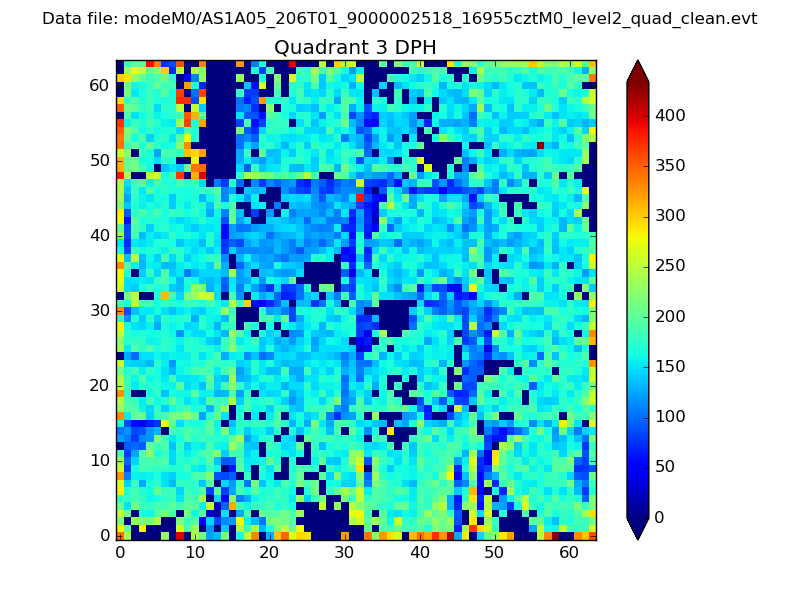 |
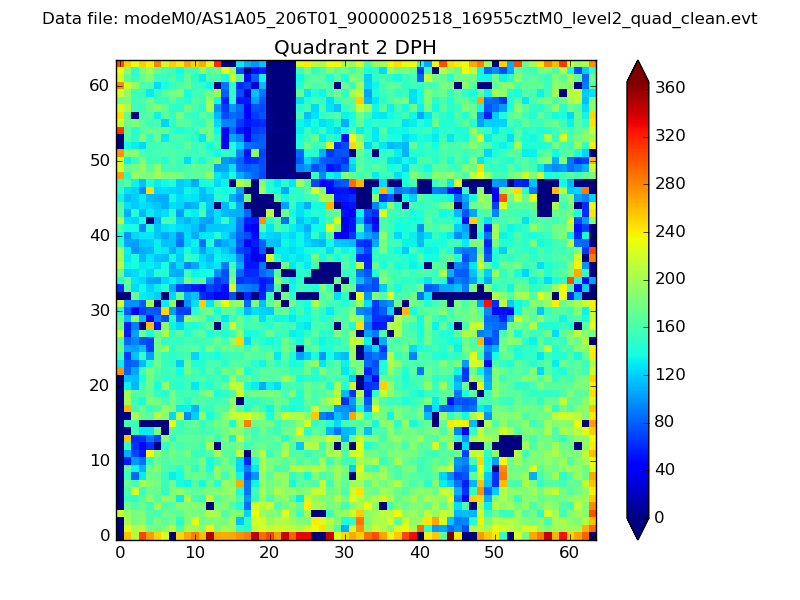 |
Quadrant C |
| Plot type | Count rate plots | Images |
|---|---|---|
| Comparison with Poisson distribution Blue bars denote a histogram of data divided into 1 sec bins. Red curve is a Poisson curve with rate = median count rate of data. |
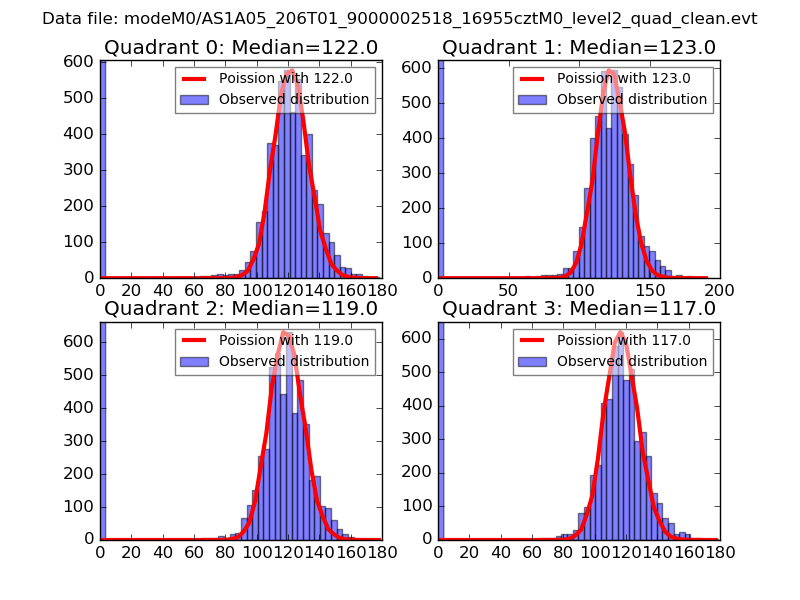 |
 |
| Quadrant-wise count rates Data is divided into 100 sec bins |
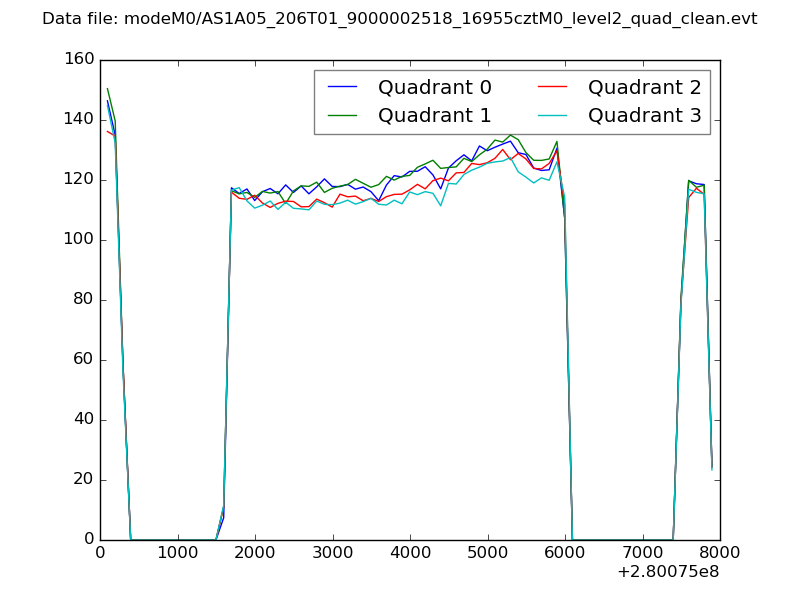 |
|
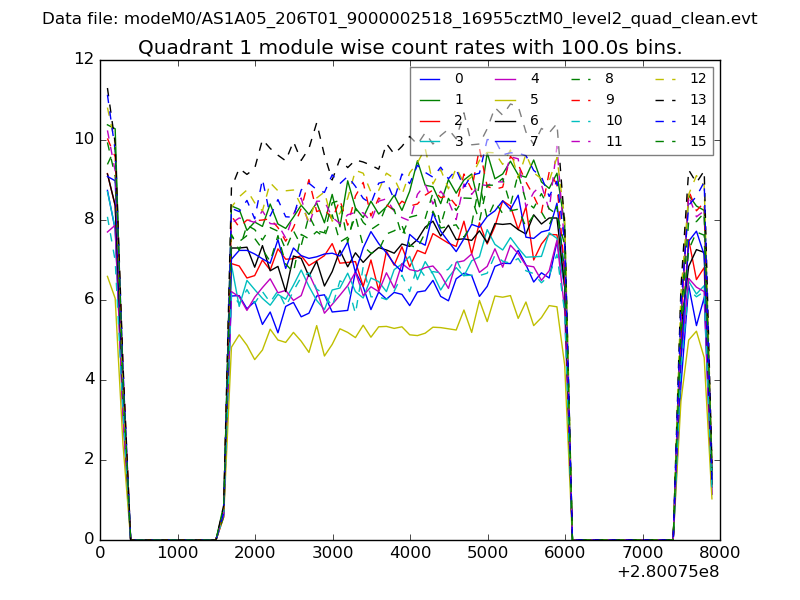
| Module-wise count rates for Quadrant A Data is divided into 100 sec bins |
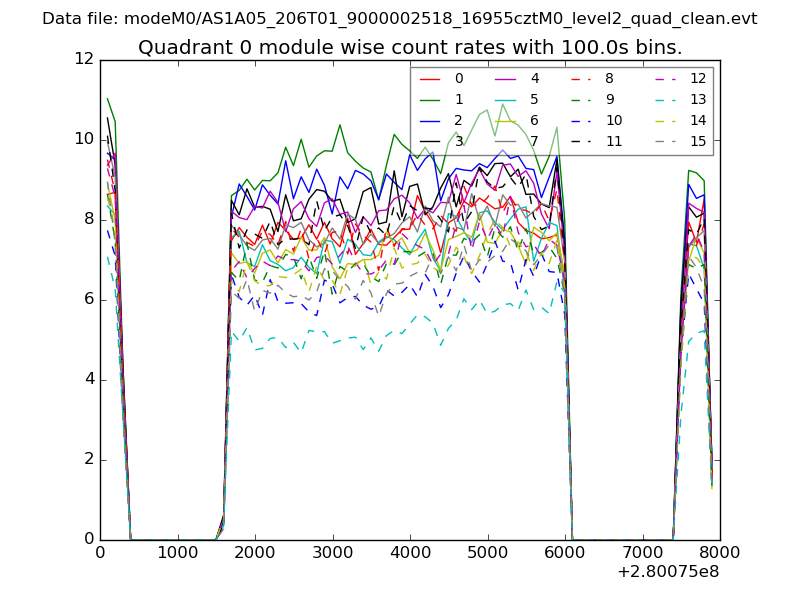 |
 |
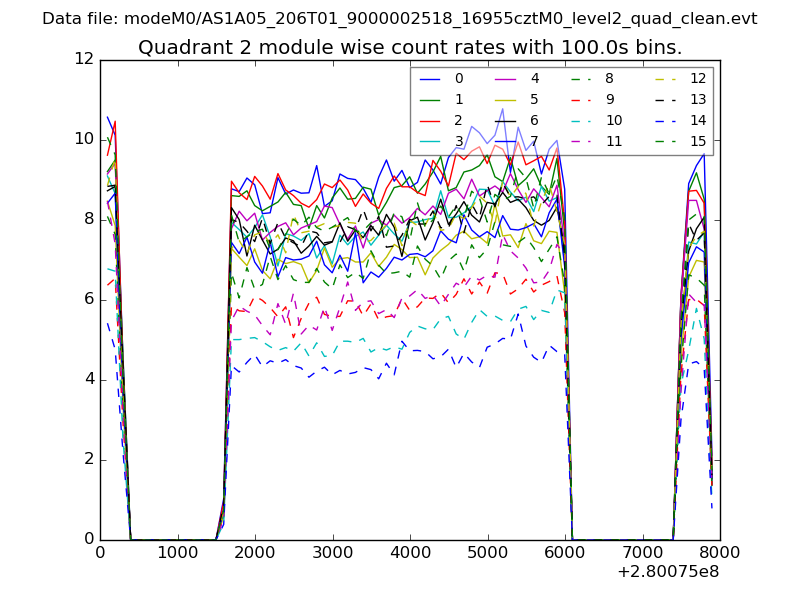
| Module-wise count rates for Quadrant B Data is divided into 100 sec bins |
 |
 |
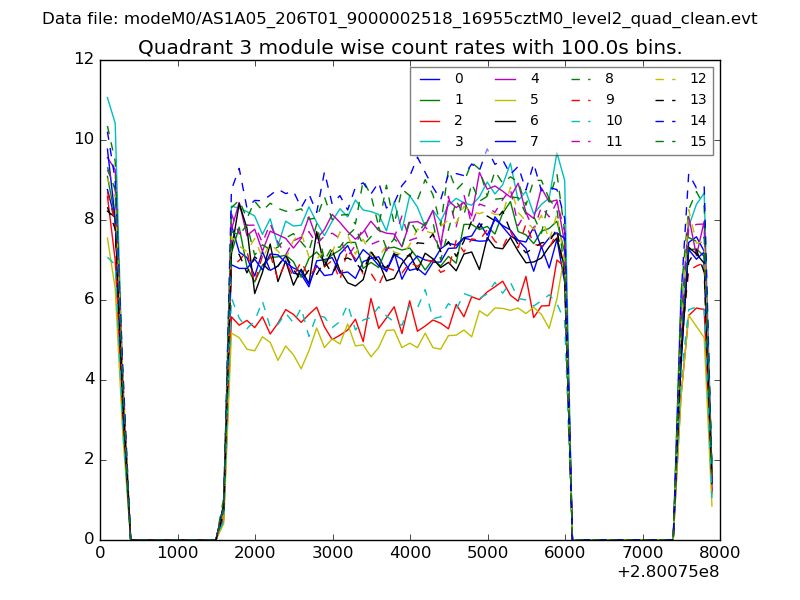
| Module-wise count rates for Quadrant C Data is divided into 100 sec bins |
 |
 |
| Module-wise count rates for Quadrant D Data is divided into 100 sec bins |
 |
 |
| Parameter | Plot |
|---|---|
| CZT HV Monitor | 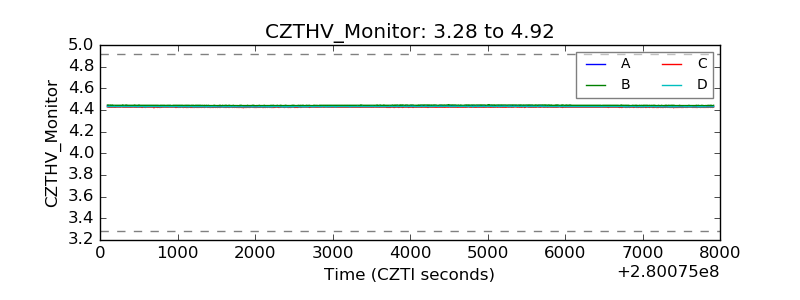 |
| D_VDD | 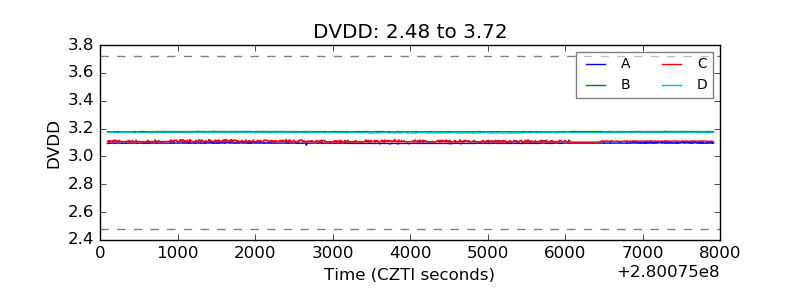 |
| Temperature 1 |  |
| Veto HV Monitor | 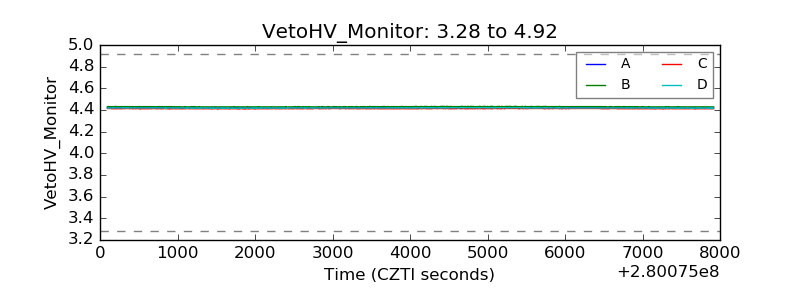 |
| Veto LLD | 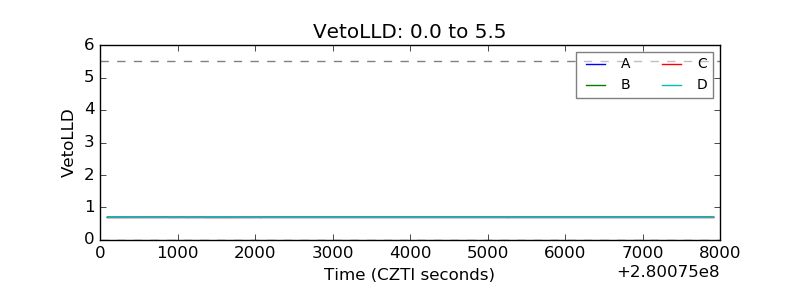 |
| Alpha Counter | 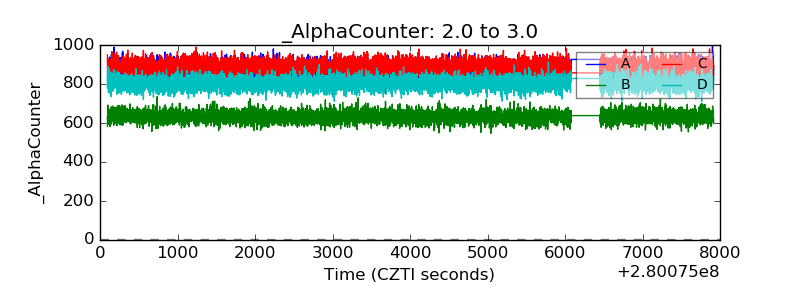 |
| _CPM_Rate | 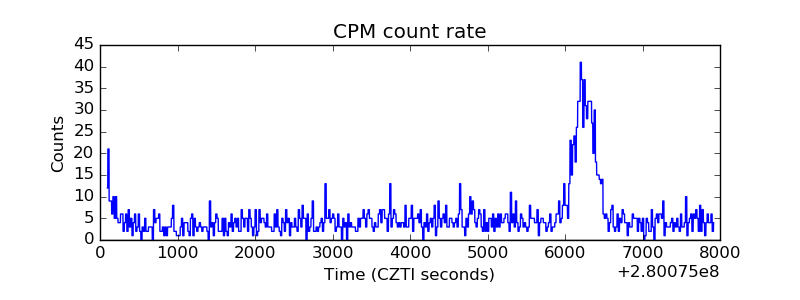 |
| CZT Counter | 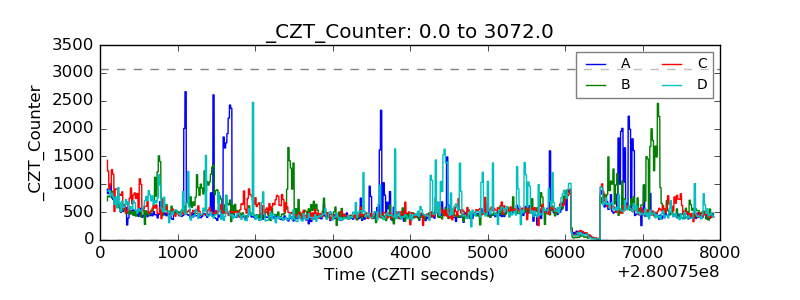 |
| +2.5 Volts monitor |  |
| +5 Volts monitor | 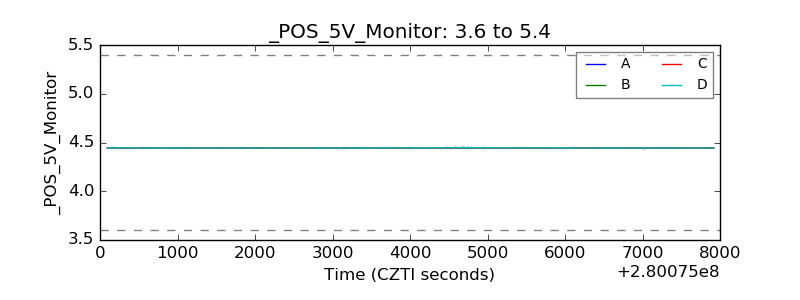 |
| _ROLL_ROT | 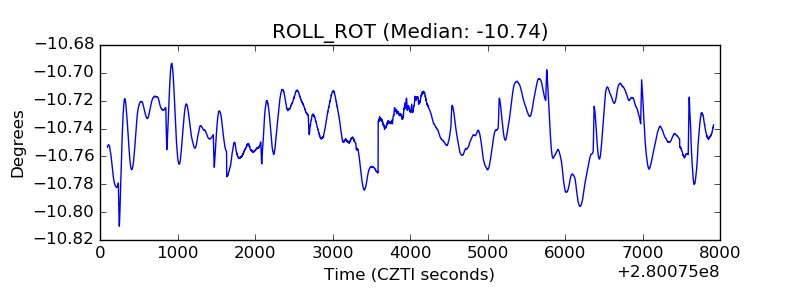 |
| _Roll_DEC | 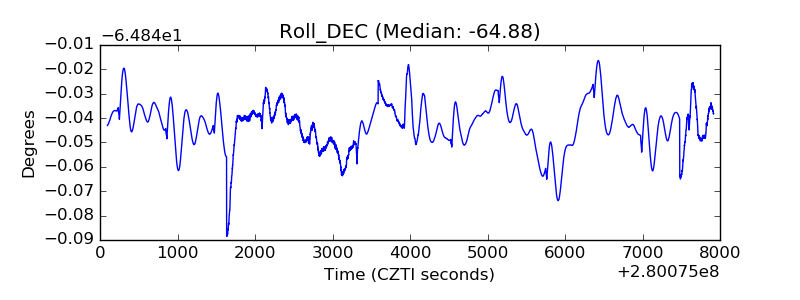 |
| _Roll_RA | 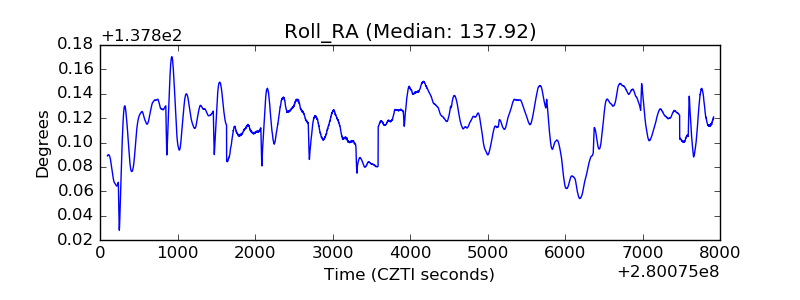 |
| Veto Counter | 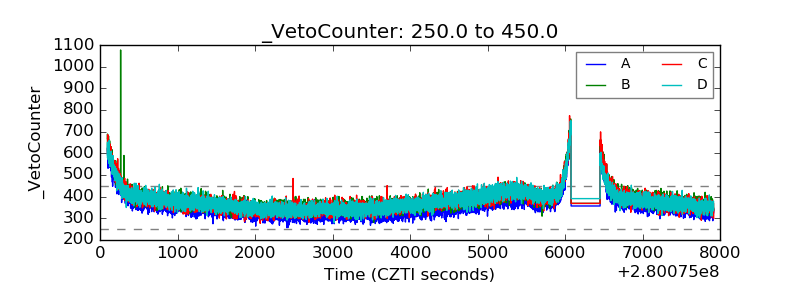 |