| Param | Original file | Final file |
|---|---|---|
| Filename | modeM0/AS1A05_206T01_9000002518_16957cztM0_level2.evt | modeM0/AS1A05_206T01_9000002518_16957cztM0_level2_quad_clean.evt |
| Size (bytes) | 631,673,280 | 115,390,080 |
| Size | 602.4 MB | 110.0 MB |
| Events in quadrant A | 5,187,638 | 730,312 |
| Events in quadrant B | 4,821,083 | 750,628 |
| Events in quadrant C | 4,690,223 | 726,320 |
| Events in quadrant D | 3,880,767 | 723,046 |
| Mode SS | |||
|---|---|---|---|
| Quadrant | BADHDUFLAG | Total packets | Discarded packets |
| A | 0 | 166 | 0 |
| B | 0 | 166 | 0 |
| C | 0 | 166 | 0 |
| D | 0 | 166 | 0 |
| Mode M0 | |||
|---|---|---|---|
| Quadrant | BADHDUFLAG | Total packets | Discarded packets |
| A | 0 | 21105 | 2 |
| B | 0 | 19659 | 2 |
| C | 0 | 19466 | 2 |
| D | 0 | 17112 | 2 |
| Mode M9 | |||
|---|---|---|---|
| Quadrant | BADHDUFLAG | Total packets | Discarded packets |
| A | 0 | 5 | 0 |
| B | 0 | 6 | 0 |
| C | 0 | 6 | 0 |
| D | 0 | 6 | 0 |
| Quadrant | Total seconds | Saturated seconds | Saturation percentage |
|---|---|---|---|
| A | 8114 | 638 | 7.862953% |
| B | 8114 | 345 | 4.251910% |
| C | 8114 | 125 | 1.540547% |
| D | 8114 | 58 | 0.714814% |
Noise dominated data is calculated using 1-second bins in cleaned event files. If a bin has >2000 counts, and if more than 50% of those come from <1% of pixels, then it is considered to be noise-dominated and hence unusable.
| Quadrant | # 1 sec bins | Bins with >0 counts | Bins with >2000 counts | High rate bins dominated by noise | Noise dominated (total time) | Noise dominated (detector-on time) | Marked lightcurve |
|---|---|---|---|---|---|---|---|
| A | 8680 | 8115 | 364 | 364 | 4.19% | 4.49% | 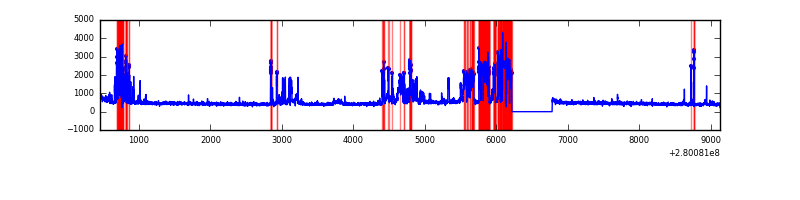 |
| B | 8680 | 8116 | 170 | 170 | 1.96% | 2.09% | 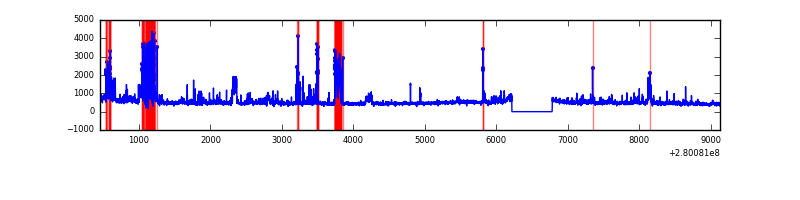 |
| C | 8680 | 8116 | 1 | 1 | 0.01% | 0.01% |  |
| D | 8680 | 8116 | 20 | 20 | 0.23% | 0.25% | 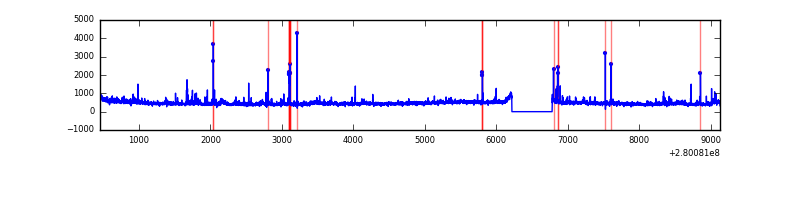 |
Top three noisy pixels from each quadrant. If the there are fewer than three noisy pixels in the level2.evt file, extra rows are filled as -1
| Pixel properties | Quadrant properties | ||||||
|---|---|---|---|---|---|---|---|
| Quadrant | DetID | PixID | Counts | Sigma | Mean | Median | Sigma |
| A | 15 | 174 | 1703344 | 9306.84 | 902 | 881 | 182.9 |
| A | 9 | 143 | 16718 | 86.58 | 902 | 881 | 182.9 |
| A | 0 | 226 | 8089 | 39.4 | 902 | 881 | 182.9 |
| B | 3 | 64 | 689389 | 3850.44 | 927 | 902 | 178.8 |
| B | 15 | 35 | 230182 | 1282.27 | 927 | 902 | 178.8 |
| B | 3 | 209 | 58780 | 323.69 | 927 | 902 | 178.8 |
| C | 3 | 233 | 1049027 | 4966.87 | 895 | 898 | 211.0 |
| C | 14 | 238 | 137068 | 645.28 | 895 | 898 | 211.0 |
| C | 0 | 207 | 14298 | 63.5 | 895 | 898 | 211.0 |
| D | 1 | 52 | 133100 | 594.44 | 910 | 882 | 222.4 |
| D | 15 | 0 | 110613 | 493.34 | 910 | 882 | 222.4 |
| D | 11 | 129 | 96450 | 429.66 | 910 | 882 | 222.4 |
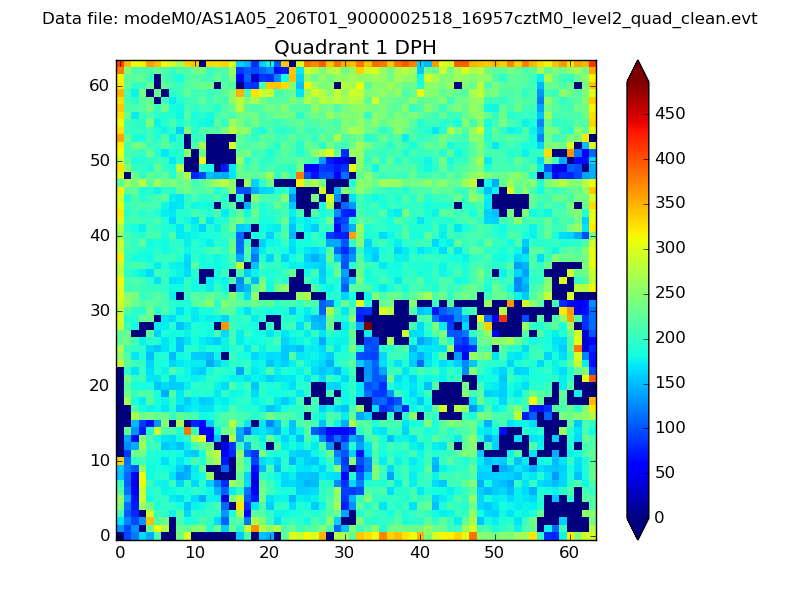
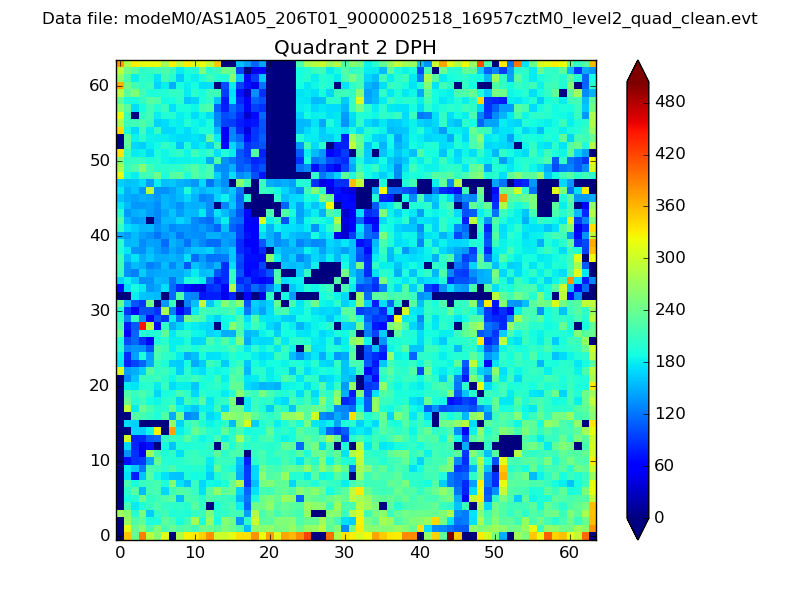
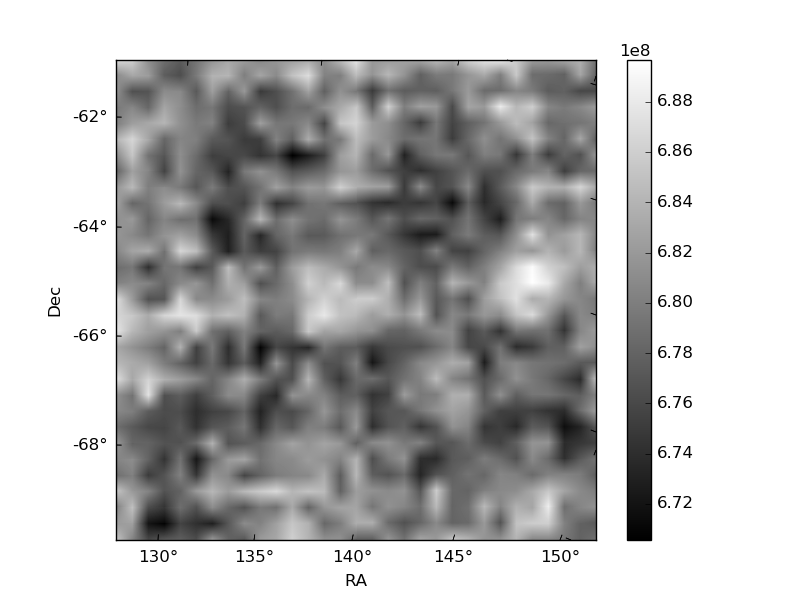
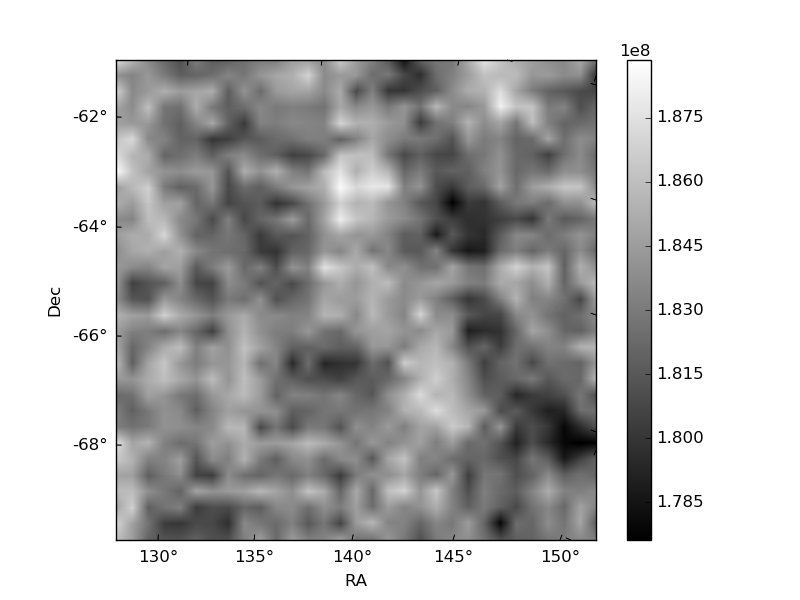
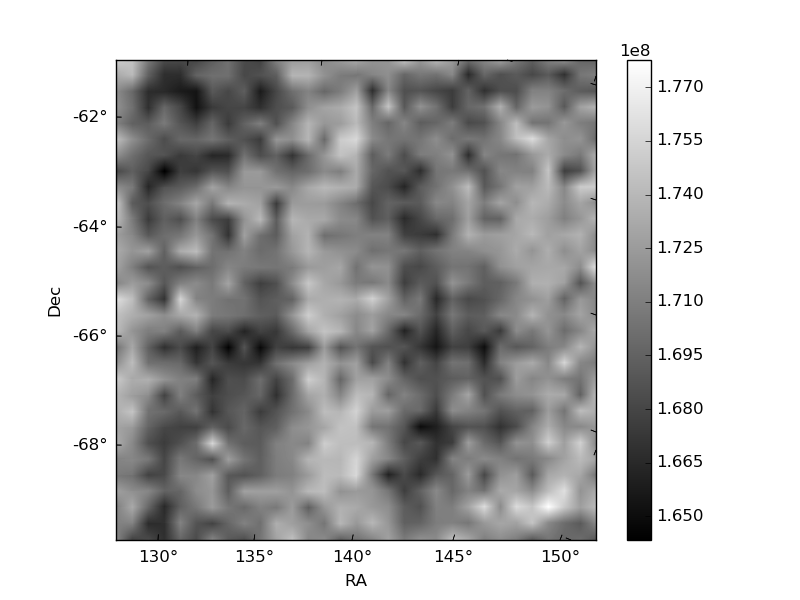
Histogram calculated using DETX and DETY for each event in the final _common_clean file
| Quadrant A | 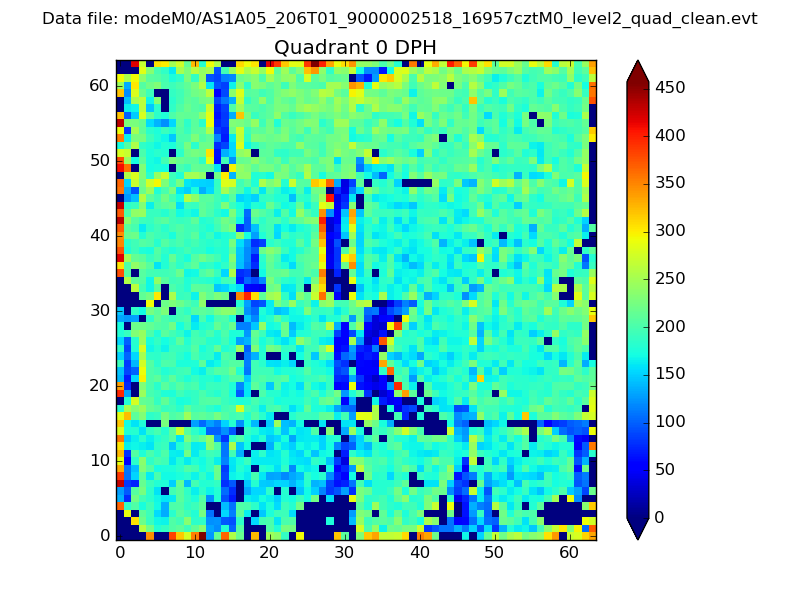 |
 |
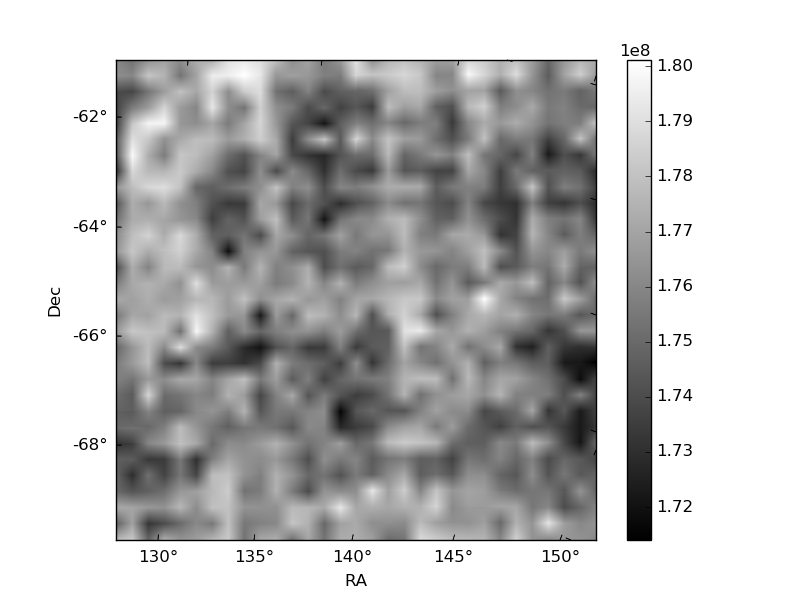
Quadrant B |
|---|---|---|---|
| Quadrant D | 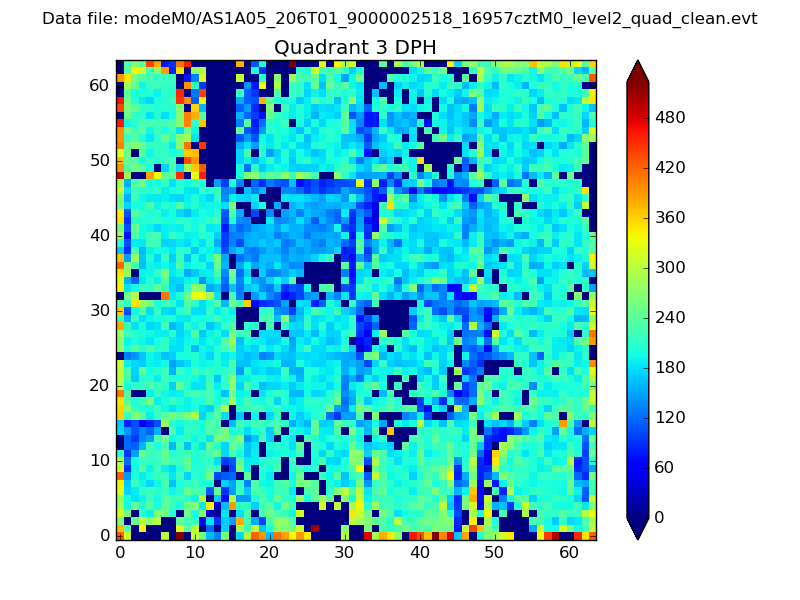 |
 |
Quadrant C |
| Plot type | Count rate plots | Images |
|---|---|---|
| Comparison with Poisson distribution Blue bars denote a histogram of data divided into 1 sec bins. Red curve is a Poisson curve with rate = median count rate of data. |
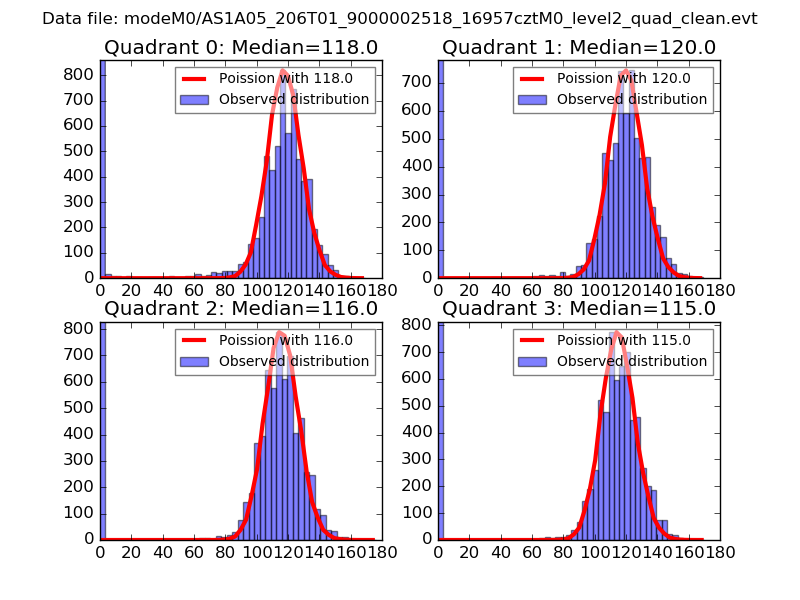 |
 |
| Quadrant-wise count rates Data is divided into 100 sec bins |
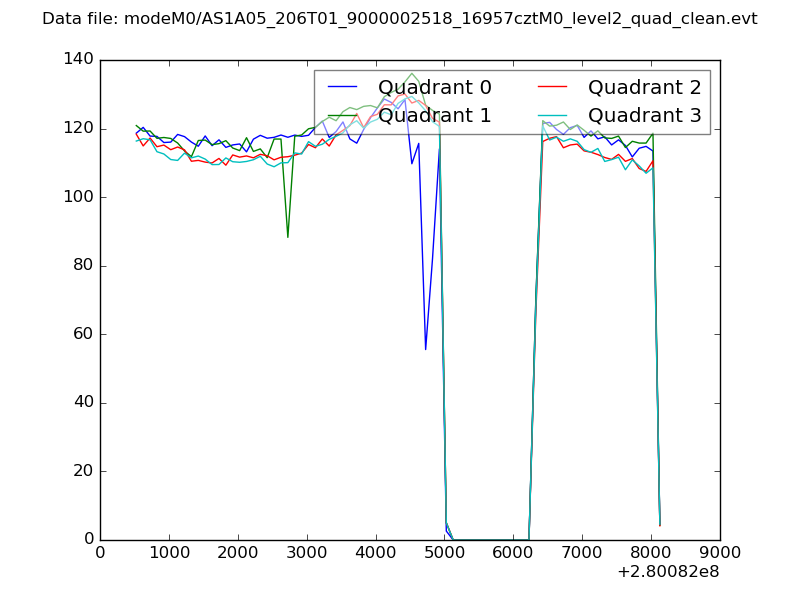 |
|
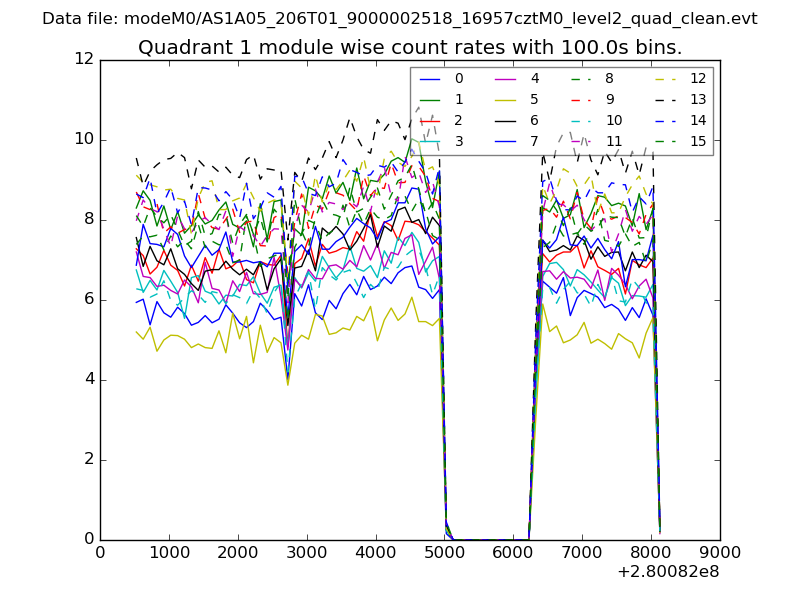
| Module-wise count rates for Quadrant A Data is divided into 100 sec bins |
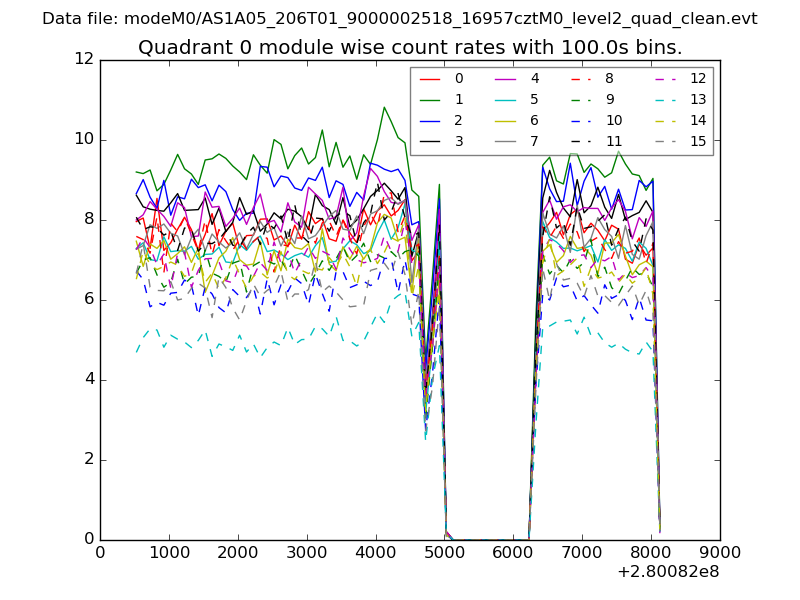 |
 |
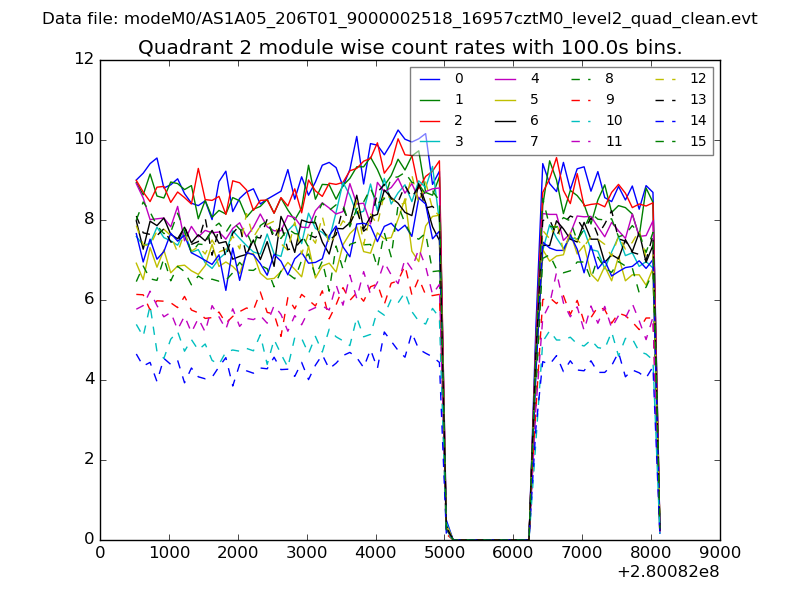
| Module-wise count rates for Quadrant B Data is divided into 100 sec bins |
 |
 |
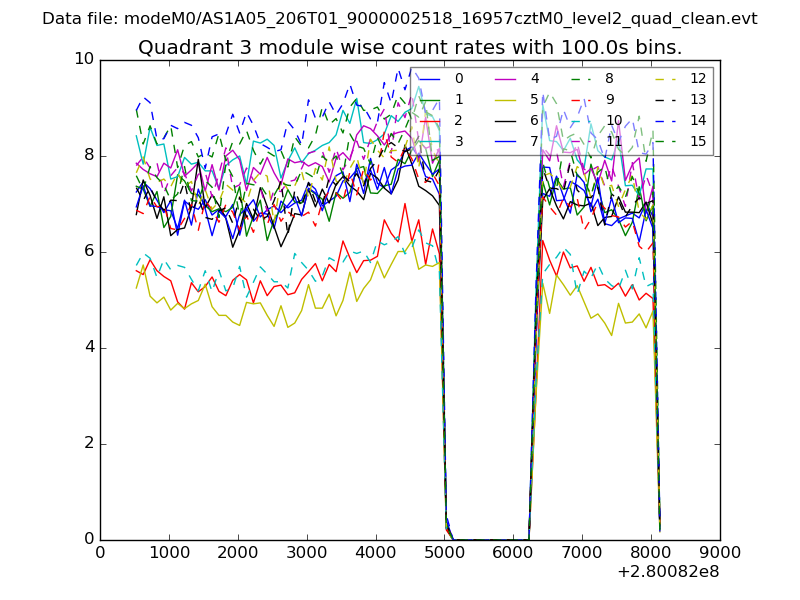
| Module-wise count rates for Quadrant C Data is divided into 100 sec bins |
 |
 |
| Module-wise count rates for Quadrant D Data is divided into 100 sec bins |
 |
 |
| Parameter | Plot |
|---|---|
| CZT HV Monitor | 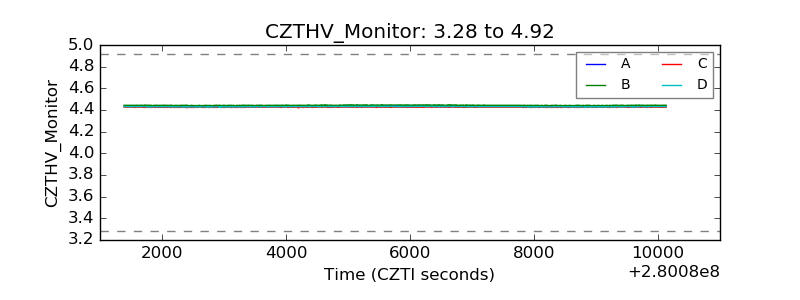 |
| D_VDD | 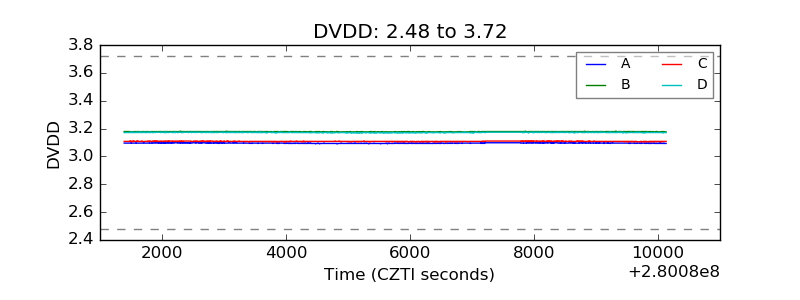 |
| Temperature 1 | 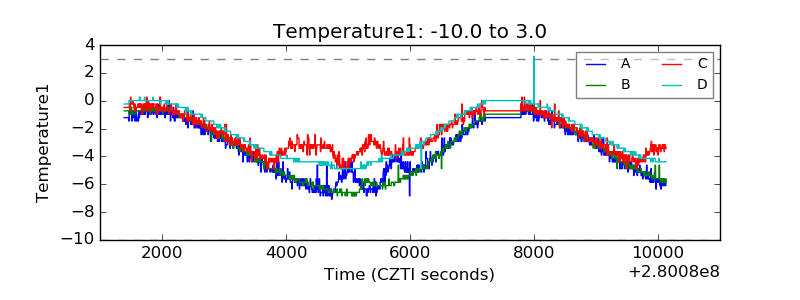 |
| Veto HV Monitor | 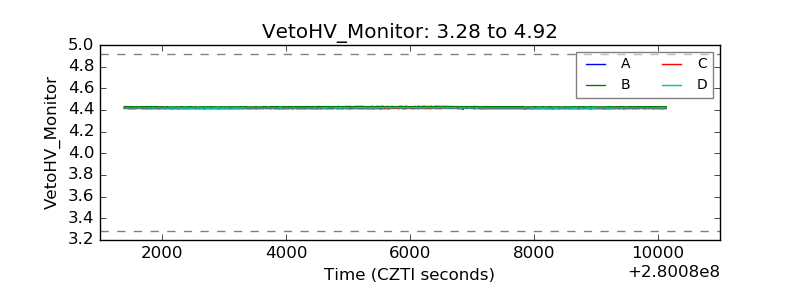 |
| Veto LLD | 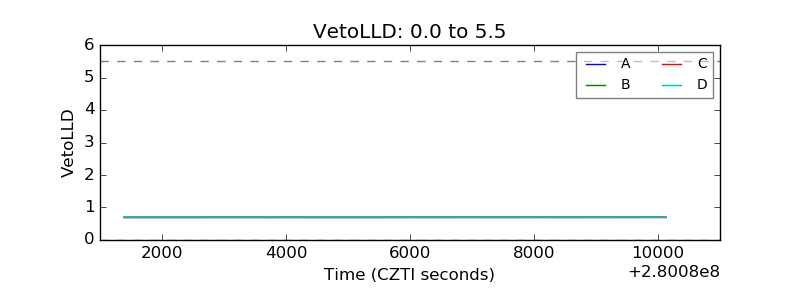 |
| Alpha Counter | 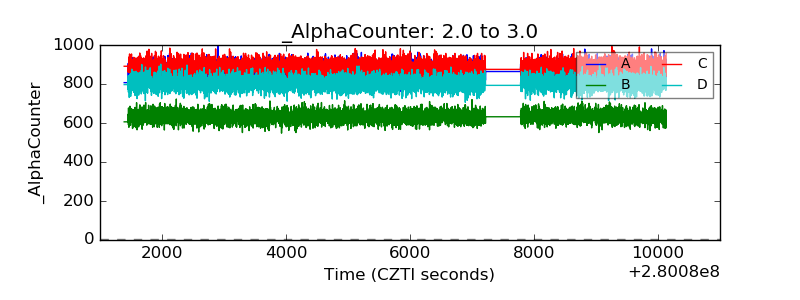 |
| _CPM_Rate | 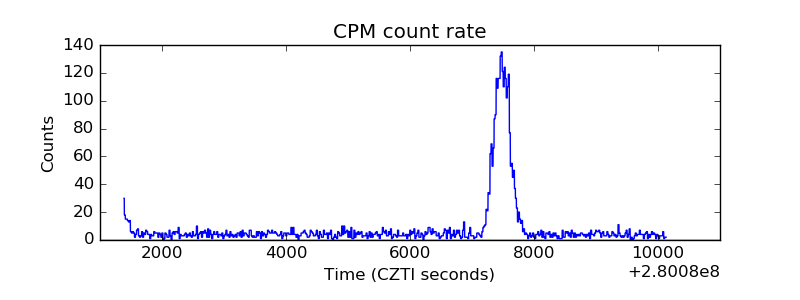 |
| CZT Counter | 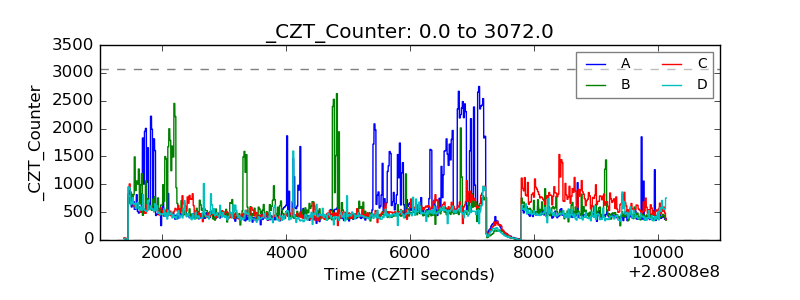 |
| +2.5 Volts monitor | 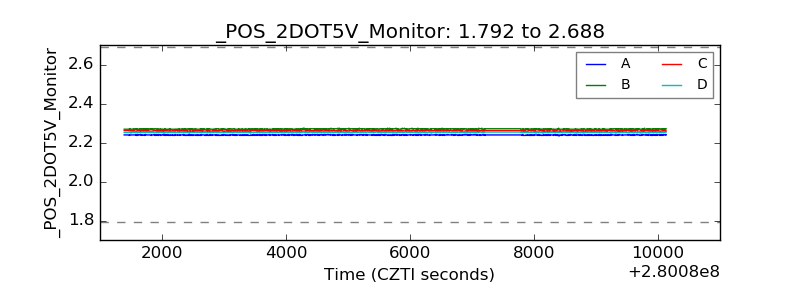 |
| +5 Volts monitor |  |
| _ROLL_ROT |  |
| _Roll_DEC | 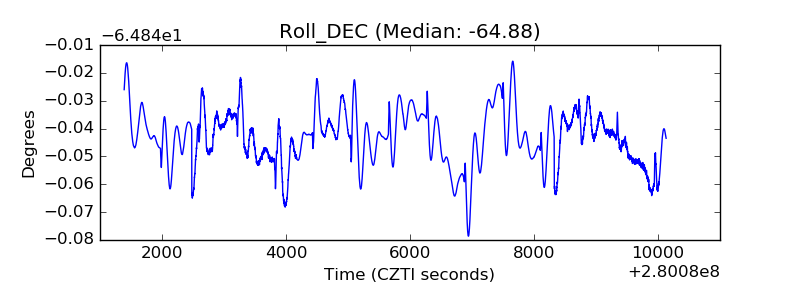 |
| _Roll_RA | 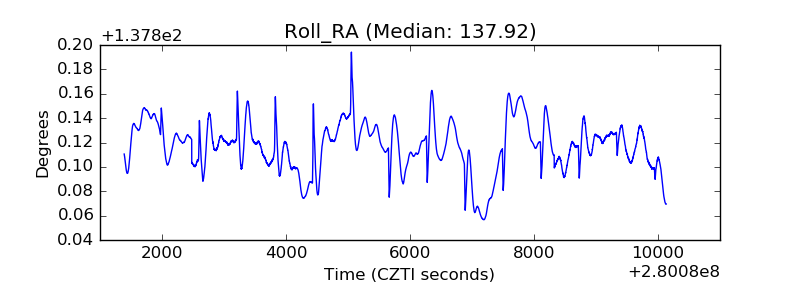 |
| Veto Counter | 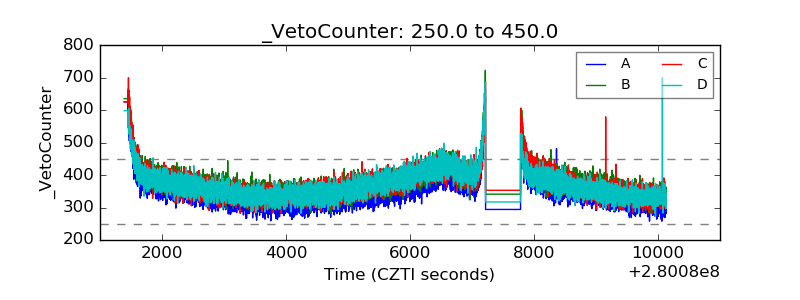 |