| Param | Original file | Final file |
|---|---|---|
| Filename | modeM0/AS1A05_188T01_9000002520_16957cztM0_level2.evt | modeM0/AS1A05_188T01_9000002520_16957cztM0_level2_quad_clean.evt |
| Size (bytes) | 340,773,120 | 54,783,360 |
| Size | 325.0 MB | 52.2 MB |
| Events in quadrant A | 1,951,412 | 349,269 |
| Events in quadrant B | 2,670,115 | 350,734 |
| Events in quadrant C | 2,327,532 | 339,111 |
| Events in quadrant D | 3,086,449 | 324,935 |
| Mode M9 | |||
|---|---|---|---|
| Quadrant | BADHDUFLAG | Total packets | Discarded packets |
| A | 0 | 7 | 0 |
| B | 0 | 7 | 0 |
| C | 0 | 7 | 0 |
| D | 0 | 7 | 0 |
| Mode M0 | |||
|---|---|---|---|
| Quadrant | BADHDUFLAG | Total packets | Discarded packets |
| A | 0 | 8524 | 1 |
| B | 0 | 10631 | 2 |
| C | 0 | 9389 | 1 |
| D | 0 | 11977 | 1 |
| Mode SS | |||
|---|---|---|---|
| Quadrant | BADHDUFLAG | Total packets | Discarded packets |
| A | 0 | 86 | 0 |
| B | 0 | 86 | 0 |
| C | 0 | 86 | 0 |
| D | 0 | 86 | 0 |
| Quadrant | Total seconds | Saturated seconds | Saturation percentage |
|---|---|---|---|
| A | 4178 | 36 | 0.861656% |
| B | 4177 | 251 | 6.009097% |
| C | 4177 | 61 | 1.460378% |
| D | 4177 | 250 | 5.985157% |
Noise dominated data is calculated using 1-second bins in cleaned event files. If a bin has >2000 counts, and if more than 50% of those come from <1% of pixels, then it is considered to be noise-dominated and hence unusable.
| Quadrant | # 1 sec bins | Bins with >0 counts | Bins with >2000 counts | High rate bins dominated by noise | Noise dominated (total time) | Noise dominated (detector-on time) | Marked lightcurve |
|---|---|---|---|---|---|---|---|
| A | 4899 | 4180 | 0 | 0 | 0.00% | 0.00% | 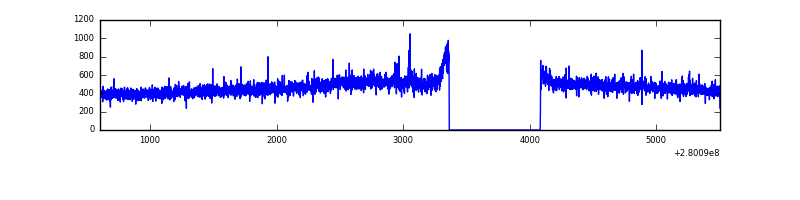 |
| B | 4898 | 4179 | 124 | 124 | 2.53% | 2.97% | 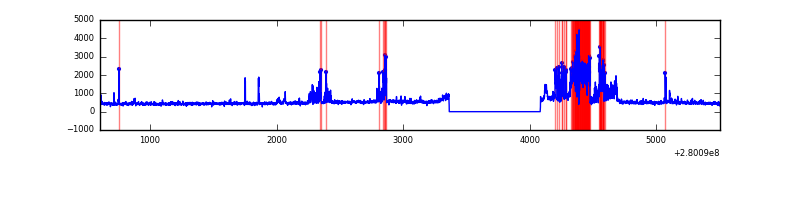 |
| C | 4898 | 4179 | 0 | 0 | 0.00% | 0.00% | 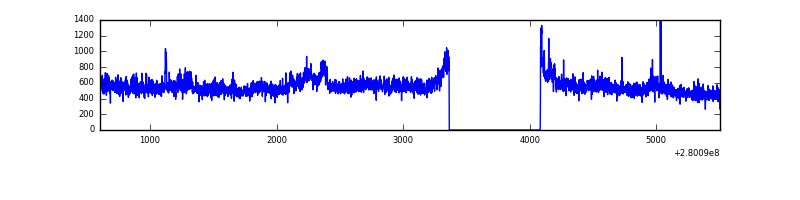 |
| D | 4898 | 4179 | 176 | 176 | 3.59% | 4.21% | 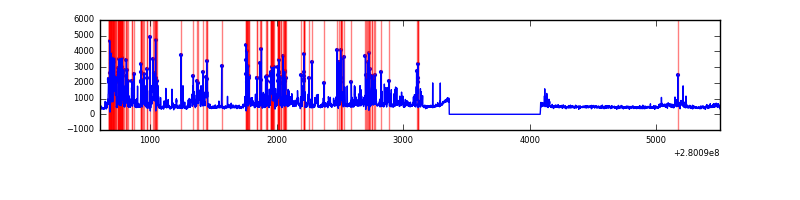 |
Top three noisy pixels from each quadrant. If the there are fewer than three noisy pixels in the level2.evt file, extra rows are filled as -1
| Pixel properties | Quadrant properties | ||||||
|---|---|---|---|---|---|---|---|
| Quadrant | DetID | PixID | Counts | Sigma | Mean | Median | Sigma |
| A | 12 | 189 | 5625 | 49.09 | 506 | 493 | 104.5 |
| A | 0 | 226 | 4385 | 37.23 | 506 | 493 | 104.5 |
| A | 12 | 194 | 3844 | 32.06 | 506 | 493 | 104.5 |
| B | 3 | 64 | 552692 | 5729.43 | 496 | 483 | 96.4 |
| B | 15 | 35 | 105061 | 1085.05 | 496 | 483 | 96.4 |
| B | 0 | 229 | 16753 | 168.81 | 496 | 483 | 96.4 |
| C | 3 | 233 | 347876 | 3013.99 | 486 | 488 | 115.3 |
| C | 14 | 238 | 74079 | 638.49 | 486 | 488 | 115.3 |
| C | 0 | 207 | 4767 | 37.13 | 486 | 488 | 115.3 |
| D | 1 | 52 | 1185943 | 10017.71 | 485 | 471 | 118.3 |
| D | 2 | 234 | 18489 | 152.26 | 485 | 471 | 118.3 |
| D | 12 | 33 | 10918 | 88.28 | 485 | 471 | 118.3 |
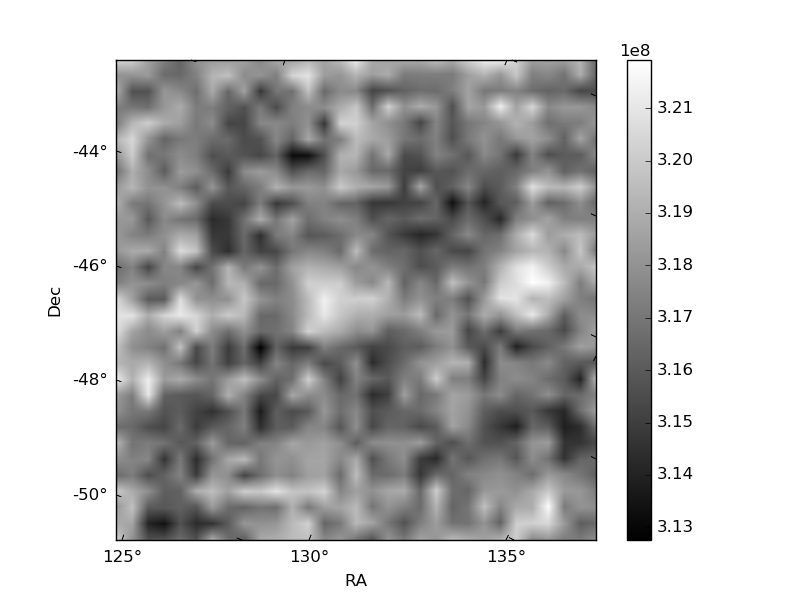
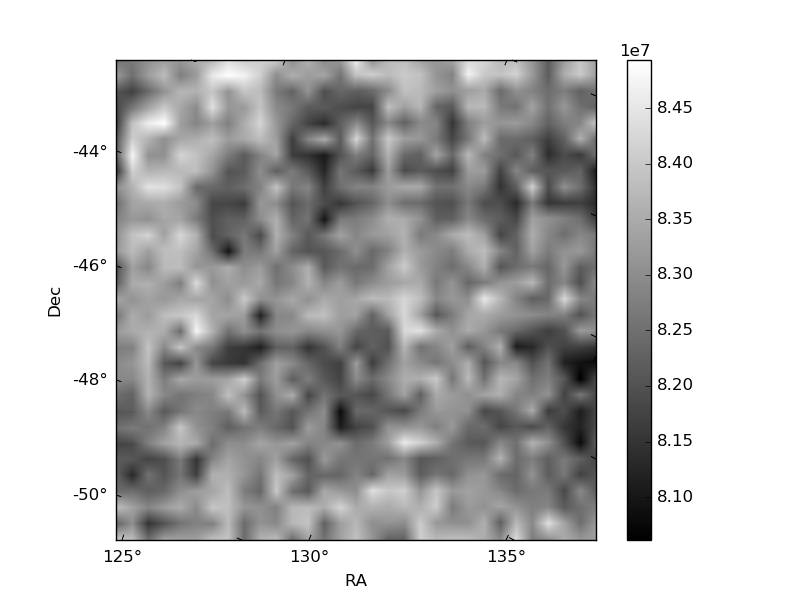
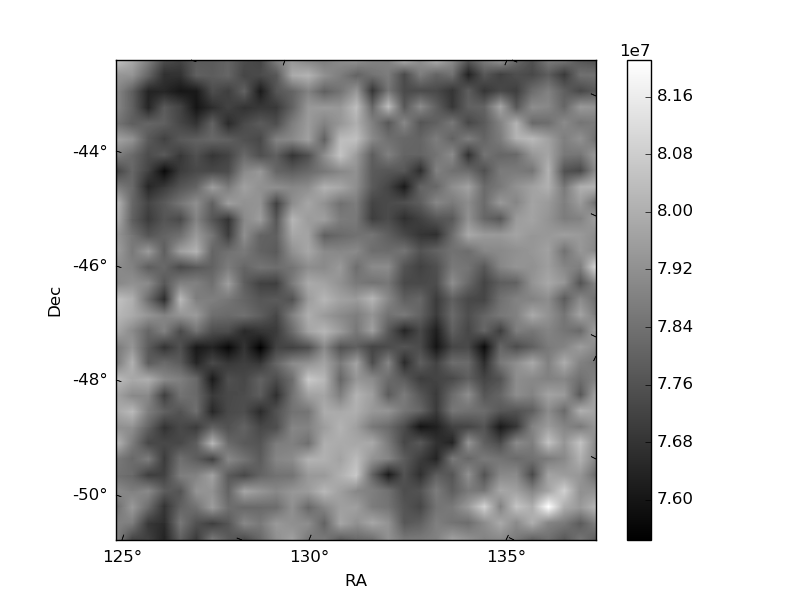
Histogram calculated using DETX and DETY for each event in the final _common_clean file
| Quadrant A | 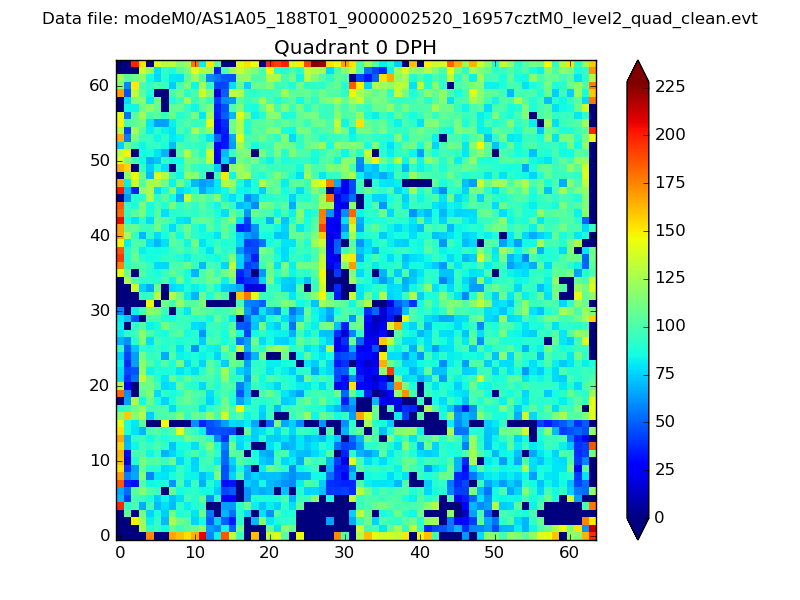 |
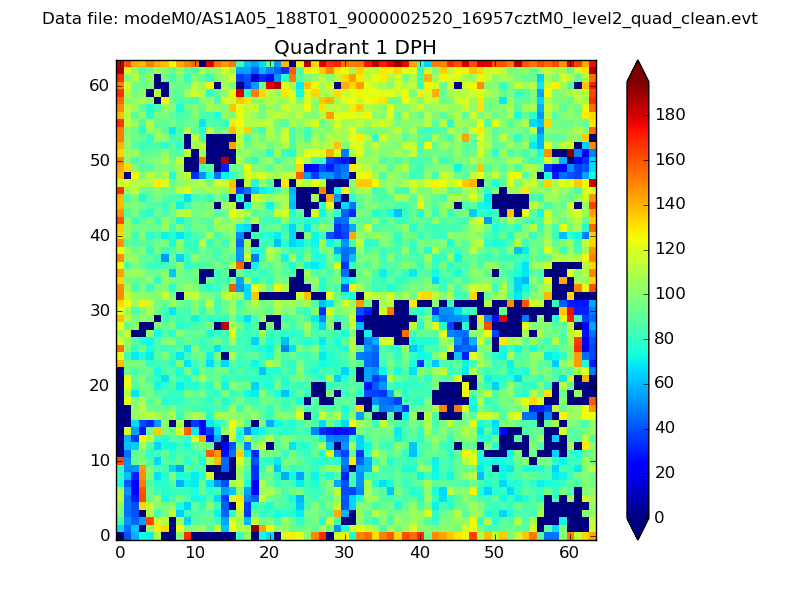 |
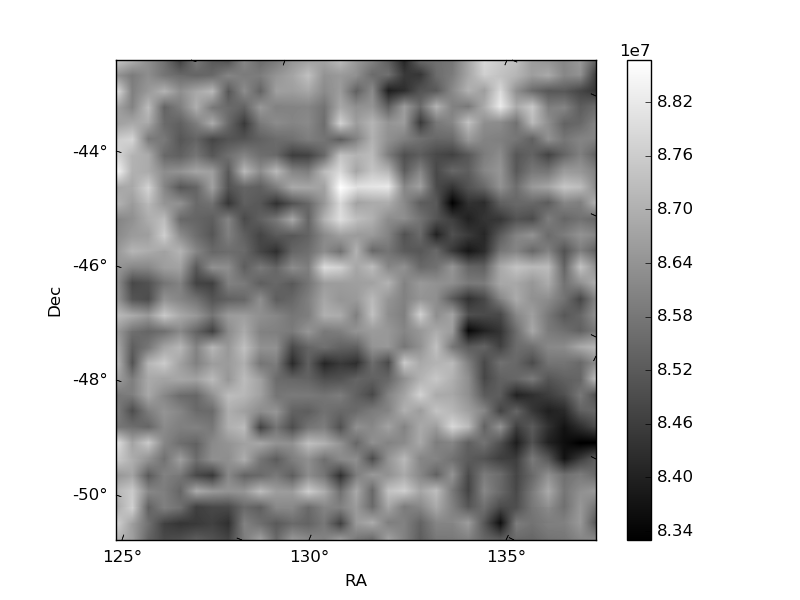
Quadrant B |
|---|---|---|---|
| Quadrant D | 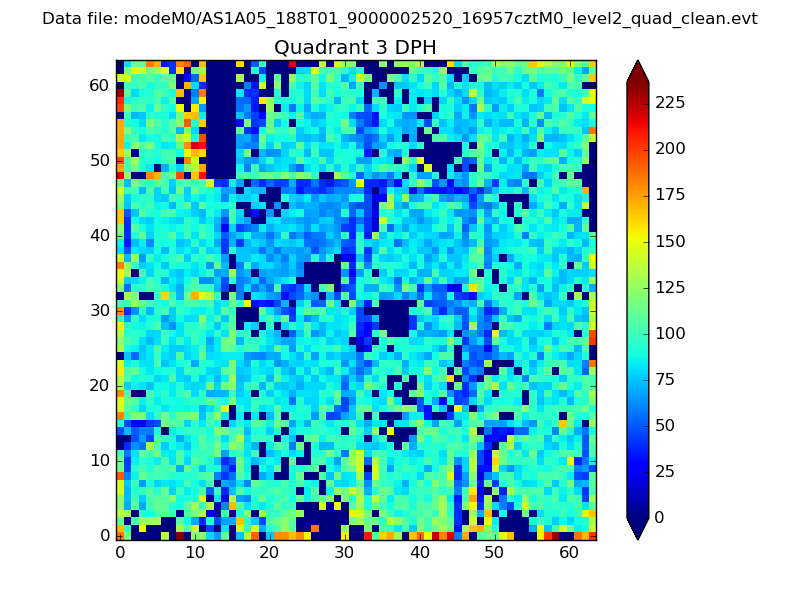 |
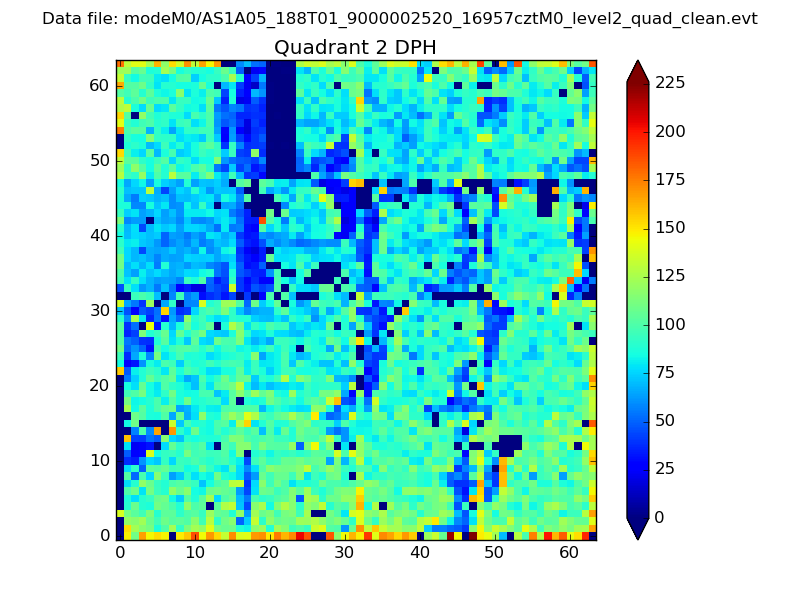 |
Quadrant C |
| Plot type | Count rate plots | Images |
|---|---|---|
| Comparison with Poisson distribution Blue bars denote a histogram of data divided into 1 sec bins. Red curve is a Poisson curve with rate = median count rate of data. |
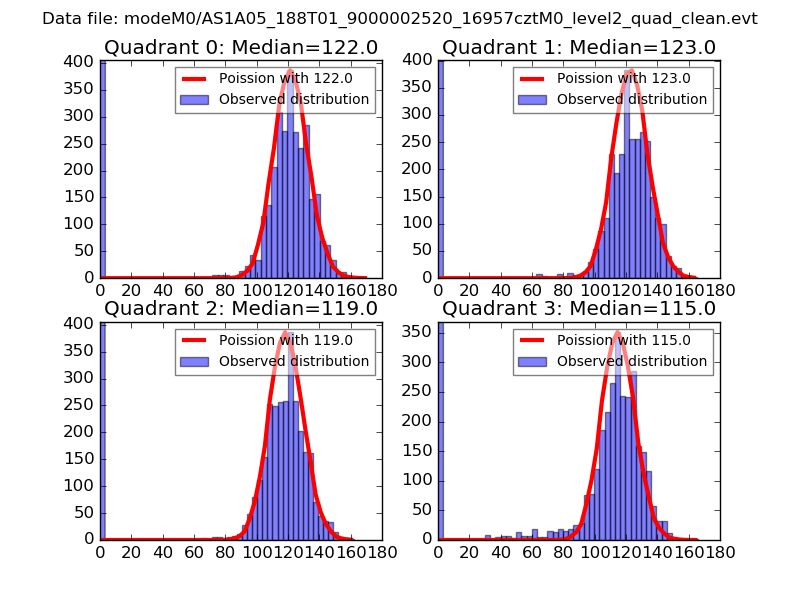 |
 |
| Quadrant-wise count rates Data is divided into 100 sec bins |
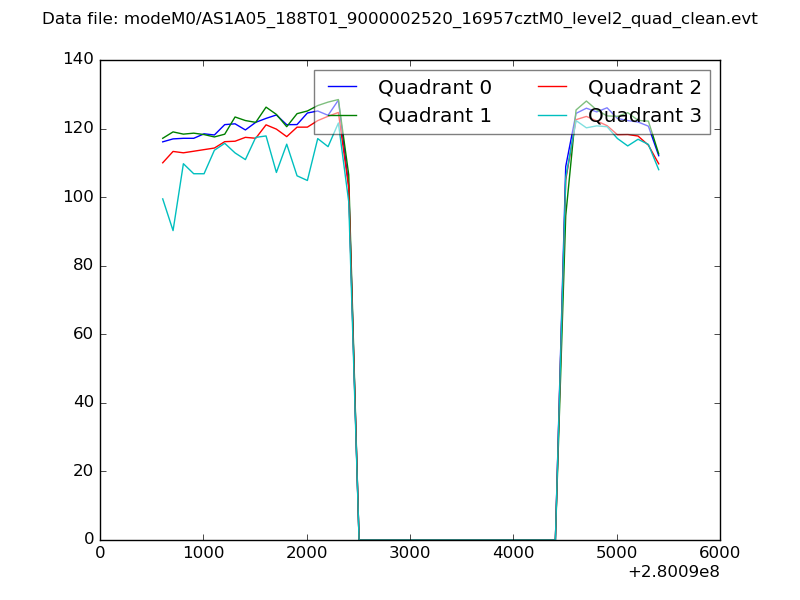 |
|
| Module-wise count rates for Quadrant A Data is divided into 100 sec bins |
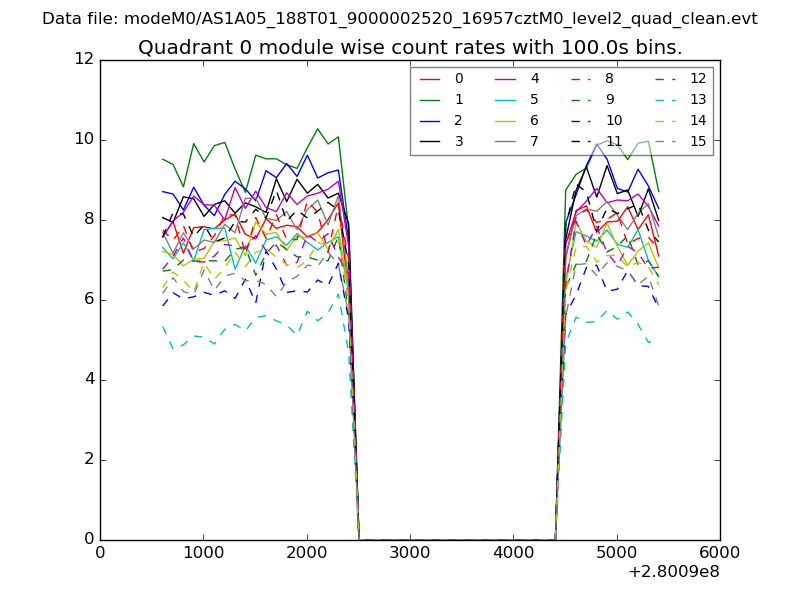 |
 |
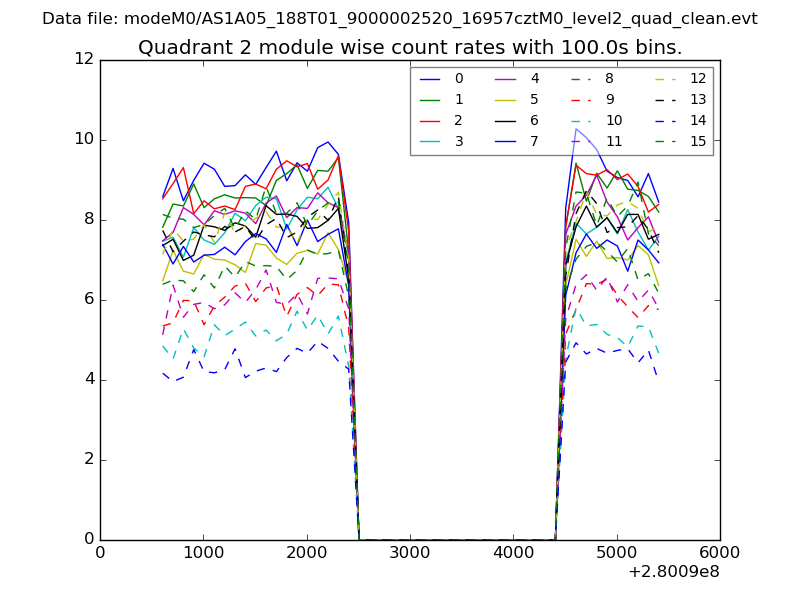
| Module-wise count rates for Quadrant B Data is divided into 100 sec bins |
 |
 |
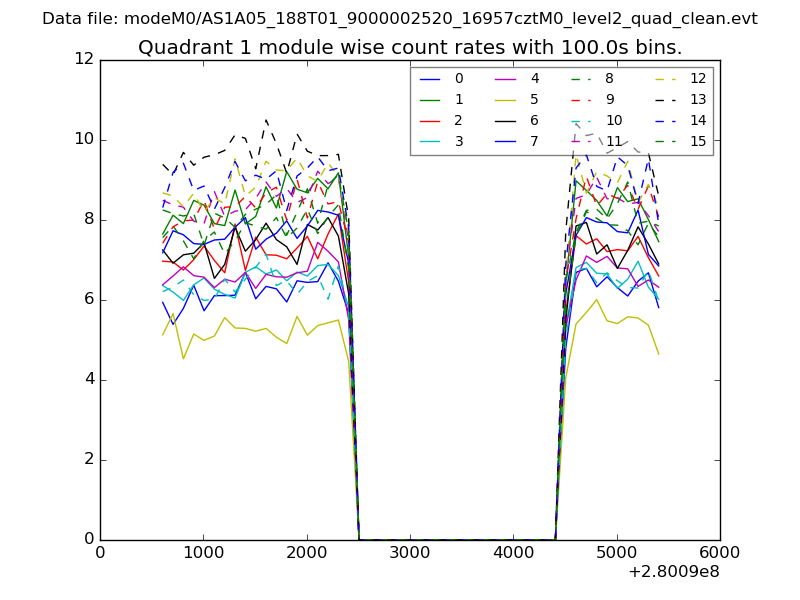
| Module-wise count rates for Quadrant C Data is divided into 100 sec bins |
 |
 |
| Module-wise count rates for Quadrant D Data is divided into 100 sec bins |
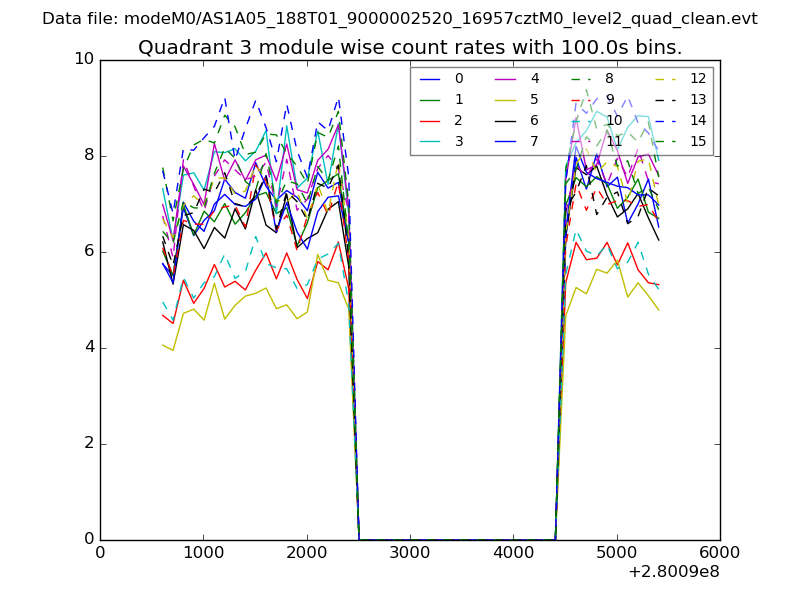 |
 |
| Parameter | Plot |
|---|---|
| CZT HV Monitor | 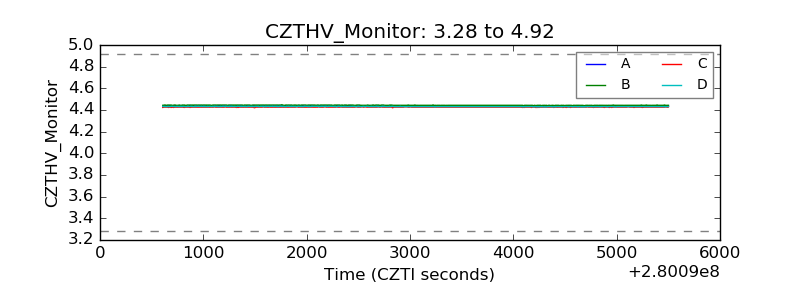 |
| D_VDD | 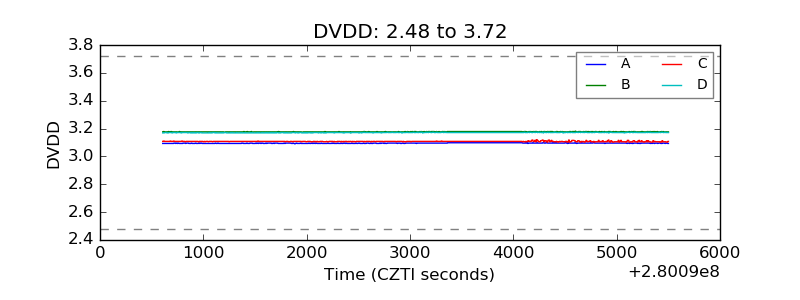 |
| Temperature 1 | 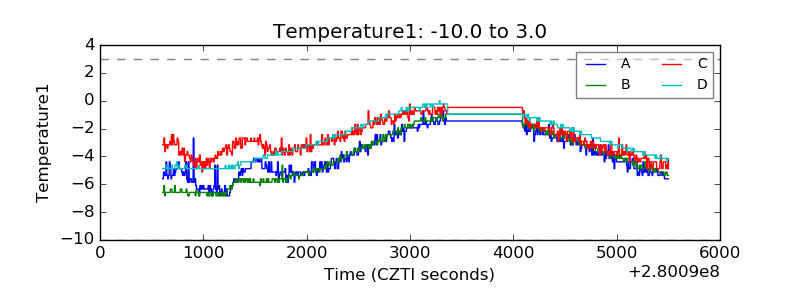 |
| Veto HV Monitor | 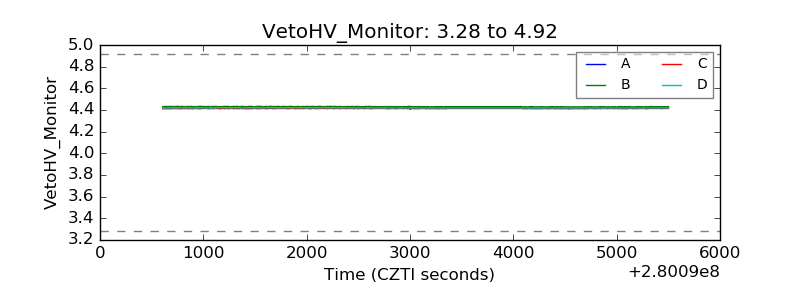 |
| Veto LLD | 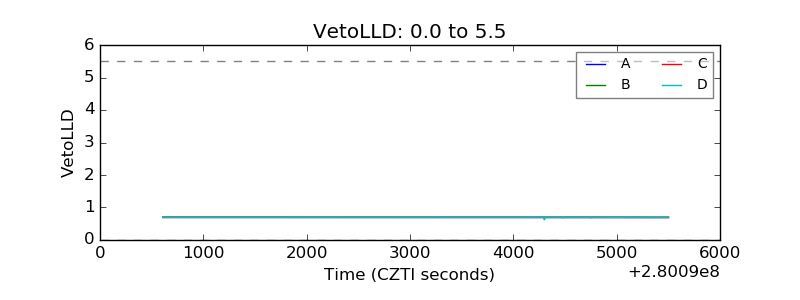 |
| Alpha Counter | 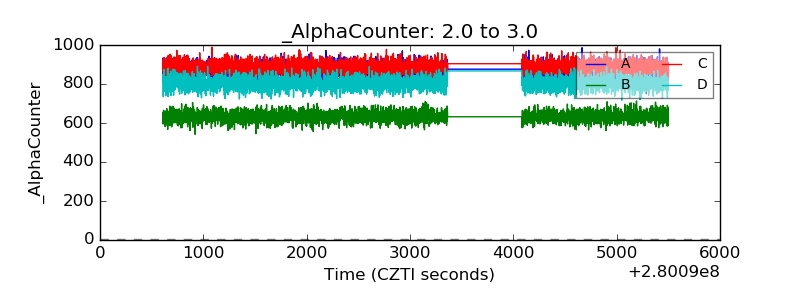 |
| _CPM_Rate | 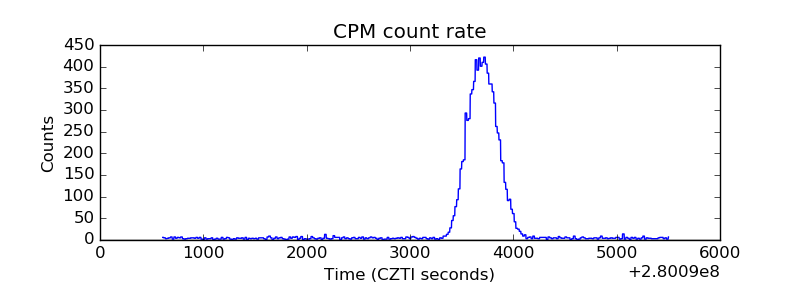 |
| CZT Counter | 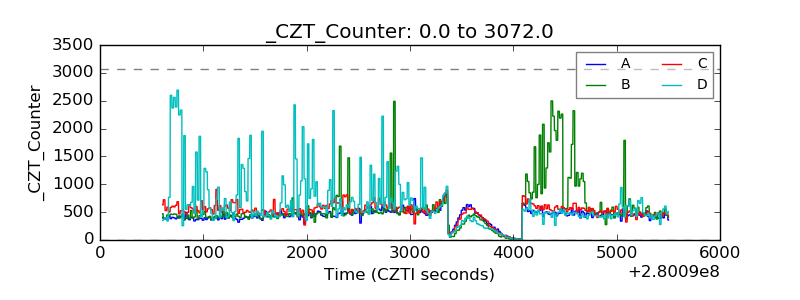 |
| +2.5 Volts monitor | 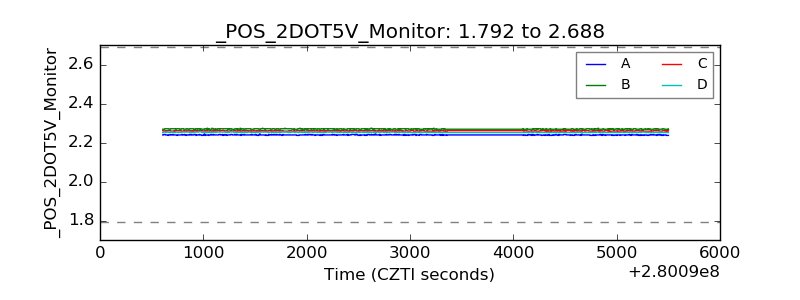 |
| +5 Volts monitor |  |
| _ROLL_ROT | 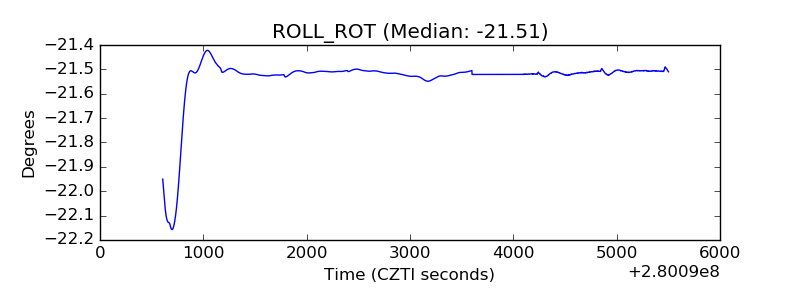 |
| _Roll_DEC | 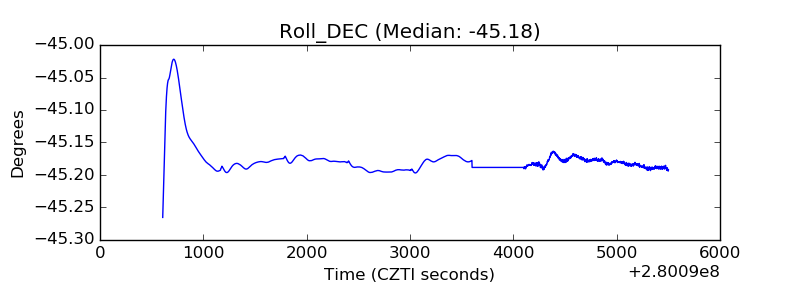 |
| _Roll_RA | 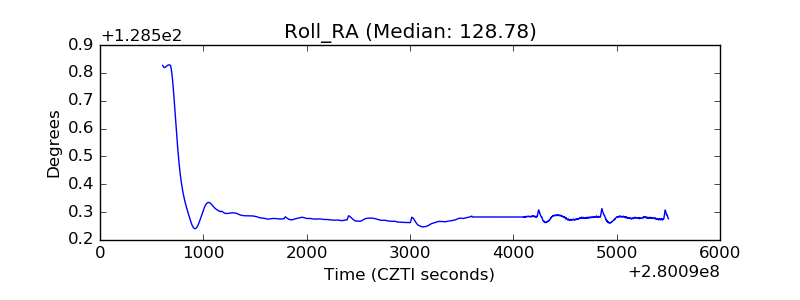 |
| Veto Counter | 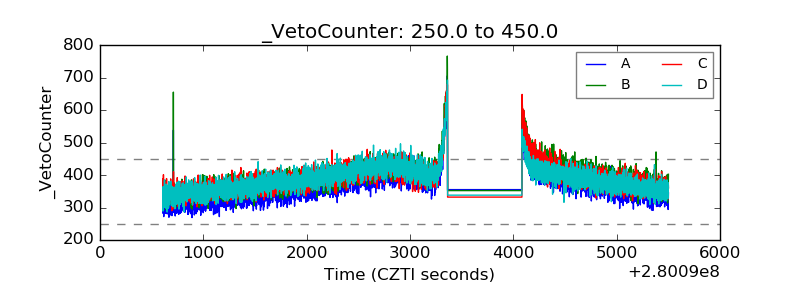 |