| Param | Original file | Final file |
|---|---|---|
| Filename | modeM0/AS1A05_188T01_9000002520_16958cztM0_level2.evt | modeM0/AS1A05_188T01_9000002520_16958cztM0_level2_quad_clean.evt |
| Size (bytes) | 468,921,600 | 97,862,400 |
| Size | 447.2 MB | 93.3 MB |
| Events in quadrant A | 3,068,653 | 632,376 |
| Events in quadrant B | 3,872,813 | 638,048 |
| Events in quadrant C | 3,462,449 | 614,671 |
| Events in quadrant D | 3,338,003 | 607,353 |
| Mode M9 | |||
|---|---|---|---|
| Quadrant | BADHDUFLAG | Total packets | Discarded packets |
| A | 0 | 11 | 0 |
| B | 0 | 12 | 0 |
| C | 0 | 12 | 0 |
| D | 0 | 12 | 0 |
| Mode M0 | |||
|---|---|---|---|
| Quadrant | BADHDUFLAG | Total packets | Discarded packets |
| A | 0 | 13703 | 2 |
| B | 0 | 15991 | 2 |
| C | 0 | 14378 | 2 |
| D | 0 | 14617 | 2 |
| Mode SS | |||
|---|---|---|---|
| Quadrant | BADHDUFLAG | Total packets | Discarded packets |
| A | 0 | 136 | 0 |
| B | 0 | 136 | 0 |
| C | 0 | 136 | 0 |
| D | 0 | 136 | 0 |
| Quadrant | Total seconds | Saturated seconds | Saturation percentage |
|---|---|---|---|
| A | 6760 | 20 | 0.295858% |
| B | 6760 | 263 | 3.890533% |
| C | 6760 | 52 | 0.769231% |
| D | 6760 | 26 | 0.384615% |
Noise dominated data is calculated using 1-second bins in cleaned event files. If a bin has >2000 counts, and if more than 50% of those come from <1% of pixels, then it is considered to be noise-dominated and hence unusable.
| Quadrant | # 1 sec bins | Bins with >0 counts | Bins with >2000 counts | High rate bins dominated by noise | Noise dominated (total time) | Noise dominated (detector-on time) | Marked lightcurve |
|---|---|---|---|---|---|---|---|
| A | 7676 | 6762 | 0 | 0 | 0.00% | 0.00% | 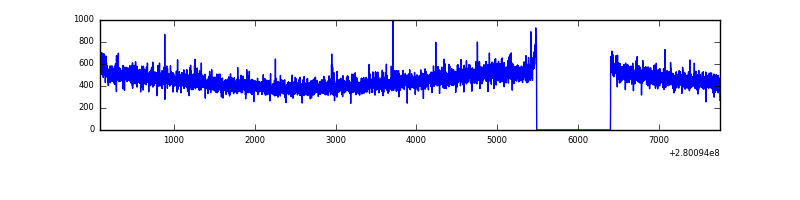 |
| B | 7676 | 6762 | 118 | 118 | 1.54% | 1.75% | 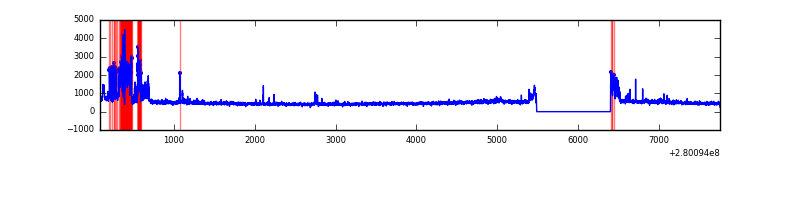 |
| C | 7676 | 6762 | 0 | 0 | 0.00% | 0.00% | 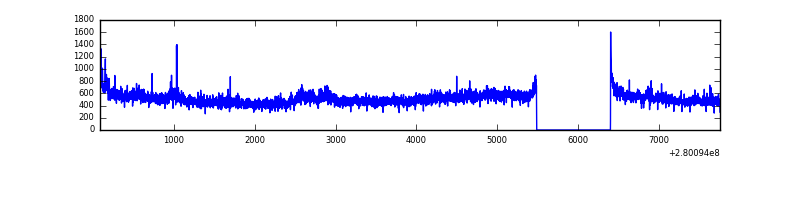 |
| D | 7676 | 6762 | 7 | 7 | 0.09% | 0.10% | 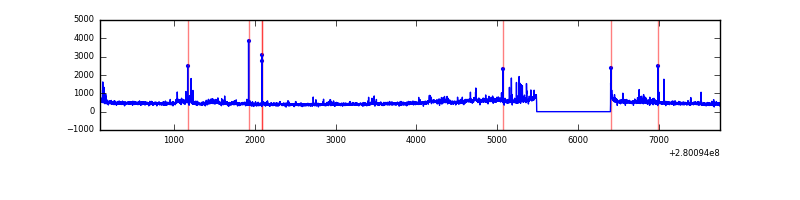 |
Top three noisy pixels from each quadrant. If the there are fewer than three noisy pixels in the level2.evt file, extra rows are filled as -1
| Pixel properties | Quadrant properties | ||||||
|---|---|---|---|---|---|---|---|
| Quadrant | DetID | PixID | Counts | Sigma | Mean | Median | Sigma |
| A | 12 | 189 | 7497 | 41.52 | 796 | 778 | 161.8 |
| A | 0 | 226 | 7010 | 38.51 | 796 | 778 | 161.8 |
| A | 12 | 194 | 5817 | 31.14 | 796 | 778 | 161.8 |
| B | 3 | 64 | 424525 | 2780.32 | 795 | 775 | 152.4 |
| B | 15 | 35 | 233877 | 1529.43 | 795 | 775 | 152.4 |
| B | 3 | 209 | 22856 | 144.88 | 795 | 775 | 152.4 |
| C | 3 | 233 | 342940 | 1899.16 | 767 | 772 | 180.2 |
| C | 14 | 238 | 118626 | 654.13 | 767 | 772 | 180.2 |
| C | 13 | 61 | 5348 | 25.4 | 767 | 772 | 180.2 |
| D | 1 | 52 | 309045 | 1634.2 | 773 | 749 | 188.7 |
| D | 15 | 0 | 35070 | 181.93 | 773 | 749 | 188.7 |
| D | 2 | 234 | 29864 | 154.33 | 773 | 749 | 188.7 |
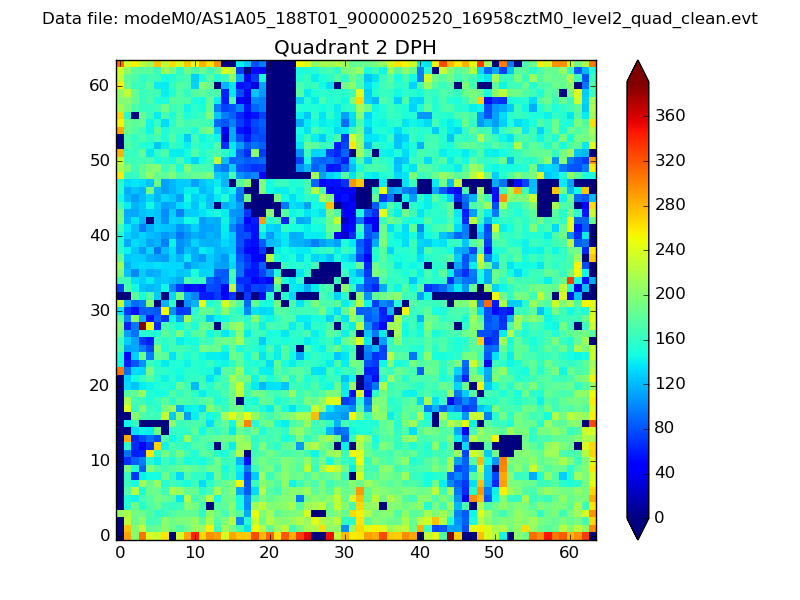
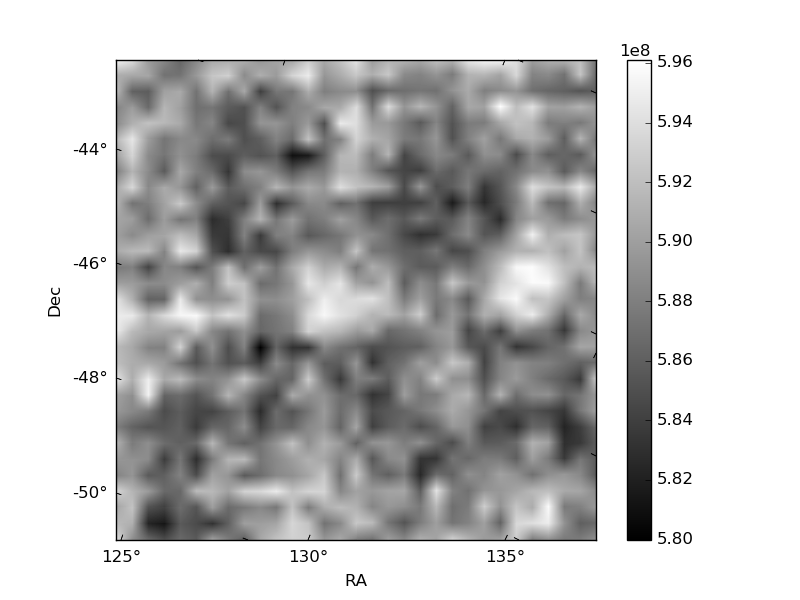
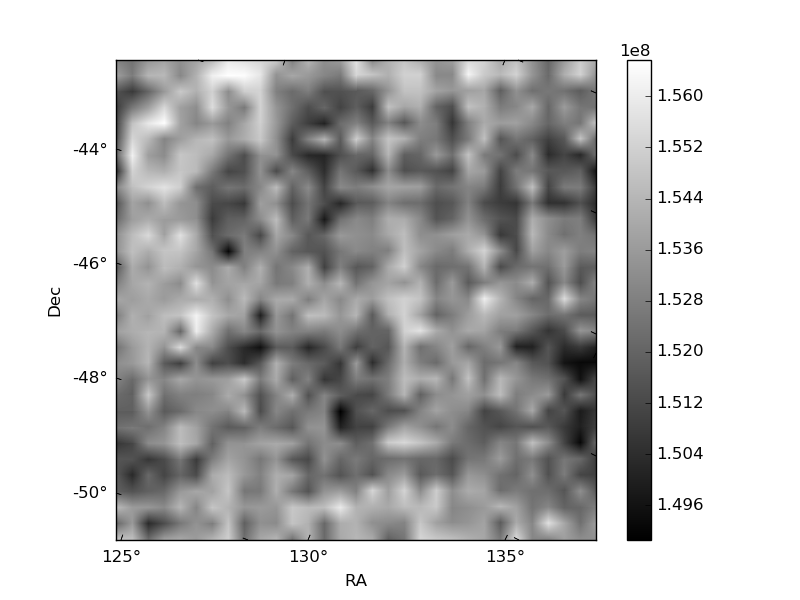
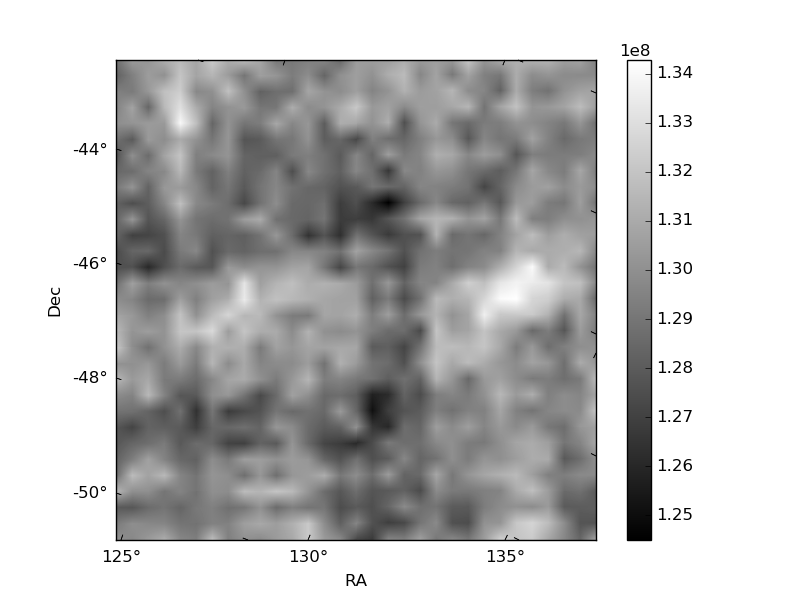
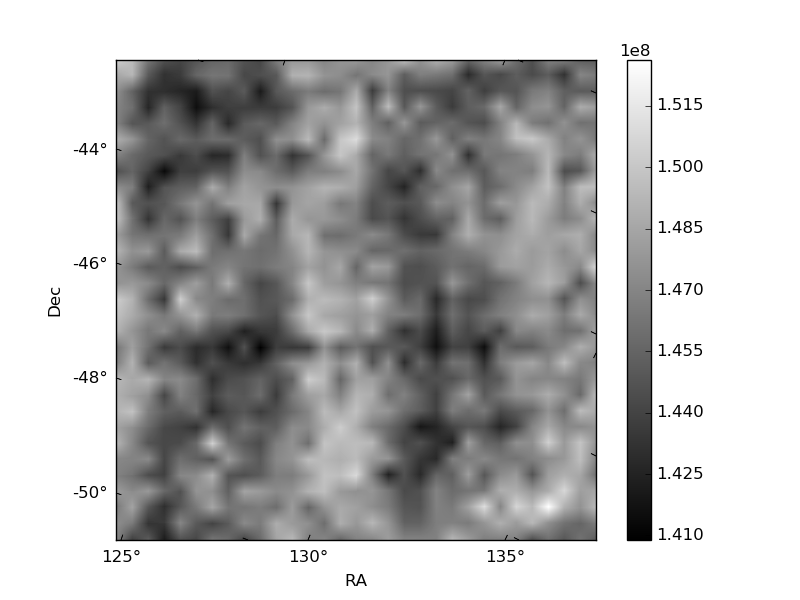
Histogram calculated using DETX and DETY for each event in the final _common_clean file
| Quadrant A | 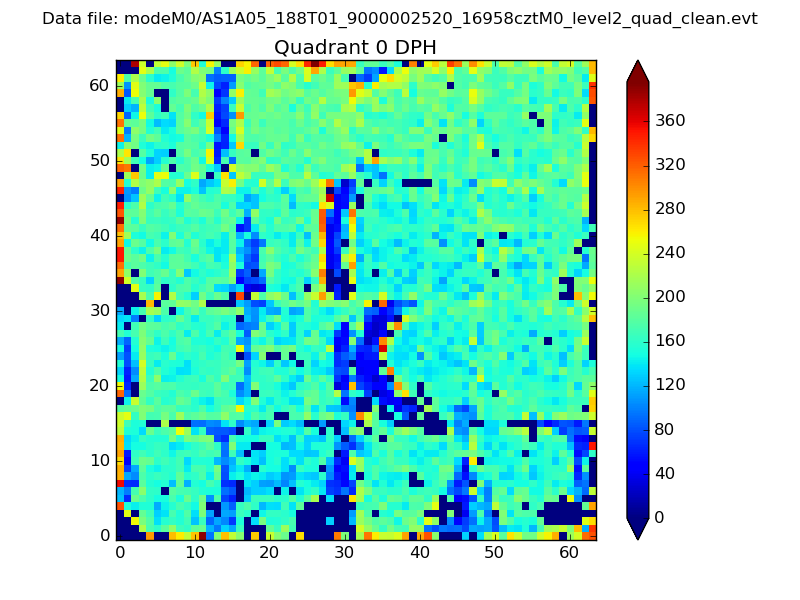 |
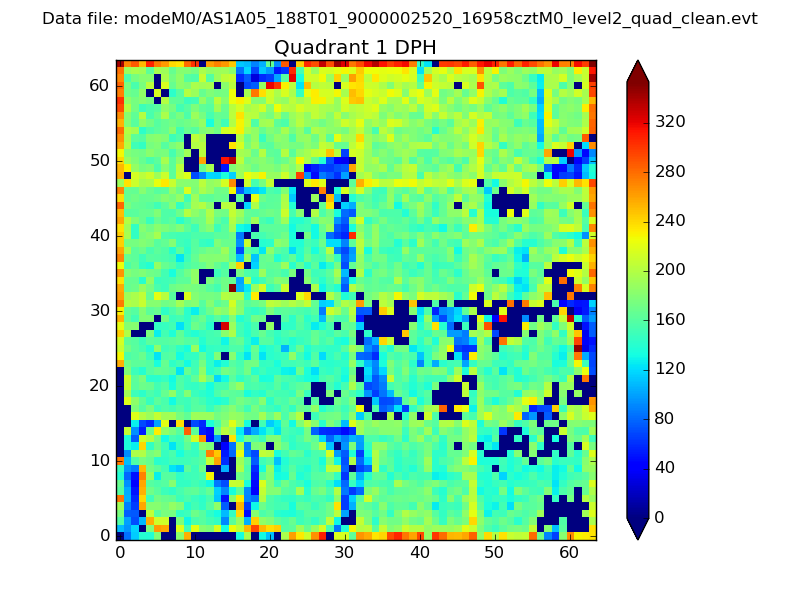 |
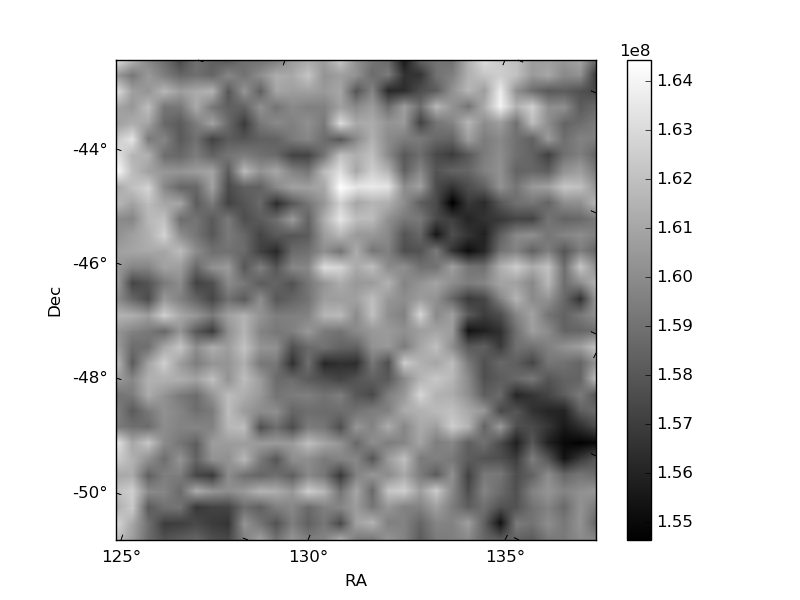
Quadrant B |
|---|---|---|---|
| Quadrant D | 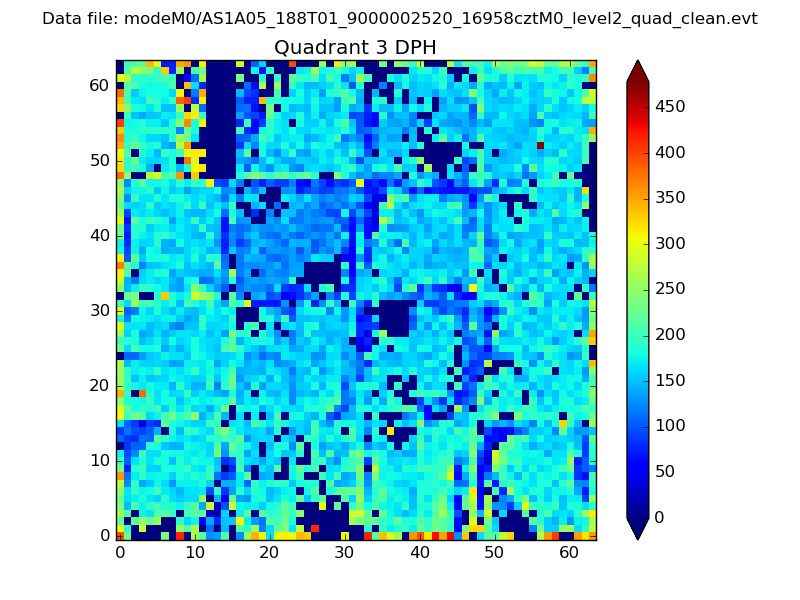 |
 |
Quadrant C |
| Plot type | Count rate plots | Images |
|---|---|---|
| Comparison with Poisson distribution Blue bars denote a histogram of data divided into 1 sec bins. Red curve is a Poisson curve with rate = median count rate of data. |
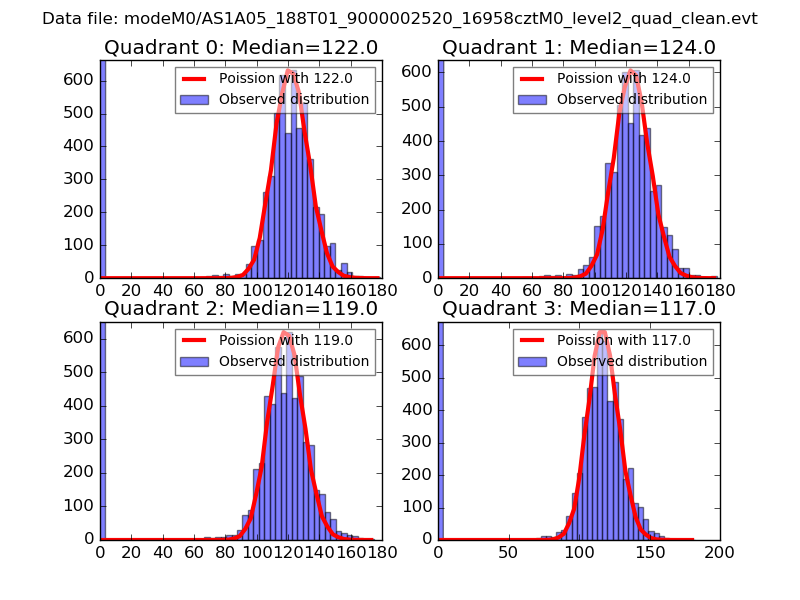 |
 |
| Quadrant-wise count rates Data is divided into 100 sec bins |
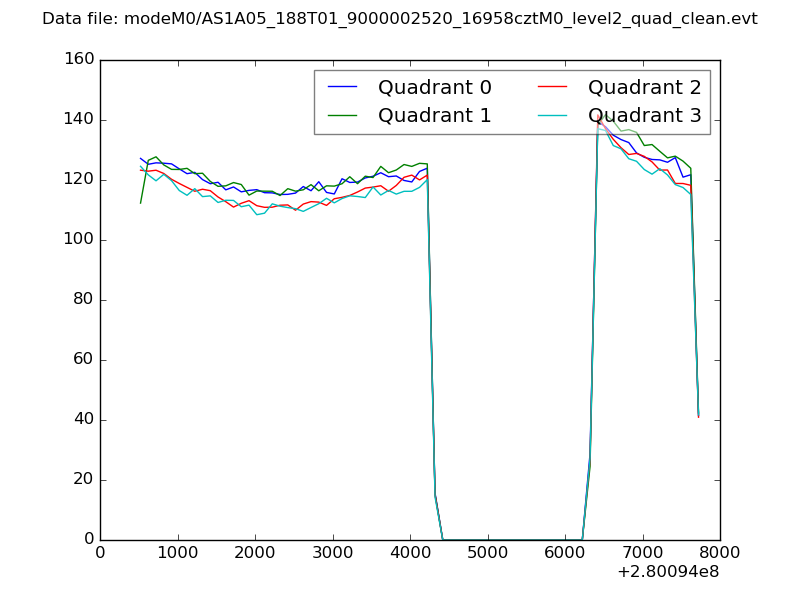 |
|
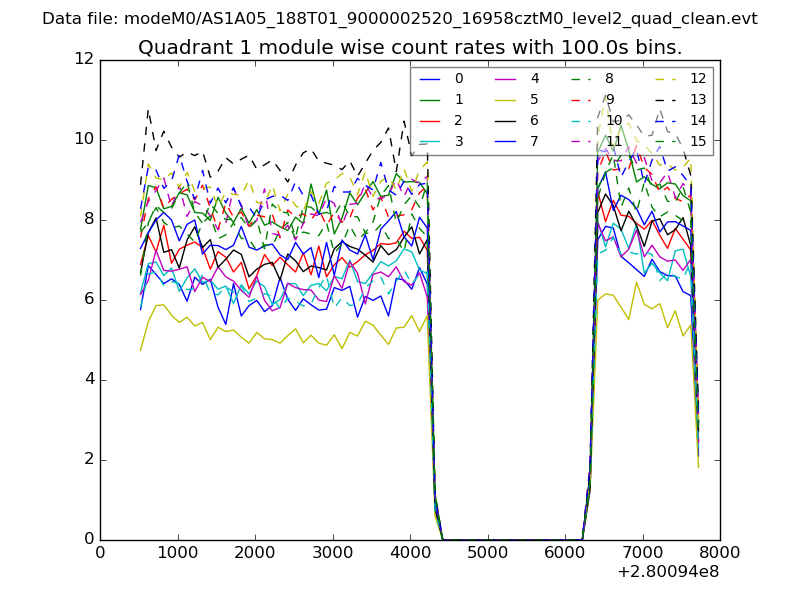
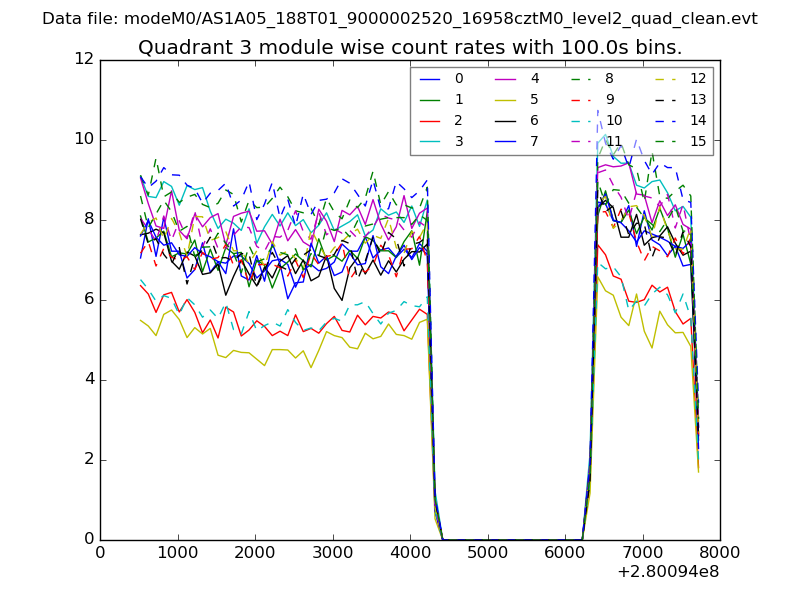
| Module-wise count rates for Quadrant A Data is divided into 100 sec bins |
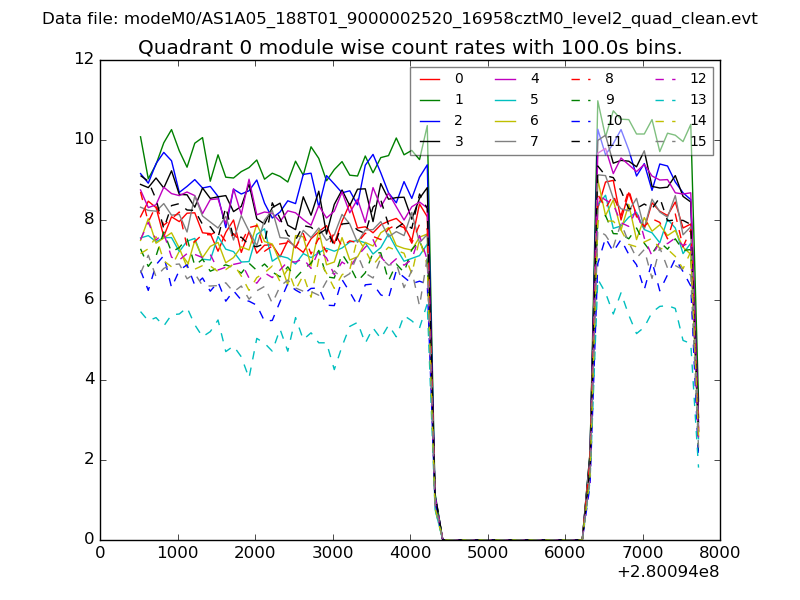 |
 |
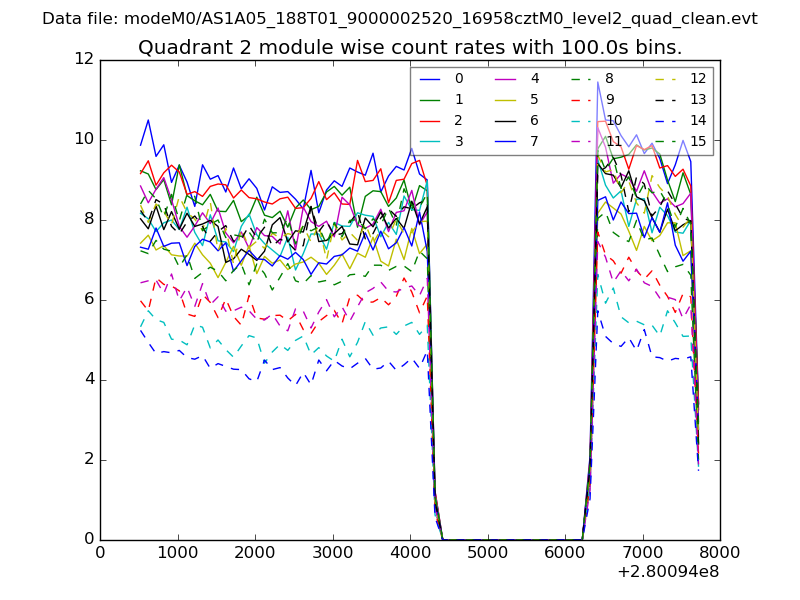
| Module-wise count rates for Quadrant B Data is divided into 100 sec bins |
 |
 |
| Module-wise count rates for Quadrant C Data is divided into 100 sec bins |
 |
 |
| Module-wise count rates for Quadrant D Data is divided into 100 sec bins |
 |
 |
| Parameter | Plot |
|---|---|
| CZT HV Monitor | 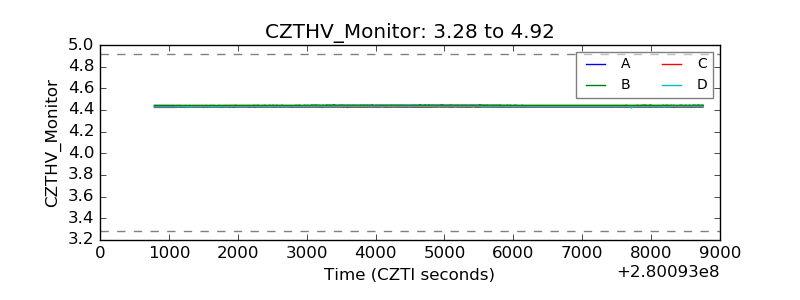 |
| D_VDD | 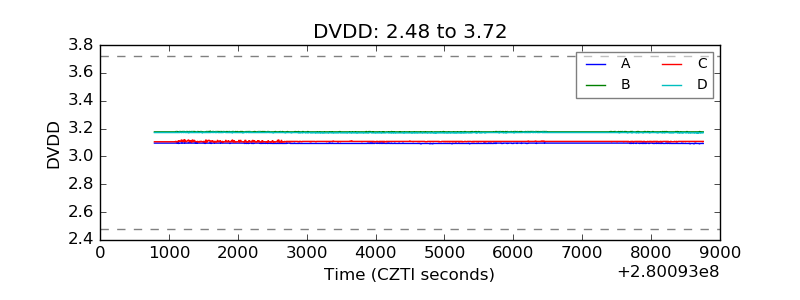 |
| Temperature 1 | 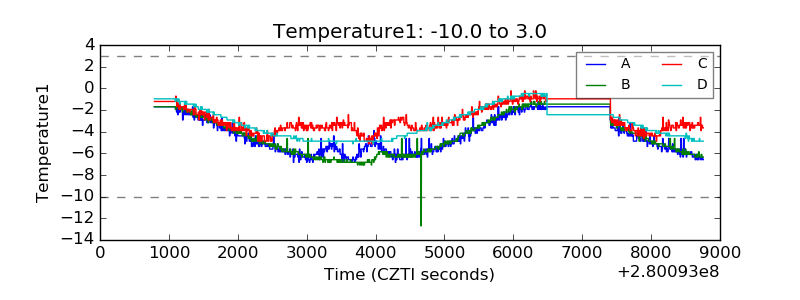 |
| Veto HV Monitor | 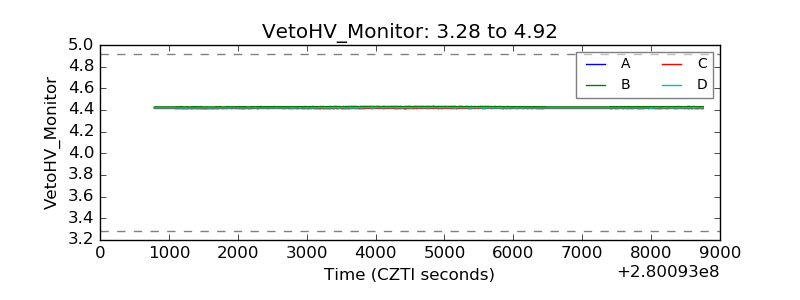 |
| Veto LLD | 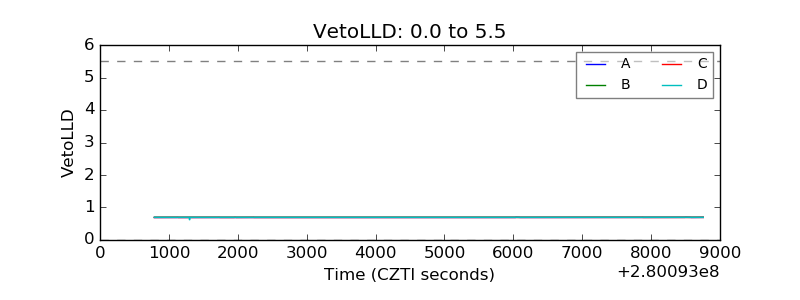 |
| Alpha Counter | 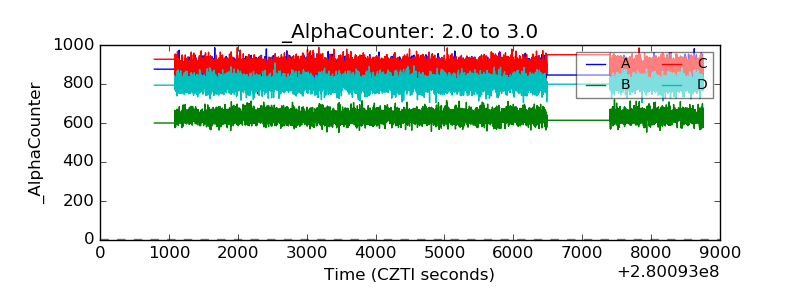 |
| _CPM_Rate | 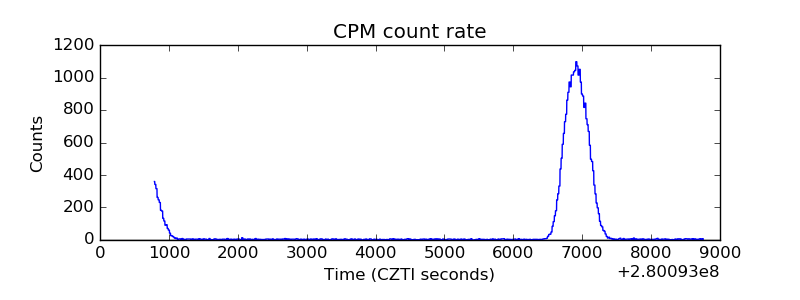 |
| CZT Counter | 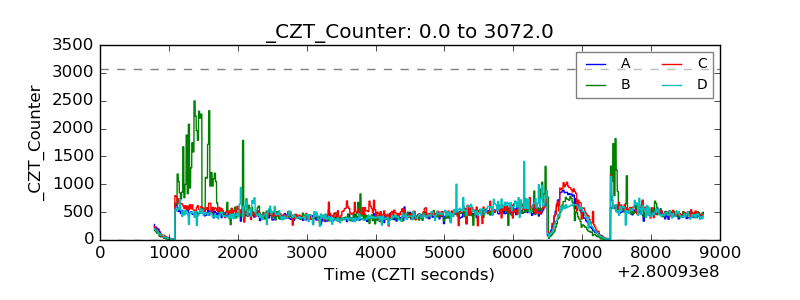 |
| +2.5 Volts monitor | 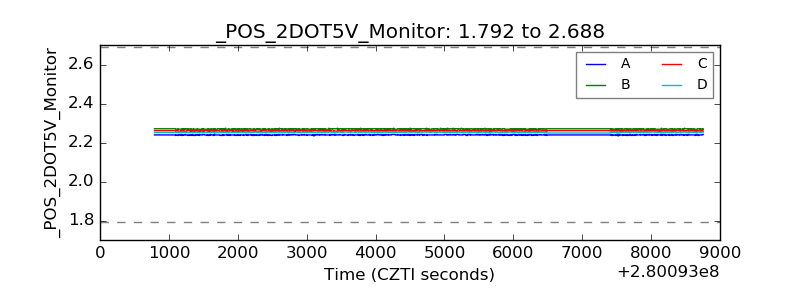 |
| +5 Volts monitor | 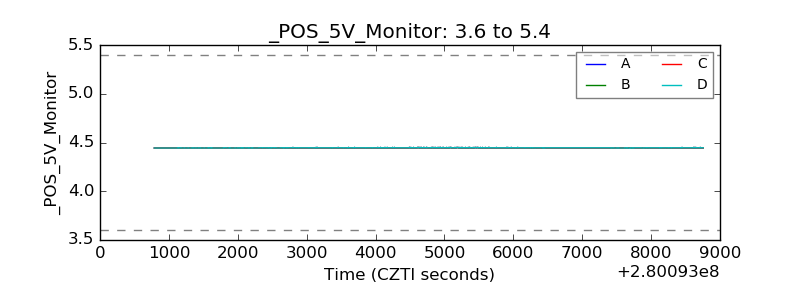 |
| _ROLL_ROT | 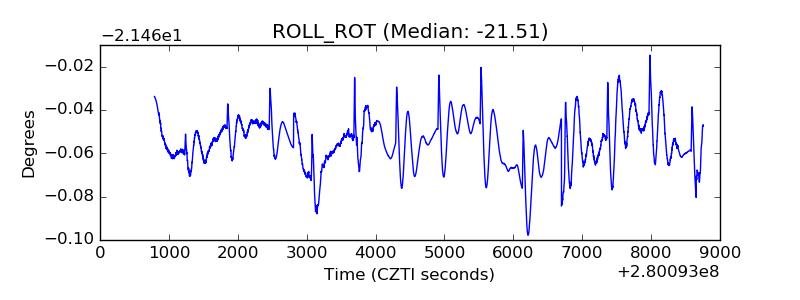 |
| _Roll_DEC |  |
| _Roll_RA | 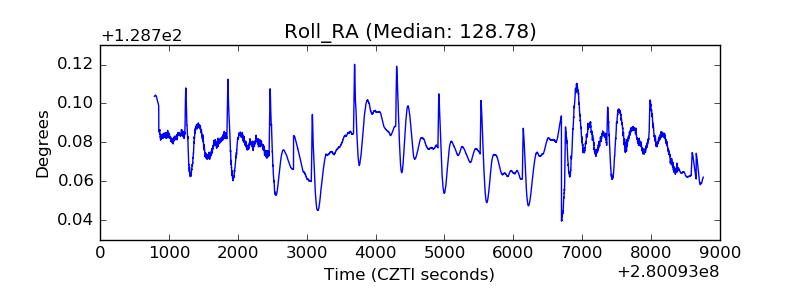 |
| Veto Counter | 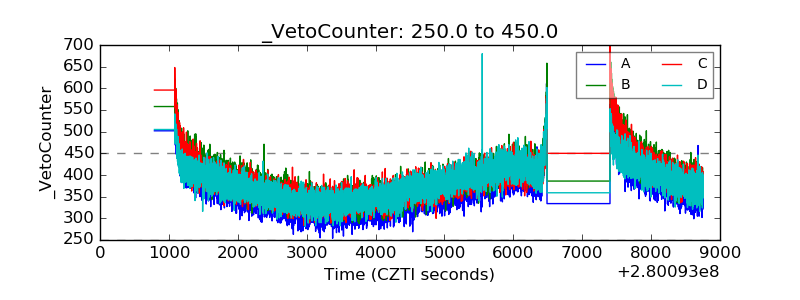 |