| Param | Original file | Final file |
|---|---|---|
| Filename | modeM0/AS1A05_188T01_9000002520_16961cztM0_level2.evt | modeM0/AS1A05_188T01_9000002520_16961cztM0_level2_quad_clean.evt |
| Size (bytes) | 498,286,080 | 104,808,960 |
| Size | 475.2 MB | 100.0 MB |
| Events in quadrant A | 3,316,799 | 672,116 |
| Events in quadrant B | 3,559,941 | 697,525 |
| Events in quadrant C | 3,518,821 | 670,295 |
| Events in quadrant D | 4,223,132 | 650,160 |
| Mode M9 | |||
|---|---|---|---|
| Quadrant | BADHDUFLAG | Total packets | Discarded packets |
| A | 0 | 22 | 0 |
| B | 0 | 22 | 0 |
| C | 0 | 22 | 0 |
| D | 0 | 22 | 0 |
| Mode M0 | |||
|---|---|---|---|
| Quadrant | BADHDUFLAG | Total packets | Discarded packets |
| A | 0 | 14398 | 2 |
| B | 0 | 15097 | 2 |
| C | 0 | 14705 | 2 |
| D | 0 | 17300 | 2 |
| Mode SS | |||
|---|---|---|---|
| Quadrant | BADHDUFLAG | Total packets | Discarded packets |
| A | 0 | 144 | 0 |
| B | 0 | 144 | 0 |
| C | 0 | 144 | 0 |
| D | 0 | 144 | 0 |
| Quadrant | Total seconds | Saturated seconds | Saturation percentage |
|---|---|---|---|
| A | 6946 | 43 | 0.619061% |
| B | 6947 | 78 | 1.122787% |
| C | 6947 | 76 | 1.093997% |
| D | 6947 | 447 | 6.434432% |
Noise dominated data is calculated using 1-second bins in cleaned event files. If a bin has >2000 counts, and if more than 50% of those come from <1% of pixels, then it is considered to be noise-dominated and hence unusable.
| Quadrant | # 1 sec bins | Bins with >0 counts | Bins with >2000 counts | High rate bins dominated by noise | Noise dominated (total time) | Noise dominated (detector-on time) | Marked lightcurve |
|---|---|---|---|---|---|---|---|
| A | 9152 | 6949 | 3 | 3 | 0.03% | 0.04% | 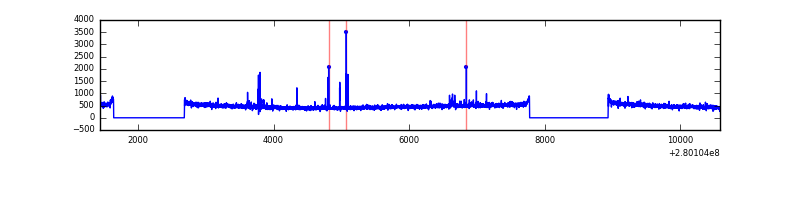 |
| B | 9153 | 6950 | 4 | 4 | 0.04% | 0.06% | 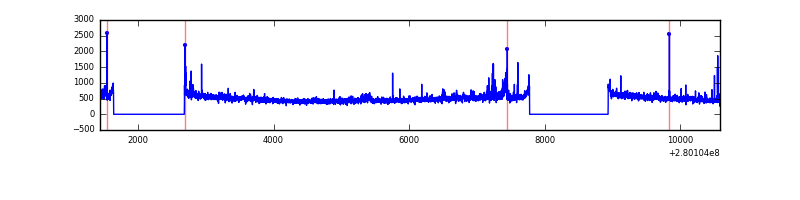 |
| C | 9153 | 6950 | 0 | 0 | 0.00% | 0.00% | 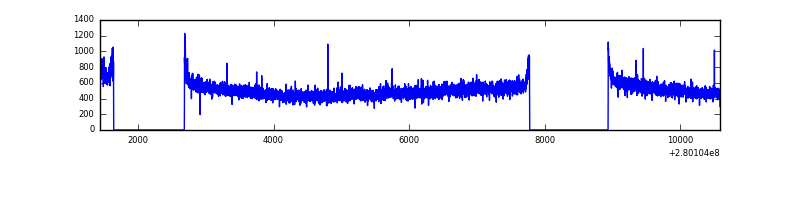 |
| D | 9153 | 6950 | 402 | 402 | 4.39% | 5.78% | 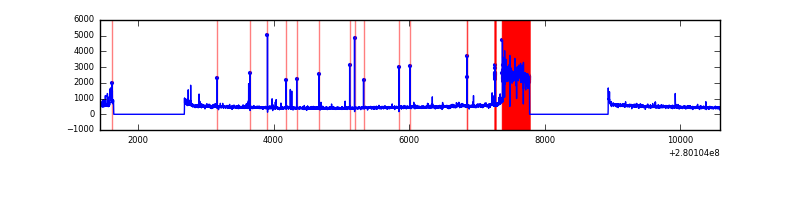 |
Top three noisy pixels from each quadrant. If the there are fewer than three noisy pixels in the level2.evt file, extra rows are filled as -1
| Pixel properties | Quadrant properties | ||||||
|---|---|---|---|---|---|---|---|
| Quadrant | DetID | PixID | Counts | Sigma | Mean | Median | Sigma |
| A | 9 | 143 | 45082 | 260.09 | 846 | 827 | 170.2 |
| A | 12 | 189 | 18745 | 105.31 | 846 | 827 | 170.2 |
| A | 0 | 226 | 7397 | 38.61 | 846 | 827 | 170.2 |
| B | 15 | 35 | 60399 | 363.93 | 861 | 840 | 163.7 |
| B | 0 | 197 | 30626 | 182.0 | 861 | 840 | 163.7 |
| B | 4 | 216 | 30243 | 179.66 | 861 | 840 | 163.7 |
| C | 3 | 233 | 137237 | 698.24 | 834 | 841 | 195.3 |
| C | 14 | 238 | 128688 | 654.48 | 834 | 841 | 195.3 |
| C | 13 | 61 | 5869 | 25.74 | 834 | 841 | 195.3 |
| D | 15 | 0 | 897192 | 4595.38 | 802 | 781 | 195.1 |
| D | 1 | 52 | 149674 | 763.29 | 802 | 781 | 195.1 |
| D | 7 | 38 | 60313 | 305.19 | 802 | 781 | 195.1 |
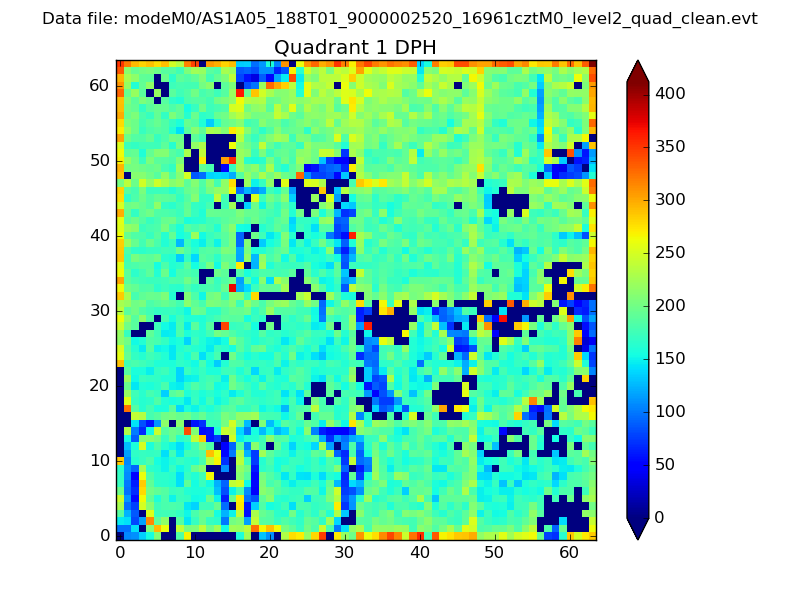
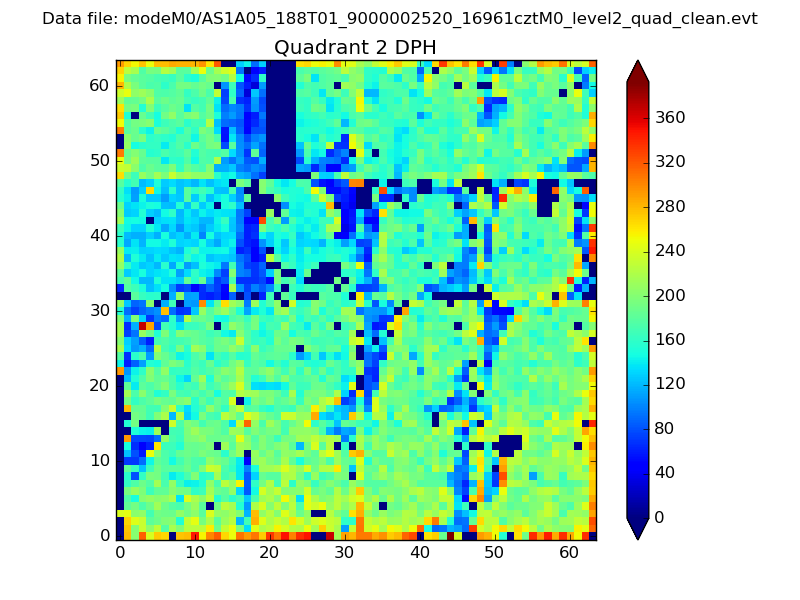
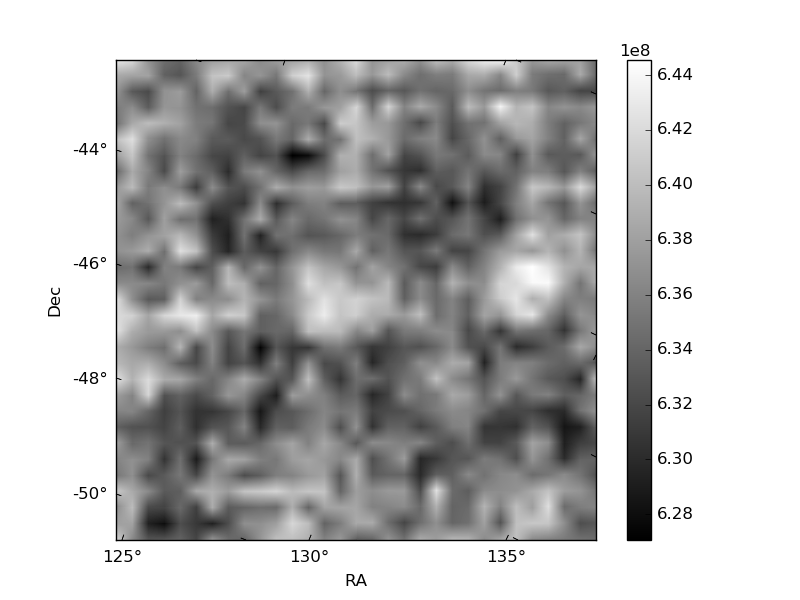
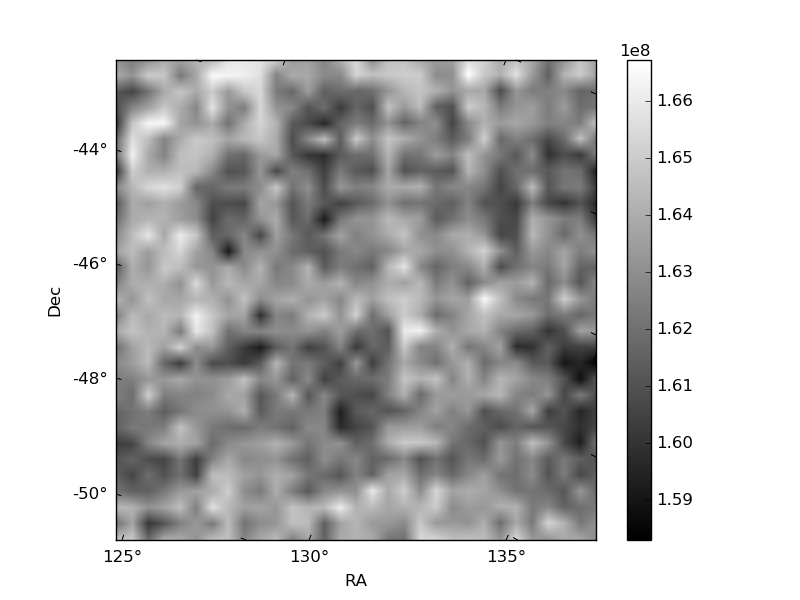
Histogram calculated using DETX and DETY for each event in the final _common_clean file
| Quadrant A |  |
 |
Quadrant B |
|---|---|---|---|
| Quadrant D | 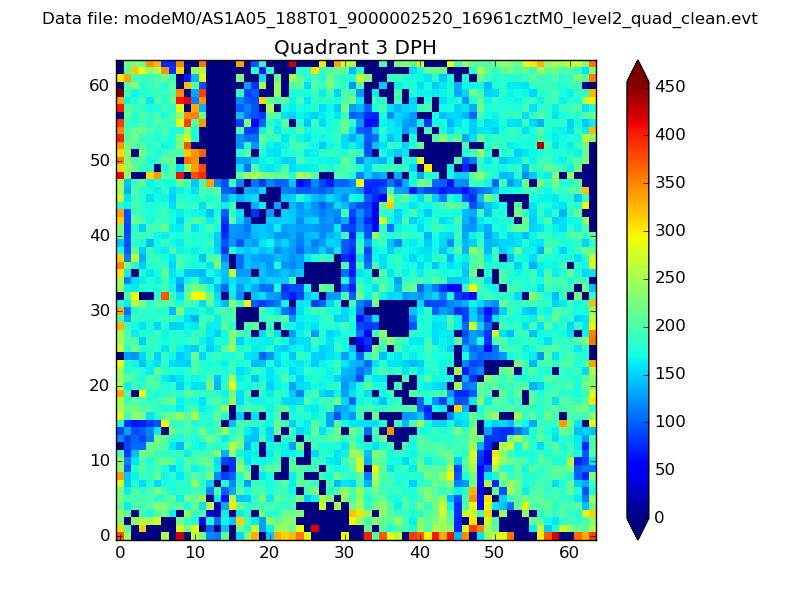 |
 |
Quadrant C |
| Plot type | Count rate plots | Images |
|---|---|---|
| Comparison with Poisson distribution Blue bars denote a histogram of data divided into 1 sec bins. Red curve is a Poisson curve with rate = median count rate of data. |
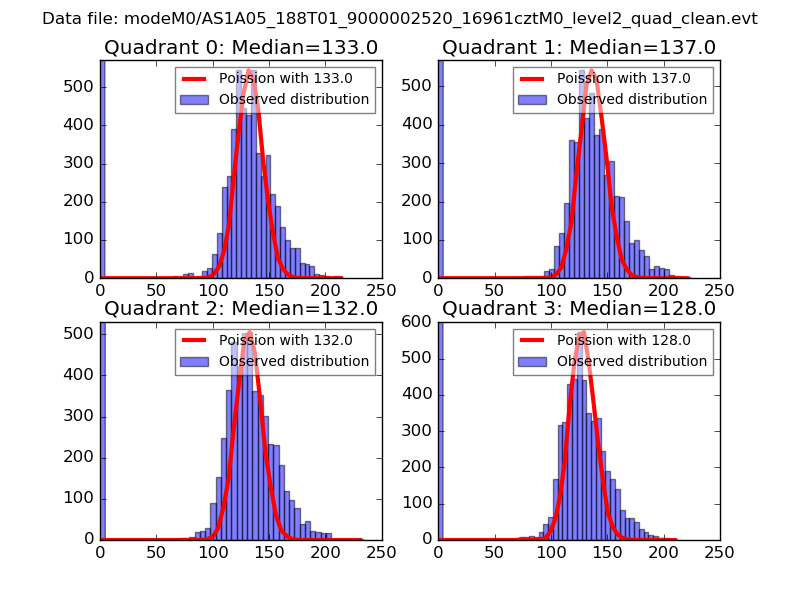 |
 |
| Quadrant-wise count rates Data is divided into 100 sec bins |
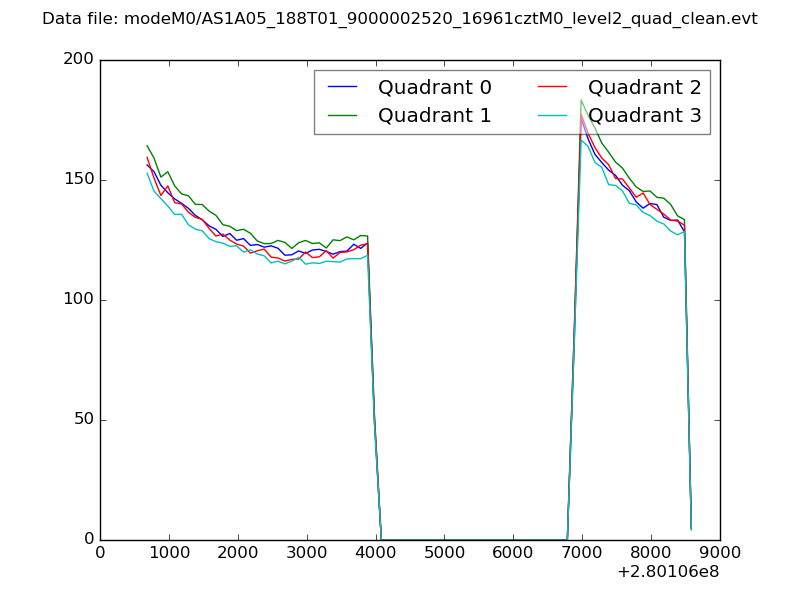 |
|
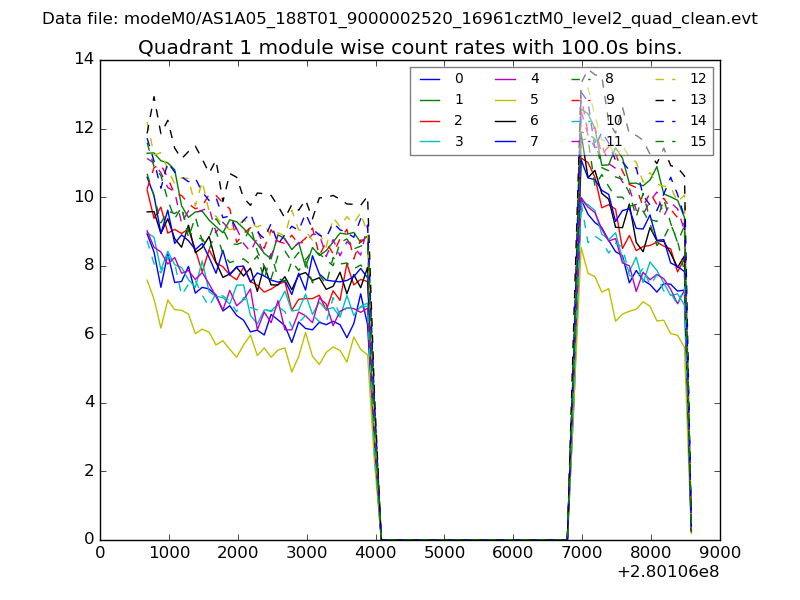
| Module-wise count rates for Quadrant A Data is divided into 100 sec bins |
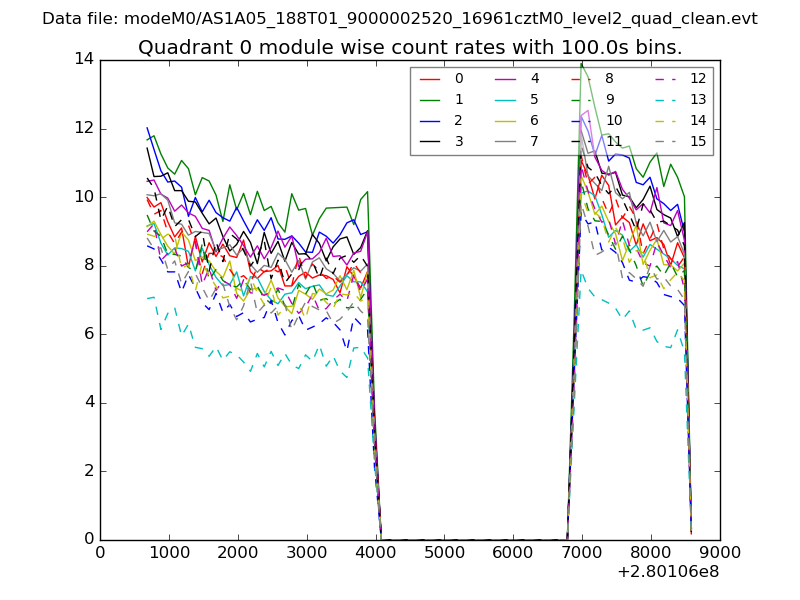 |
 |
| Module-wise count rates for Quadrant B Data is divided into 100 sec bins |
 |
 |
| Module-wise count rates for Quadrant C Data is divided into 100 sec bins |
 |
 |
| Module-wise count rates for Quadrant D Data is divided into 100 sec bins |
 |
 |
| Parameter | Plot |
|---|---|
| CZT HV Monitor | 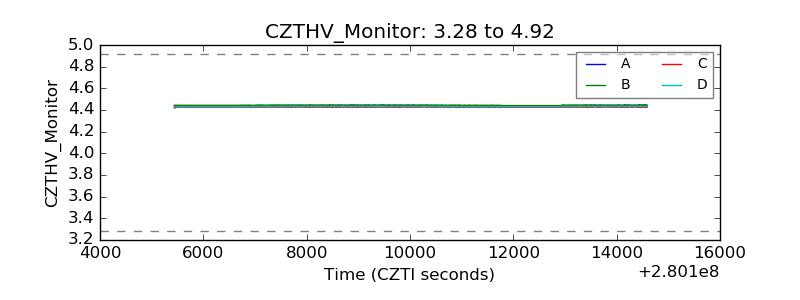 |
| D_VDD | 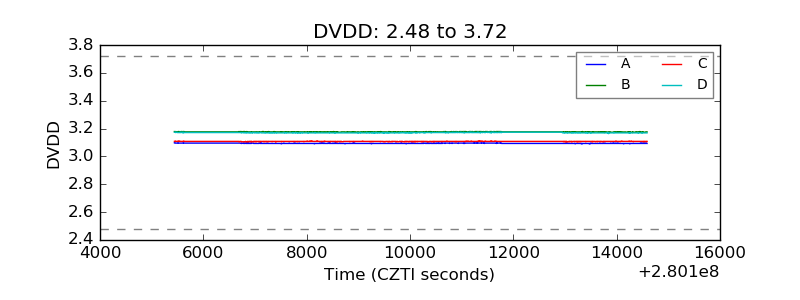 |
| Temperature 1 | 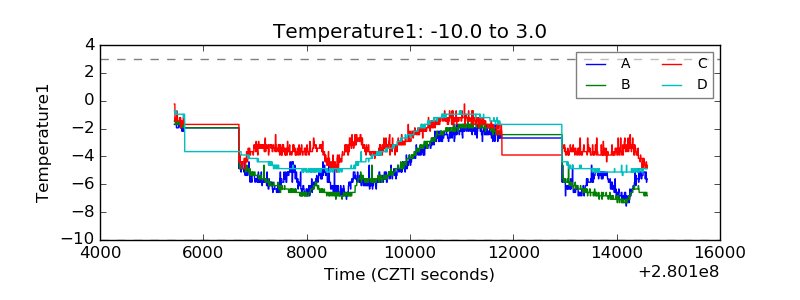 |
| Veto HV Monitor | 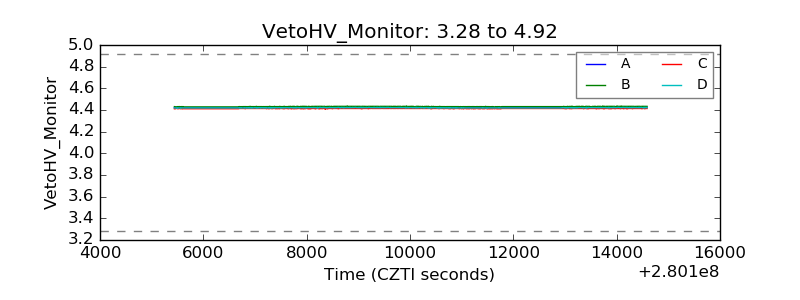 |
| Veto LLD |  |
| Alpha Counter | 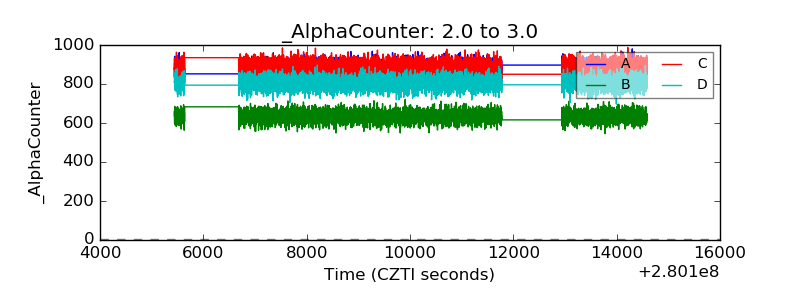 |
| _CPM_Rate | 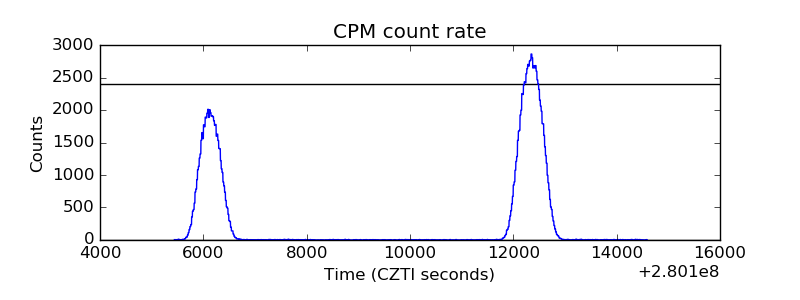 |
| CZT Counter | 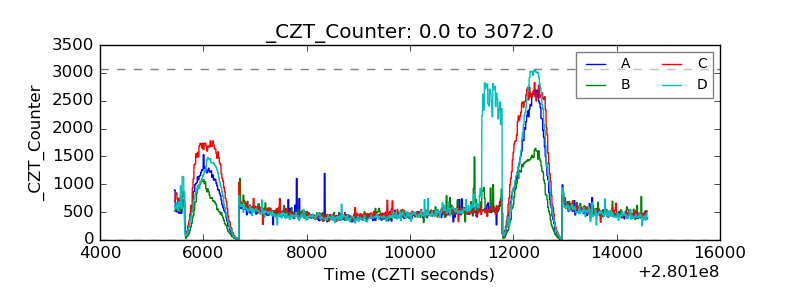 |
| +2.5 Volts monitor |  |
| +5 Volts monitor |  |
| _ROLL_ROT |  |
| _Roll_DEC | 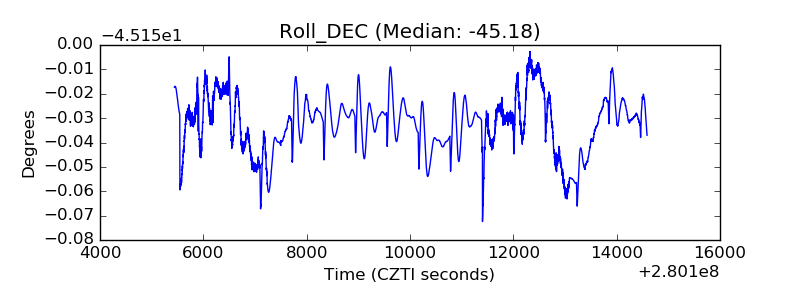 |
| _Roll_RA | 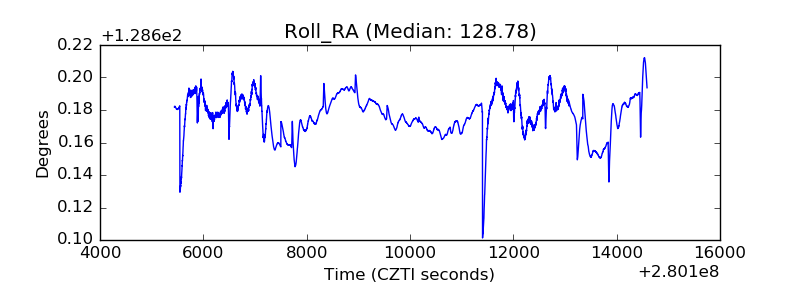 |
| Veto Counter |  |