| Param | Original file | Final file |
|---|---|---|
| Filename | modeM0/AS1A05_188T01_9000002520_16963cztM0_level2.evt | modeM0/AS1A05_188T01_9000002520_16963cztM0_level2_quad_clean.evt |
| Size (bytes) | 468,264,960 | 101,620,800 |
| Size | 446.6 MB | 96.9 MB |
| Events in quadrant A | 3,156,136 | 659,260 |
| Events in quadrant B | 3,370,820 | 681,112 |
| Events in quadrant C | 3,432,399 | 664,108 |
| Events in quadrant D | 3,793,519 | 632,649 |
| Mode M9 | |||
|---|---|---|---|
| Quadrant | BADHDUFLAG | Total packets | Discarded packets |
| A | 0 | 18 | 0 |
| B | 0 | 19 | 0 |
| C | 0 | 19 | 0 |
| D | 0 | 19 | 0 |
| Mode M0 | |||
|---|---|---|---|
| Quadrant | BADHDUFLAG | Total packets | Discarded packets |
| A | 0 | 13180 | 2 |
| B | 0 | 13821 | 2 |
| C | 0 | 14079 | 2 |
| D | 0 | 15317 | 2 |
| Mode SS | |||
|---|---|---|---|
| Quadrant | BADHDUFLAG | Total packets | Discarded packets |
| A | 0 | 130 | 0 |
| B | 0 | 130 | 0 |
| C | 0 | 130 | 0 |
| D | 0 | 130 | 0 |
| Quadrant | Total seconds | Saturated seconds | Saturation percentage |
|---|---|---|---|
| A | 6305 | 15 | 0.237906% |
| B | 6305 | 41 | 0.650278% |
| C | 6305 | 75 | 1.189532% |
| D | 6305 | 120 | 1.903251% |
Noise dominated data is calculated using 1-second bins in cleaned event files. If a bin has >2000 counts, and if more than 50% of those come from <1% of pixels, then it is considered to be noise-dominated and hence unusable.
| Quadrant | # 1 sec bins | Bins with >0 counts | Bins with >2000 counts | High rate bins dominated by noise | Noise dominated (total time) | Noise dominated (detector-on time) | Marked lightcurve |
|---|---|---|---|---|---|---|---|
| A | 7636 | 6307 | 0 | 0 | 0.00% | 0.00% | 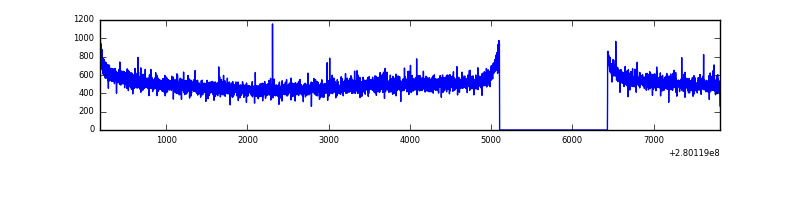 |
| B | 7636 | 6307 | 5 | 5 | 0.07% | 0.08% | 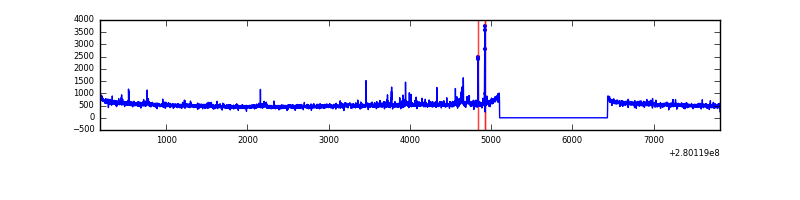 |
| C | 7636 | 6307 | 0 | 0 | 0.00% | 0.00% | 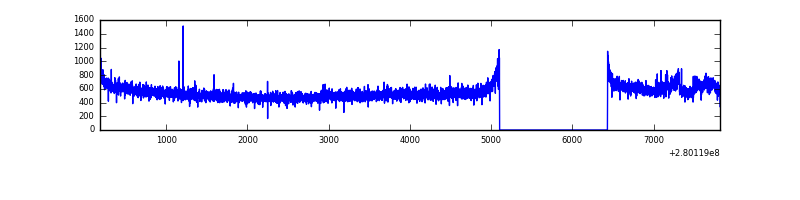 |
| D | 7636 | 6307 | 86 | 86 | 1.13% | 1.36% | 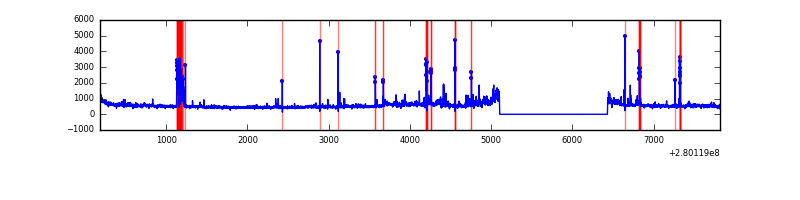 |
Top three noisy pixels from each quadrant. If the there are fewer than three noisy pixels in the level2.evt file, extra rows are filled as -1
| Pixel properties | Quadrant properties | ||||||
|---|---|---|---|---|---|---|---|
| Quadrant | DetID | PixID | Counts | Sigma | Mean | Median | Sigma |
| A | 12 | 189 | 11948 | 68.7 | 818 | 802 | 162.2 |
| A | 0 | 226 | 7331 | 40.24 | 818 | 802 | 162.2 |
| A | 12 | 194 | 6048 | 32.34 | 818 | 802 | 162.2 |
| B | 15 | 35 | 50904 | 329.26 | 827 | 807 | 152.1 |
| B | 7 | 220 | 23557 | 149.52 | 827 | 807 | 152.1 |
| B | 0 | 229 | 17858 | 112.07 | 827 | 807 | 152.1 |
| C | 14 | 238 | 126480 | 664.82 | 816 | 822 | 189.0 |
| C | 3 | 233 | 118316 | 621.62 | 816 | 822 | 189.0 |
| C | 13 | 61 | 5781 | 26.23 | 816 | 822 | 189.0 |
| D | 1 | 52 | 292448 | 1500.66 | 809 | 790 | 194.4 |
| D | 1 | 255 | 145107 | 742.55 | 809 | 790 | 194.4 |
| D | 11 | 129 | 103402 | 527.97 | 809 | 790 | 194.4 |
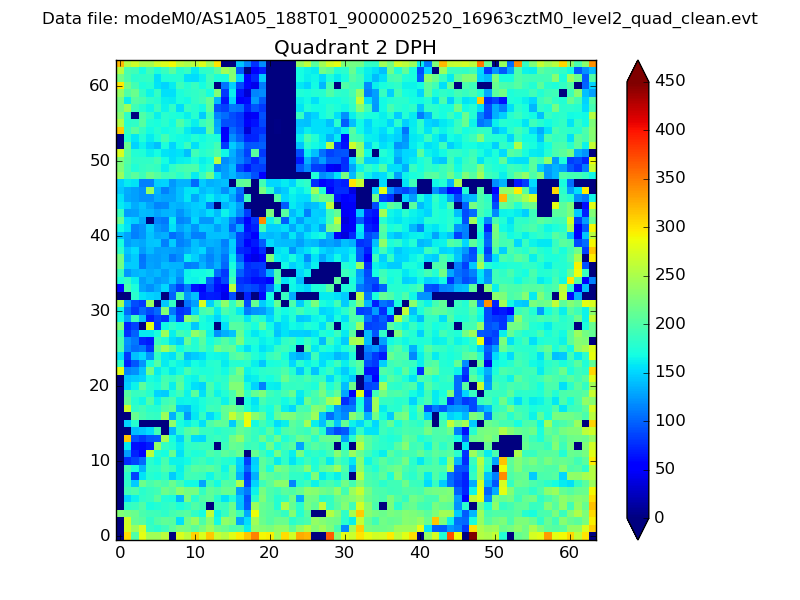
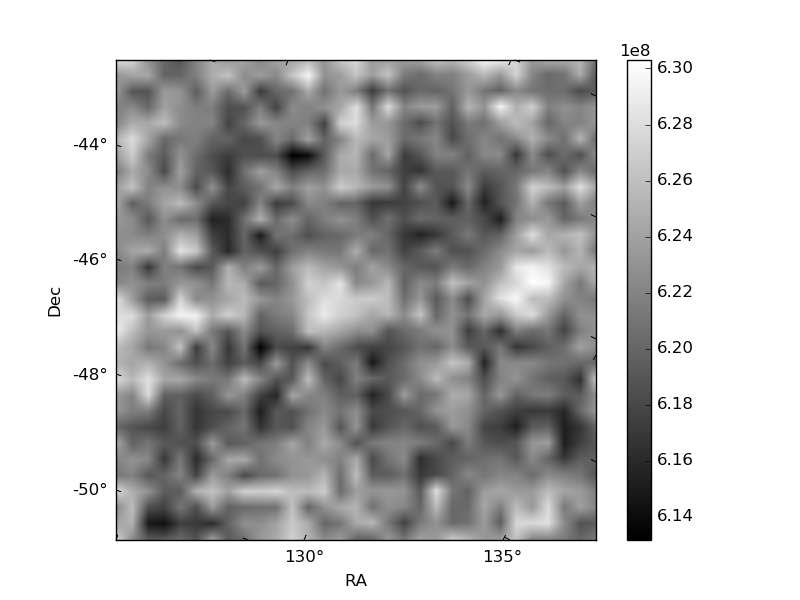
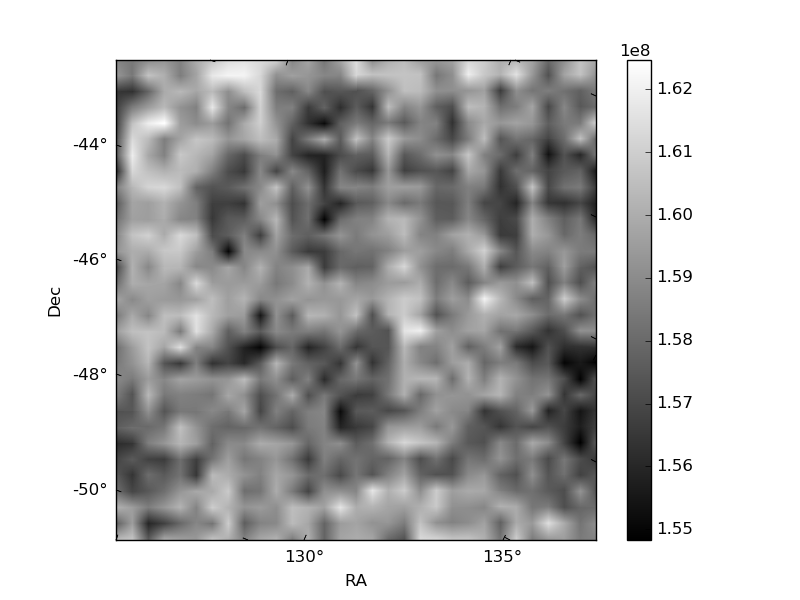
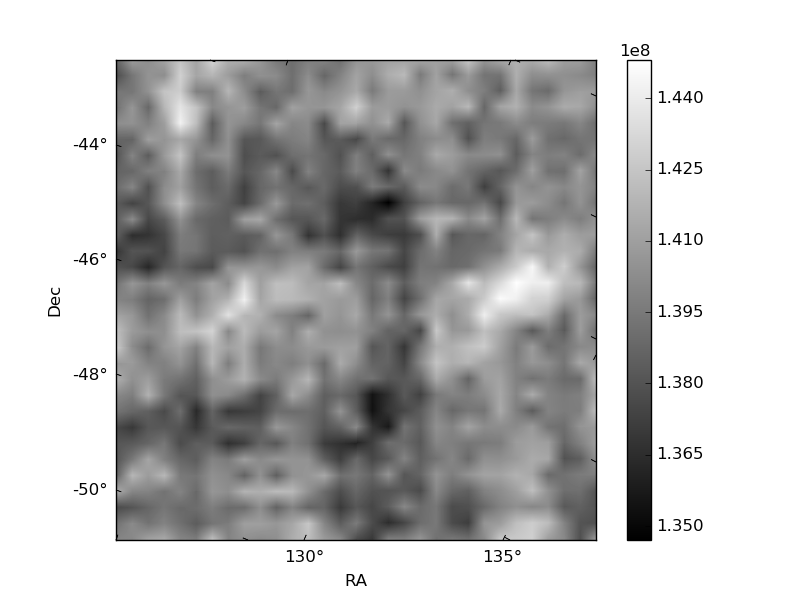
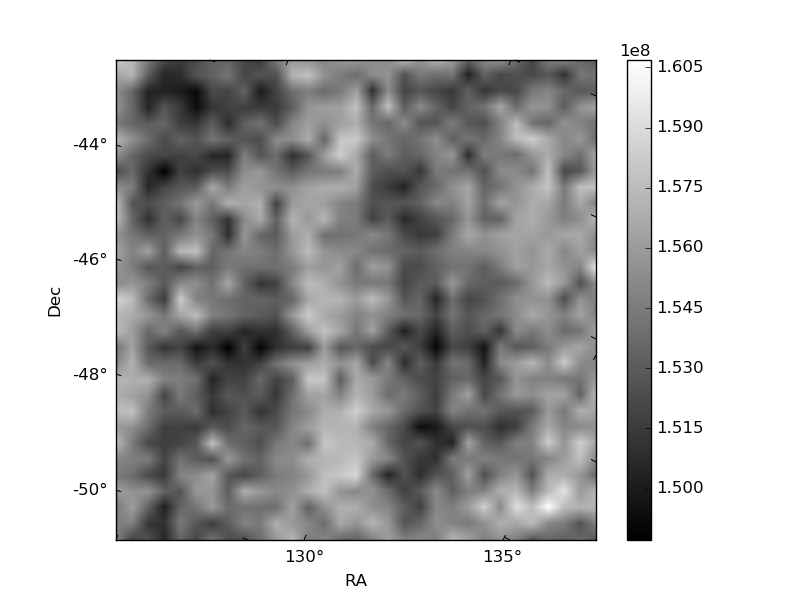
Histogram calculated using DETX and DETY for each event in the final _common_clean file
| Quadrant A | 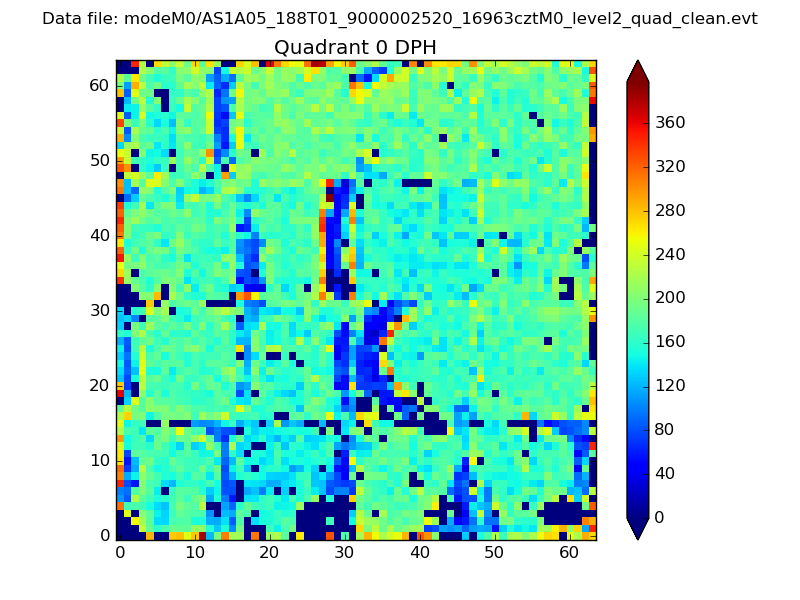 |
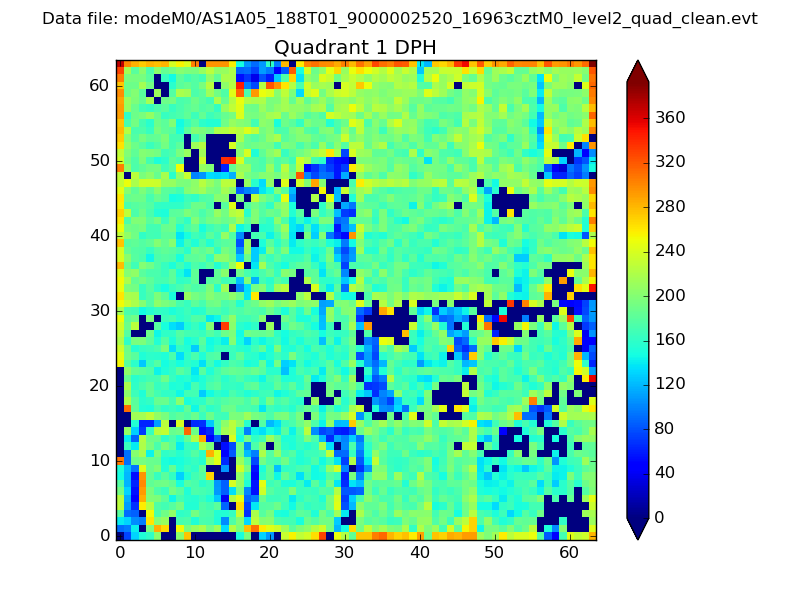 |
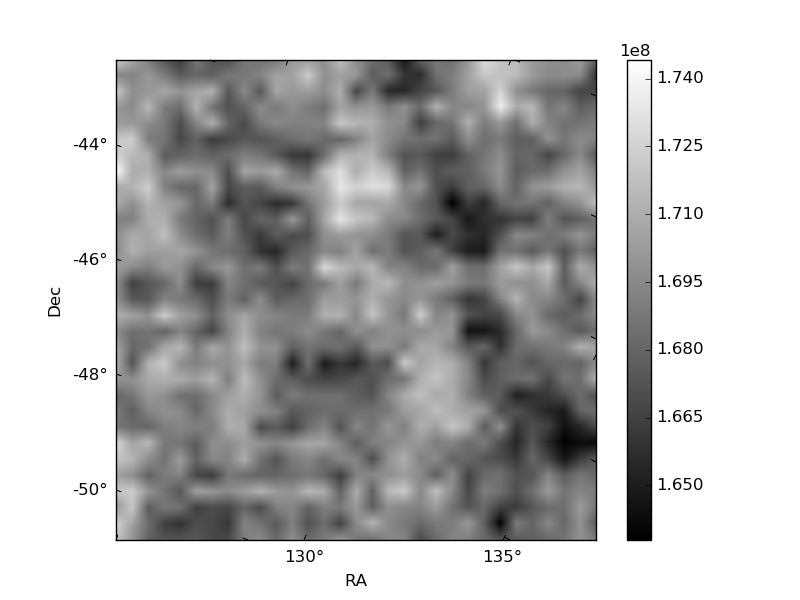
Quadrant B |
|---|---|---|---|
| Quadrant D | 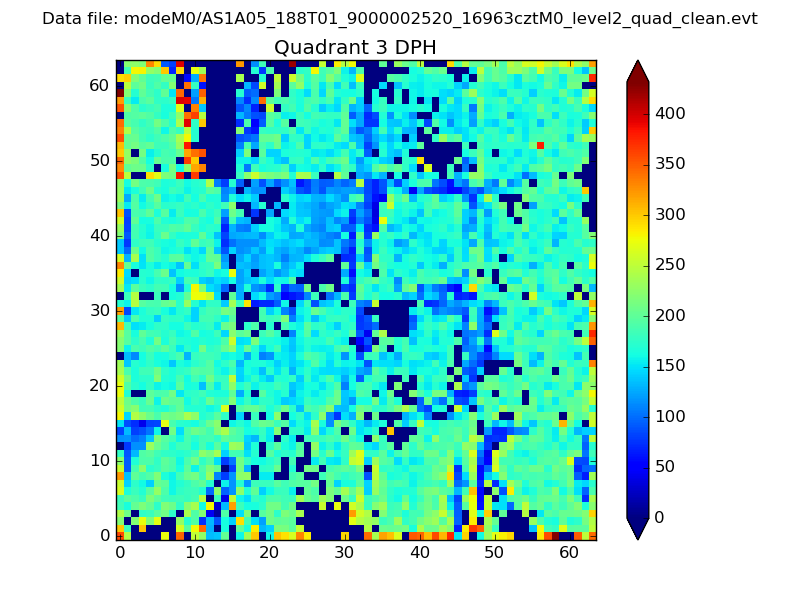 |
 |
Quadrant C |
| Plot type | Count rate plots | Images |
|---|---|---|
| Comparison with Poisson distribution Blue bars denote a histogram of data divided into 1 sec bins. Red curve is a Poisson curve with rate = median count rate of data. |
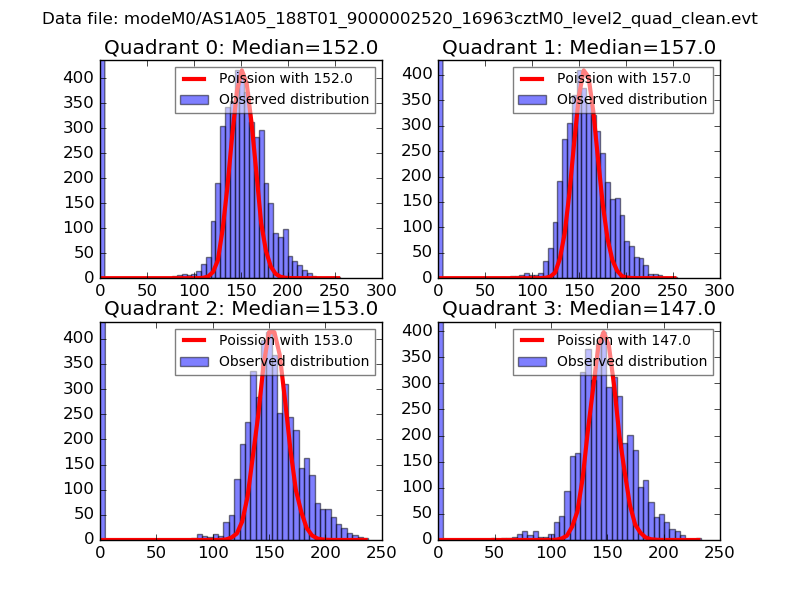 |
 |
| Quadrant-wise count rates Data is divided into 100 sec bins |
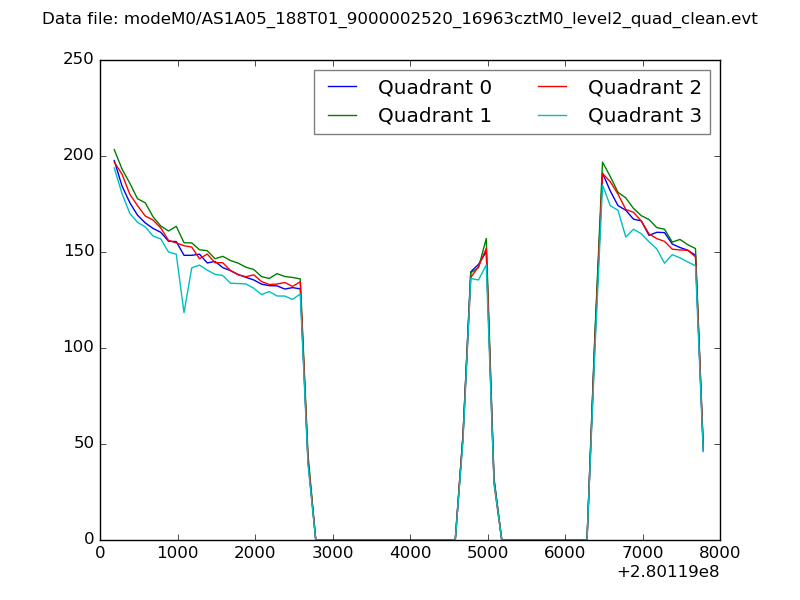 |
|
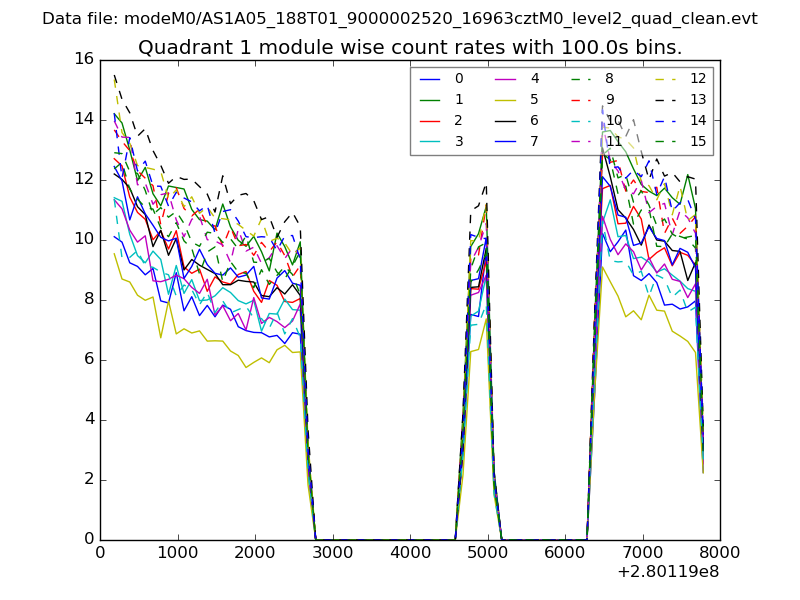
| Module-wise count rates for Quadrant A Data is divided into 100 sec bins |
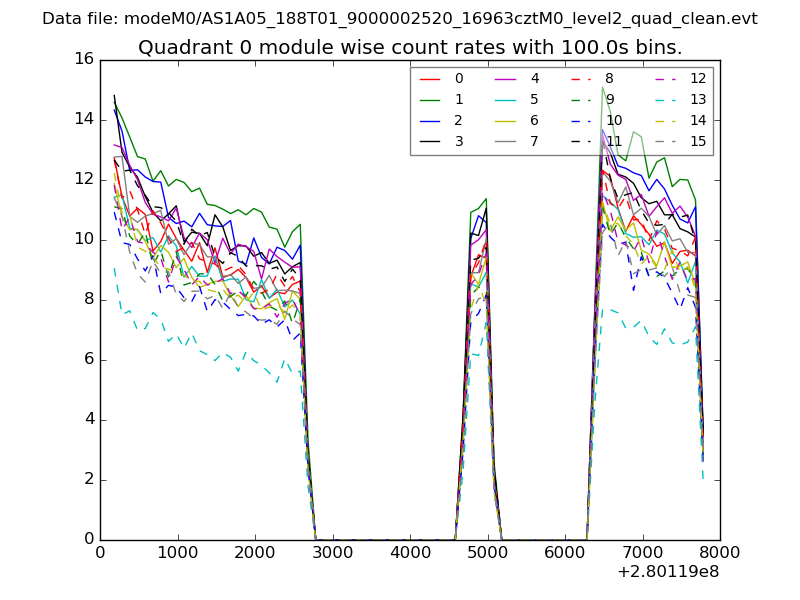 |
 |
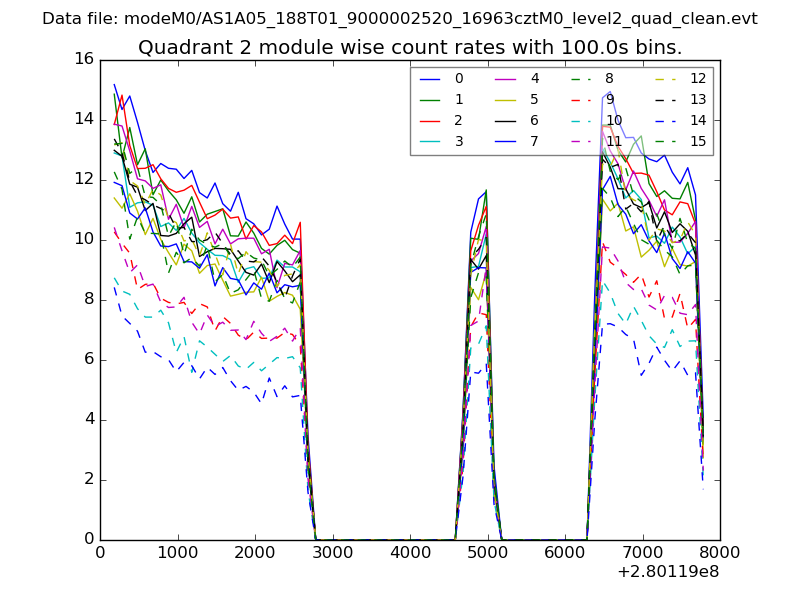
| Module-wise count rates for Quadrant B Data is divided into 100 sec bins |
 |
 |
| Module-wise count rates for Quadrant C Data is divided into 100 sec bins |
 |
 |
| Module-wise count rates for Quadrant D Data is divided into 100 sec bins |
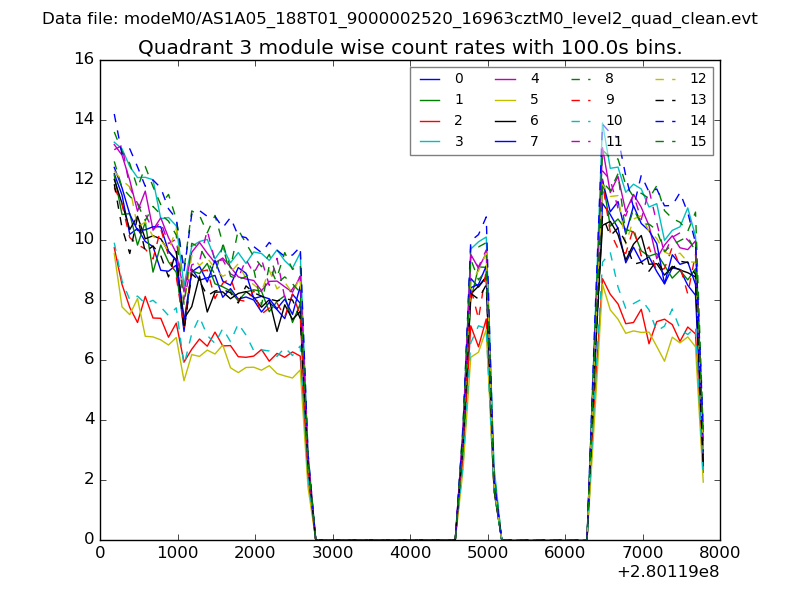 |
 |
| Parameter | Plot |
|---|---|
| CZT HV Monitor | 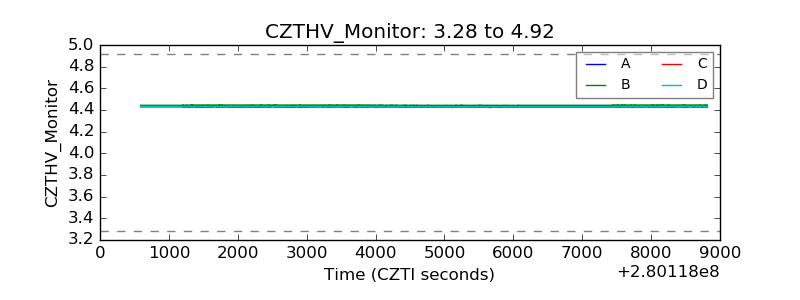 |
| D_VDD | 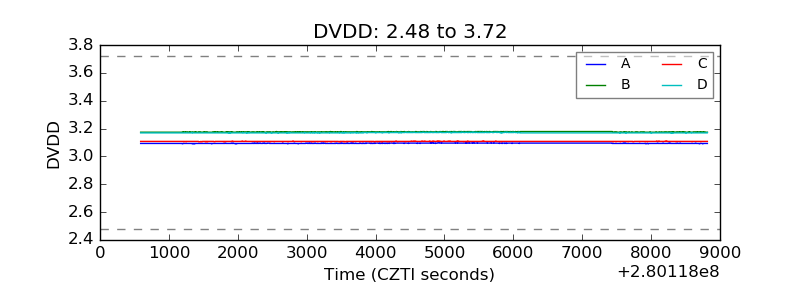 |
| Temperature 1 |  |
| Veto HV Monitor | 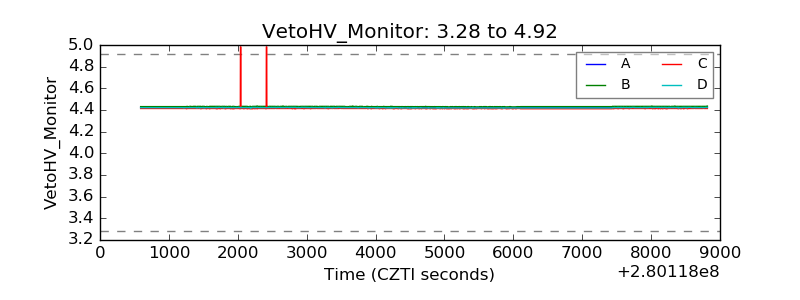 |
| Veto LLD | 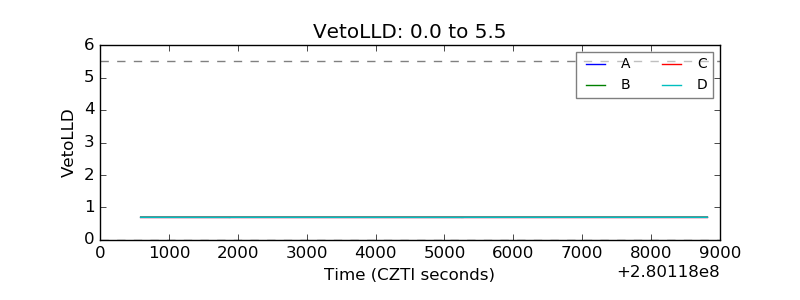 |
| Alpha Counter | 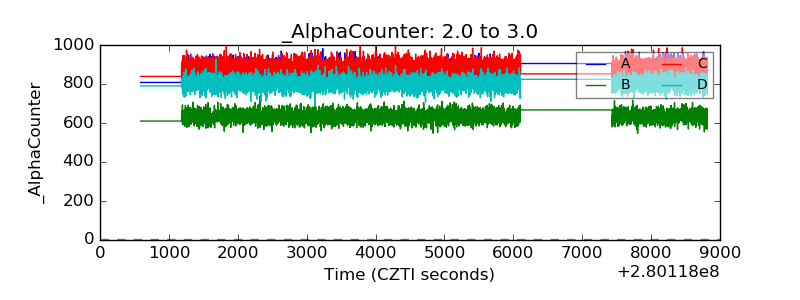 |
| _CPM_Rate | 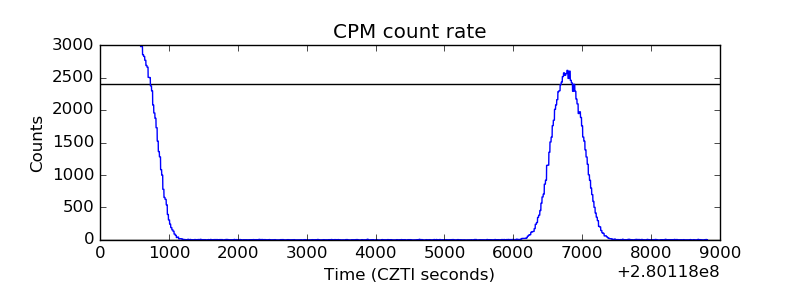 |
| CZT Counter | 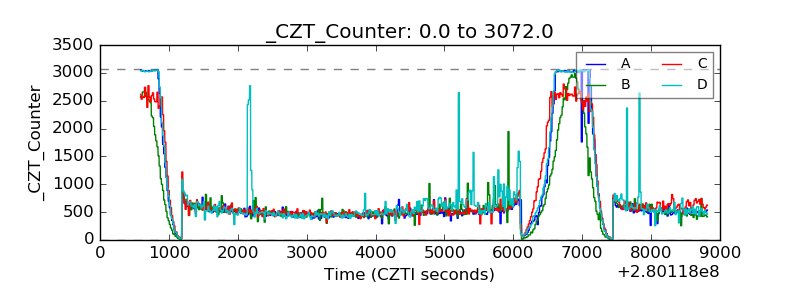 |
| +2.5 Volts monitor |  |
| +5 Volts monitor |  |
| _ROLL_ROT | 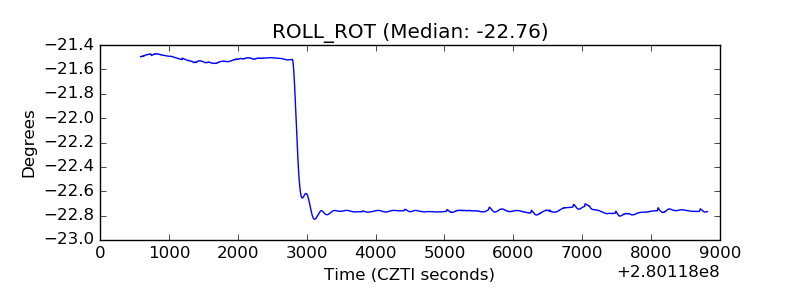 |
| _Roll_DEC | 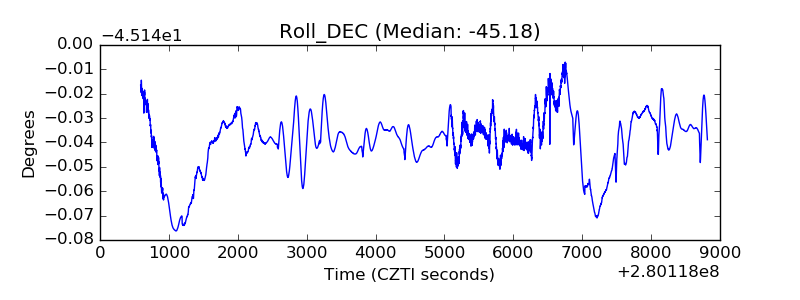 |
| _Roll_RA | 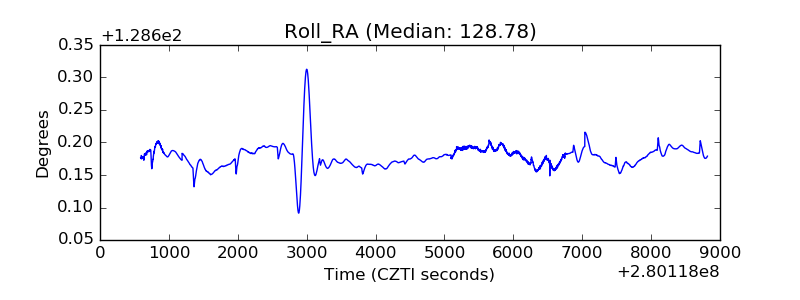 |
| Veto Counter | 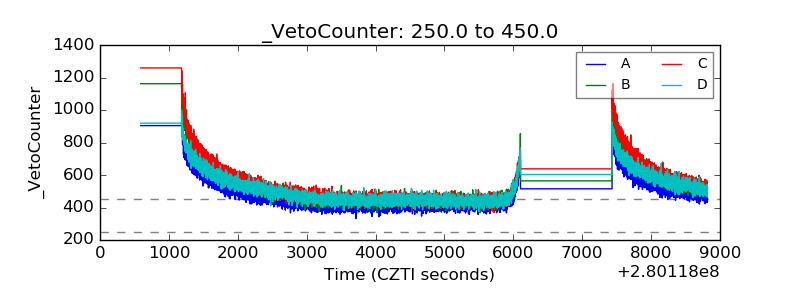 |