| Param | Original file | Final file |
|---|---|---|
| Filename | modeM0/AS1A05_188T01_9000002520_16964cztM0_level2.evt | modeM0/AS1A05_188T01_9000002520_16964cztM0_level2_quad_clean.evt |
| Size (bytes) | 537,010,560 | 97,623,360 |
| Size | 512.1 MB | 93.1 MB |
| Events in quadrant A | 3,166,948 | 650,414 |
| Events in quadrant B | 5,382,861 | 591,027 |
| Events in quadrant C | 3,505,734 | 650,478 |
| Events in quadrant D | 3,783,954 | 627,681 |
| Mode M9 | |||
|---|---|---|---|
| Quadrant | BADHDUFLAG | Total packets | Discarded packets |
| A | 0 | 15 | 0 |
| B | 0 | 16 | 0 |
| C | 0 | 16 | 0 |
| D | 0 | 16 | 0 |
| Mode M0 | |||
|---|---|---|---|
| Quadrant | BADHDUFLAG | Total packets | Discarded packets |
| A | 0 | 13046 | 2 |
| B | 0 | 20044 | 3 |
| C | 0 | 14179 | 2 |
| D | 0 | 15096 | 2 |
| Mode SS | |||
|---|---|---|---|
| Quadrant | BADHDUFLAG | Total packets | Discarded packets |
| A | 0 | 128 | 0 |
| B | 0 | 128 | 0 |
| C | 0 | 128 | 0 |
| D | 0 | 128 | 0 |
| Quadrant | Total seconds | Saturated seconds | Saturation percentage |
|---|---|---|---|
| A | 6252 | 30 | 0.479846% |
| B | 6251 | 836 | 13.373860% |
| C | 6251 | 76 | 1.215805% |
| D | 6251 | 76 | 1.215805% |
Noise dominated data is calculated using 1-second bins in cleaned event files. If a bin has >2000 counts, and if more than 50% of those come from <1% of pixels, then it is considered to be noise-dominated and hence unusable.
| Quadrant | # 1 sec bins | Bins with >0 counts | Bins with >2000 counts | High rate bins dominated by noise | Noise dominated (total time) | Noise dominated (detector-on time) | Marked lightcurve |
|---|---|---|---|---|---|---|---|
| A | 7588 | 6254 | 0 | 0 | 0.00% | 0.00% | 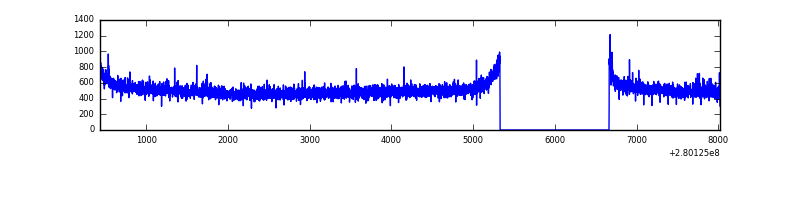 |
| B | 7587 | 6253 | 688 | 688 | 9.07% | 11.00% | 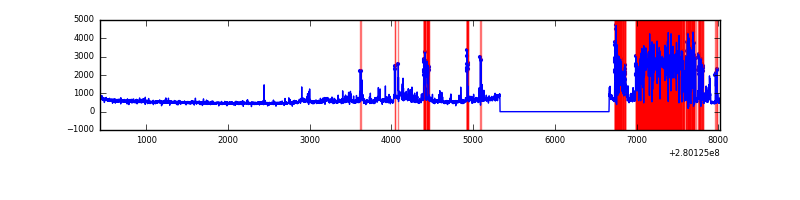 |
| C | 7587 | 6253 | 0 | 0 | 0.00% | 0.00% | 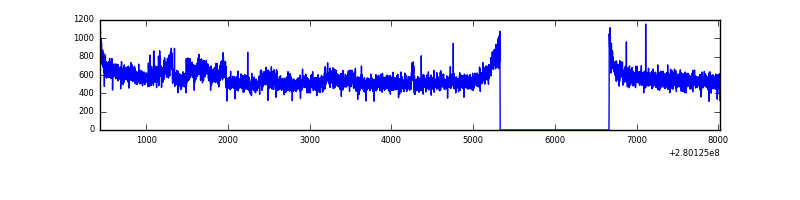 |
| D | 7587 | 6253 | 49 | 49 | 0.65% | 0.78% | 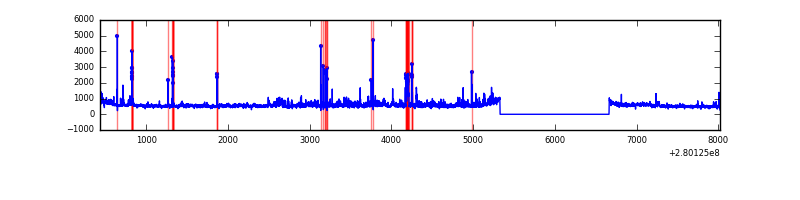 |
Top three noisy pixels from each quadrant. If the there are fewer than three noisy pixels in the level2.evt file, extra rows are filled as -1
| Pixel properties | Quadrant properties | ||||||
|---|---|---|---|---|---|---|---|
| Quadrant | DetID | PixID | Counts | Sigma | Mean | Median | Sigma |
| A | 12 | 189 | 20027 | 118.38 | 819 | 803 | 162.4 |
| A | 0 | 226 | 7227 | 39.56 | 819 | 803 | 162.4 |
| A | 12 | 194 | 6001 | 32.01 | 819 | 803 | 162.4 |
| B | 3 | 64 | 2180455 | 15422.91 | 764 | 746 | 141.3 |
| B | 15 | 35 | 78076 | 547.16 | 764 | 746 | 141.3 |
| B | 0 | 197 | 49172 | 342.65 | 764 | 746 | 141.3 |
| C | 3 | 233 | 220501 | 1175.46 | 809 | 817 | 186.9 |
| C | 14 | 238 | 124786 | 663.32 | 809 | 817 | 186.9 |
| C | 13 | 61 | 5751 | 26.4 | 809 | 817 | 186.9 |
| D | 1 | 52 | 425875 | 2172.38 | 809 | 788 | 195.7 |
| D | 11 | 129 | 111095 | 563.72 | 809 | 788 | 195.7 |
| D | 1 | 255 | 77530 | 392.19 | 809 | 788 | 195.7 |
Histogram calculated using DETX and DETY for each event in the final _common_clean file
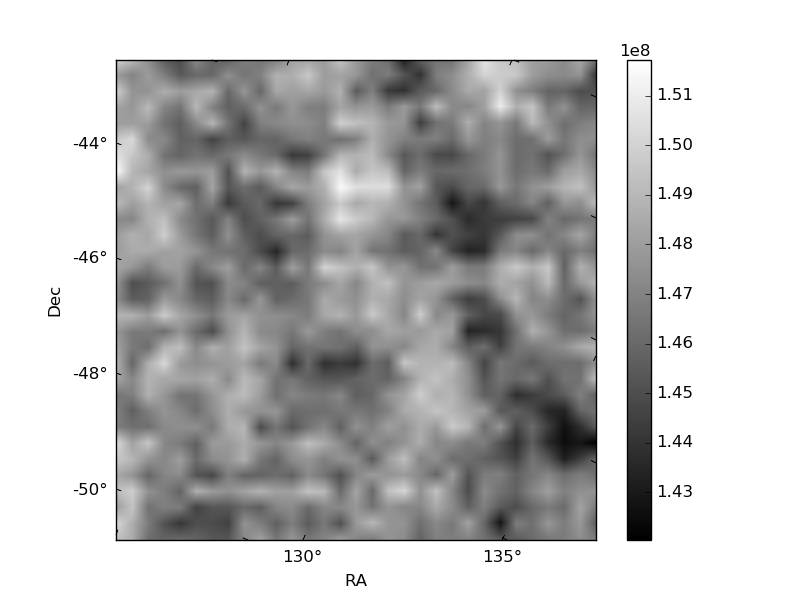
| Quadrant A | 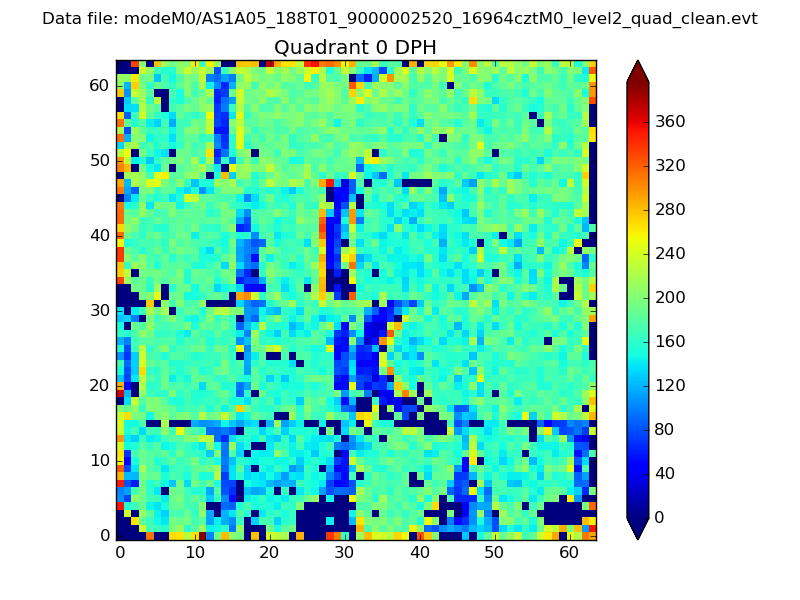 |
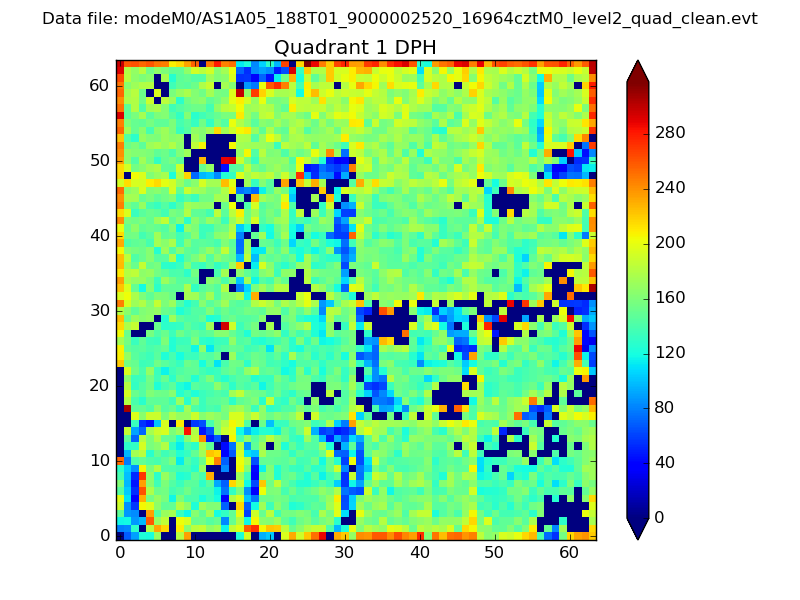 |
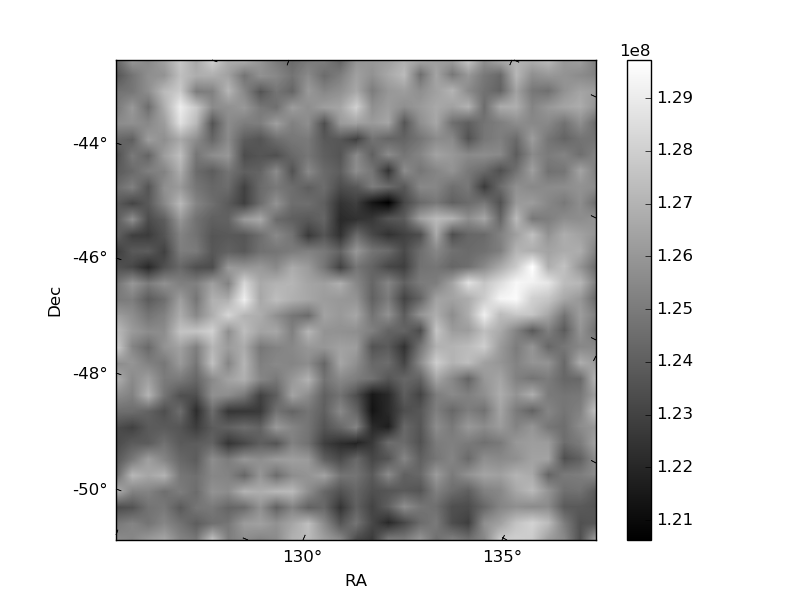
Quadrant B |
|---|---|---|---|
| Quadrant D | 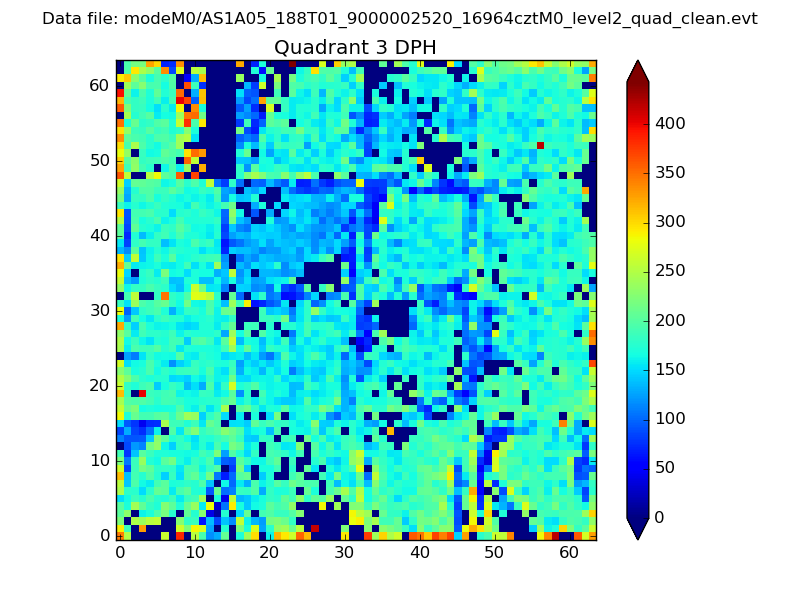 |
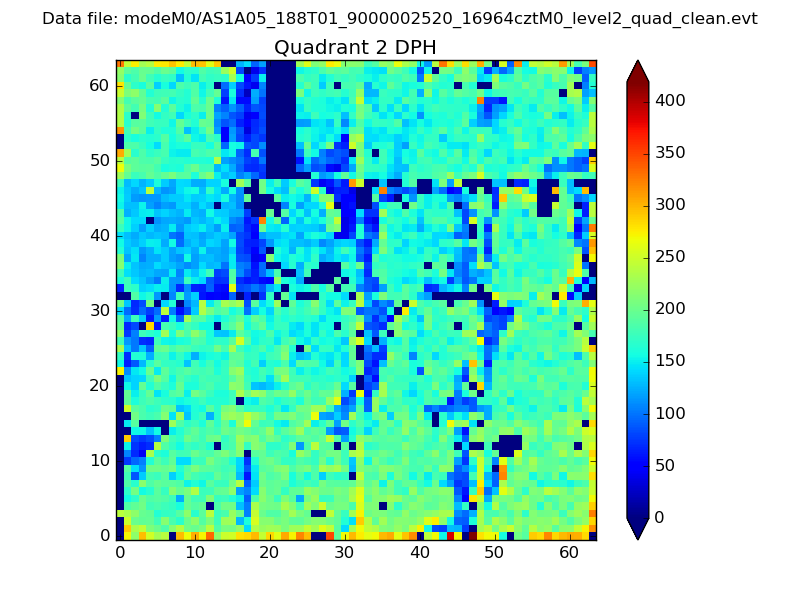 |
Quadrant C |
| Plot type | Count rate plots | Images |
|---|---|---|
| Comparison with Poisson distribution Blue bars denote a histogram of data divided into 1 sec bins. Red curve is a Poisson curve with rate = median count rate of data. |
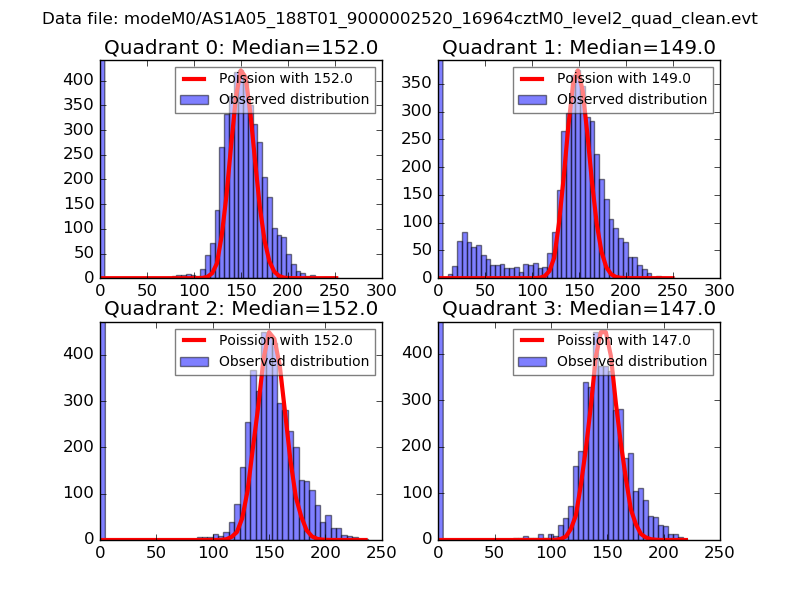 |
 |
| Quadrant-wise count rates Data is divided into 100 sec bins |
 |
|
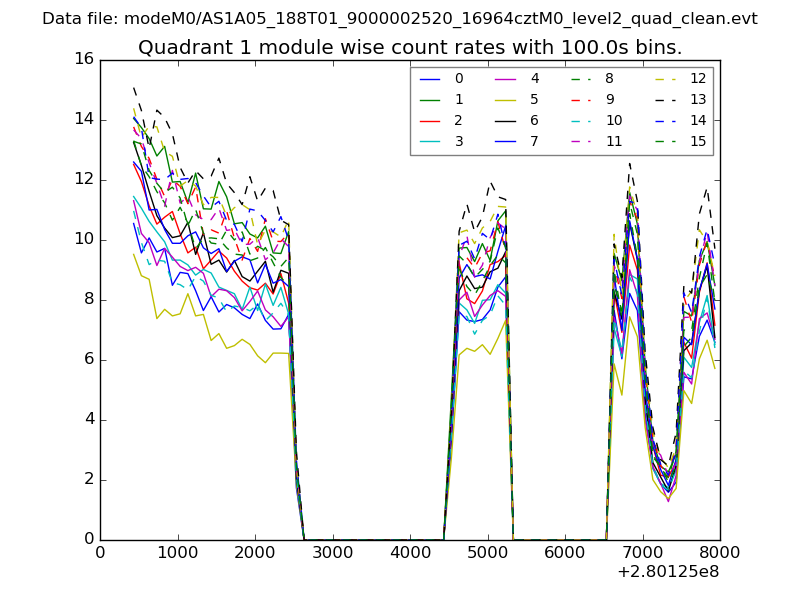
| Module-wise count rates for Quadrant A Data is divided into 100 sec bins |
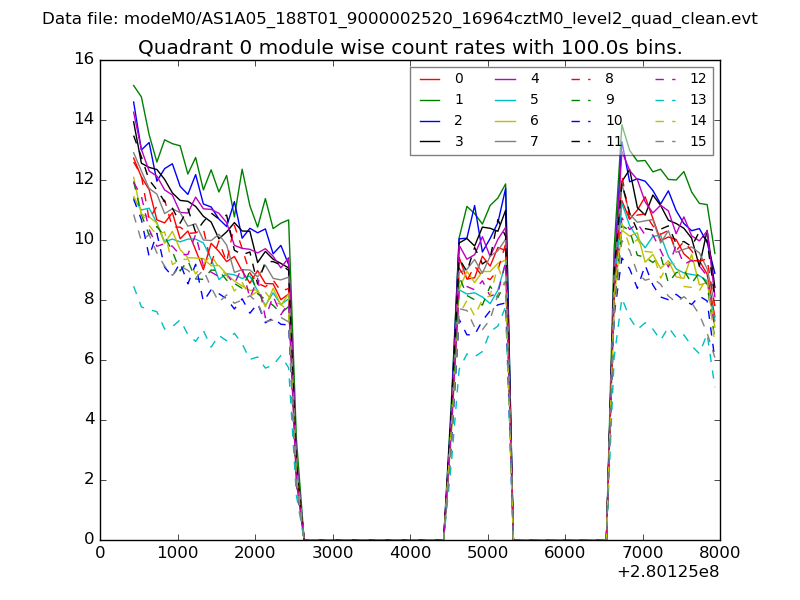 |
 |
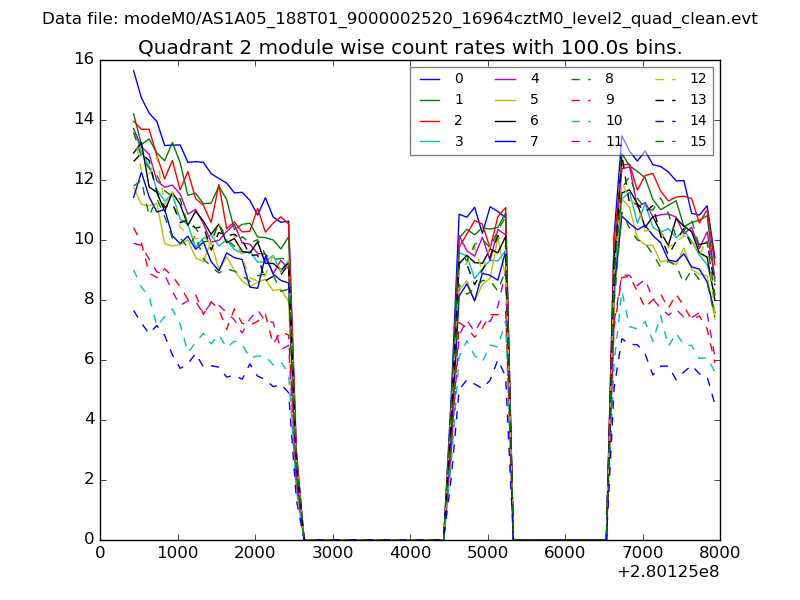
| Module-wise count rates for Quadrant B Data is divided into 100 sec bins |
 |
 |
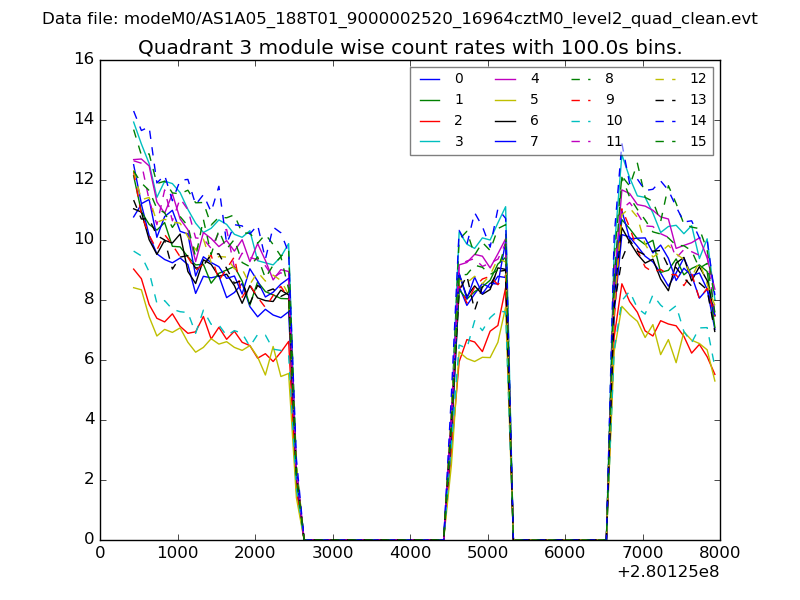
| Module-wise count rates for Quadrant C Data is divided into 100 sec bins |
 |
 |
| Module-wise count rates for Quadrant D Data is divided into 100 sec bins |
 |
 |
| Parameter | Plot |
|---|---|
| CZT HV Monitor | 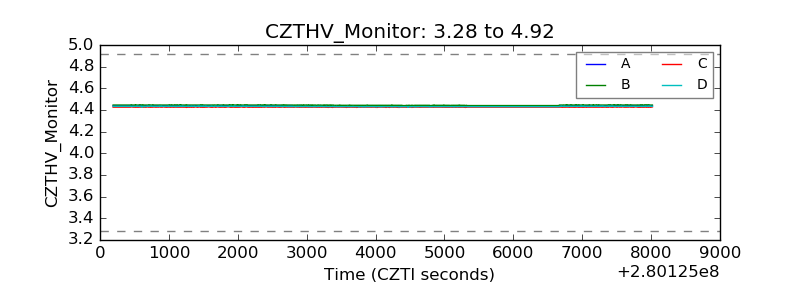 |
| D_VDD | 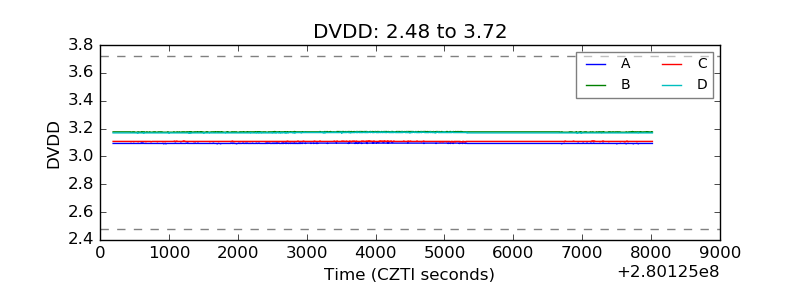 |
| Temperature 1 |  |
| Veto HV Monitor | 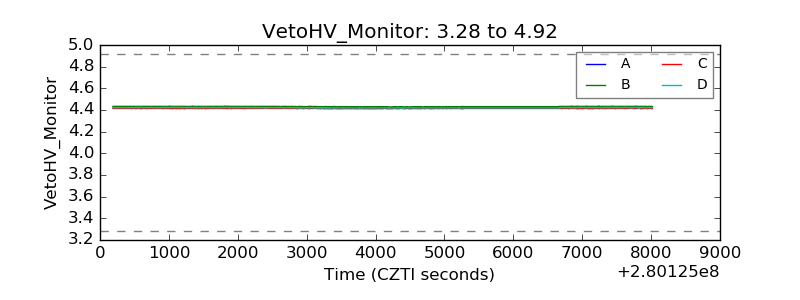 |
| Veto LLD | 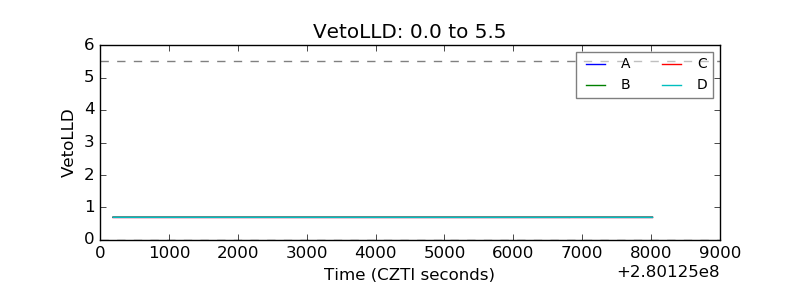 |
| Alpha Counter | 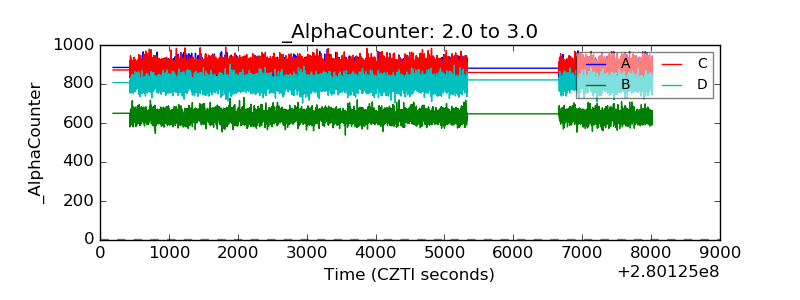 |
| _CPM_Rate |  |
| CZT Counter | 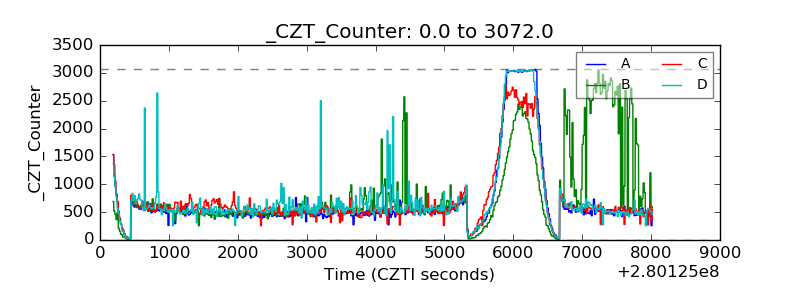 |
| +2.5 Volts monitor |  |
| +5 Volts monitor |  |
| _ROLL_ROT | 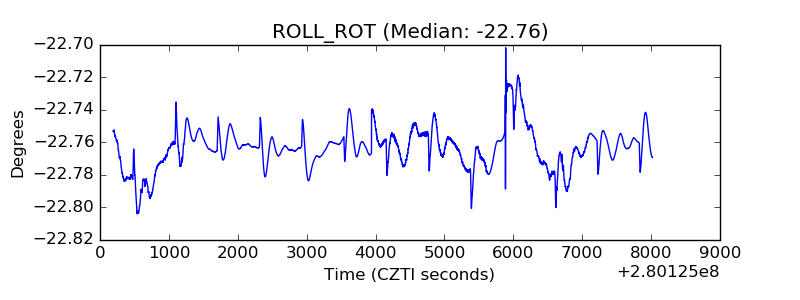 |
| _Roll_DEC | 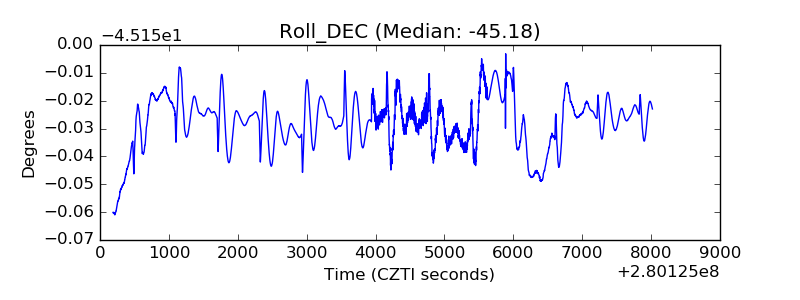 |
| _Roll_RA | 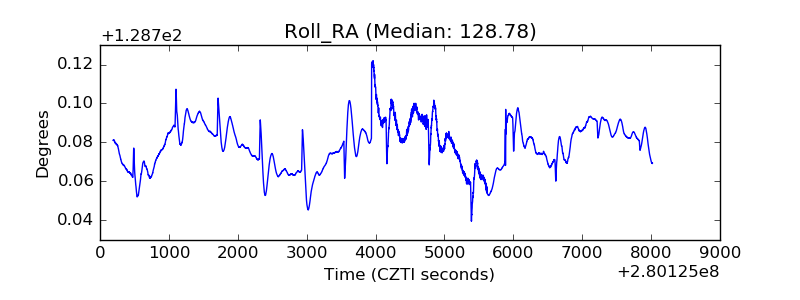 |
| Veto Counter | 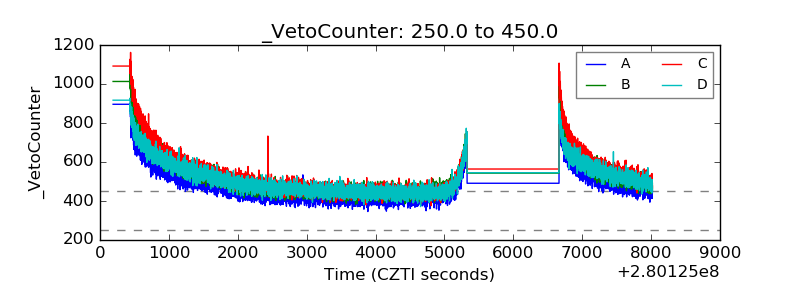 |