| Param | Original file | Final file |
|---|---|---|
| Filename | modeM0/AS1A05_188T01_9000002520_16966cztM0_level2.evt | modeM0/AS1A05_188T01_9000002520_16966cztM0_level2_quad_clean.evt |
| Size (bytes) | 584,055,360 | 84,821,760 |
| Size | 557.0 MB | 80.9 MB |
| Events in quadrant A | 3,060,804 | 554,455 |
| Events in quadrant B | 7,153,307 | 485,238 |
| Events in quadrant C | 3,630,288 | 544,919 |
| Events in quadrant D | 3,405,903 | 533,303 |
| Mode M9 | |||
|---|---|---|---|
| Quadrant | BADHDUFLAG | Total packets | Discarded packets |
| A | 0 | 9 | 0 |
| B | 0 | 9 | 0 |
| C | 0 | 9 | 0 |
| D | 0 | 9 | 0 |
| Mode M0 | |||
|---|---|---|---|
| Quadrant | BADHDUFLAG | Total packets | Discarded packets |
| A | 0 | 13171 | 1 |
| B | 0 | 25371 | 1 |
| C | 0 | 14608 | 1 |
| D | 0 | 13941 | 1 |
| Mode SS | |||
|---|---|---|---|
| Quadrant | BADHDUFLAG | Total packets | Discarded packets |
| A | 0 | 132 | 0 |
| B | 0 | 132 | 0 |
| C | 0 | 132 | 0 |
| D | 0 | 132 | 0 |
| Quadrant | Total seconds | Saturated seconds | Saturation percentage |
|---|---|---|---|
| A | 6449 | 103 | 1.597147% |
| B | 6450 | 1880 | 29.147287% |
| C | 6450 | 143 | 2.217054% |
| D | 6450 | 95 | 1.472868% |
Noise dominated data is calculated using 1-second bins in cleaned event files. If a bin has >2000 counts, and if more than 50% of those come from <1% of pixels, then it is considered to be noise-dominated and hence unusable.
| Quadrant | # 1 sec bins | Bins with >0 counts | Bins with >2000 counts | High rate bins dominated by noise | Noise dominated (total time) | Noise dominated (detector-on time) | Marked lightcurve |
|---|---|---|---|---|---|---|---|
| A | 7370 | 6451 | 0 | 0 | 0.00% | 0.00% | 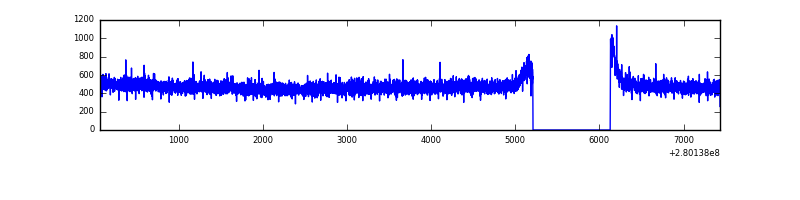 |
| B | 7371 | 6452 | 1317 | 1317 | 17.87% | 20.41% | 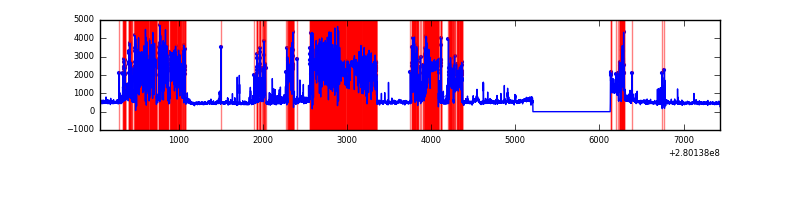 |
| C | 7371 | 6452 | 0 | 0 | 0.00% | 0.00% | 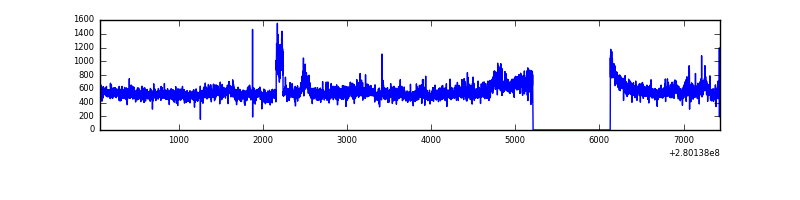 |
| D | 7371 | 6452 | 9 | 9 | 0.12% | 0.14% | 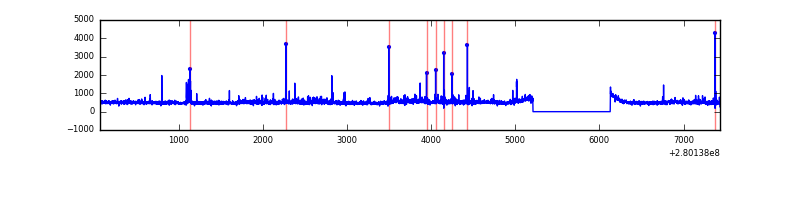 |
Top three noisy pixels from each quadrant. If the there are fewer than three noisy pixels in the level2.evt file, extra rows are filled as -1
| Pixel properties | Quadrant properties | ||||||
|---|---|---|---|---|---|---|---|
| Quadrant | DetID | PixID | Counts | Sigma | Mean | Median | Sigma |
| A | 0 | 226 | 7255 | 40.34 | 794 | 777 | 160.6 |
| A | 12 | 194 | 5772 | 31.11 | 794 | 777 | 160.6 |
| A | 15 | 174 | 5761 | 31.04 | 794 | 777 | 160.6 |
| B | 3 | 64 | 4409259 | 34941.36 | 664 | 645 | 126.2 |
| B | 15 | 35 | 41151 | 321.04 | 664 | 645 | 126.2 |
| B | 0 | 229 | 28034 | 217.08 | 664 | 645 | 126.2 |
| C | 3 | 233 | 494871 | 2759.57 | 772 | 778 | 179.0 |
| C | 14 | 238 | 118519 | 657.6 | 772 | 778 | 179.0 |
| C | 13 | 61 | 5523 | 26.5 | 772 | 778 | 179.0 |
| D | 1 | 52 | 311238 | 1615.15 | 786 | 764 | 192.2 |
| D | 10 | 70 | 43028 | 219.87 | 786 | 764 | 192.2 |
| D | 15 | 145 | 27714 | 140.2 | 786 | 764 | 192.2 |
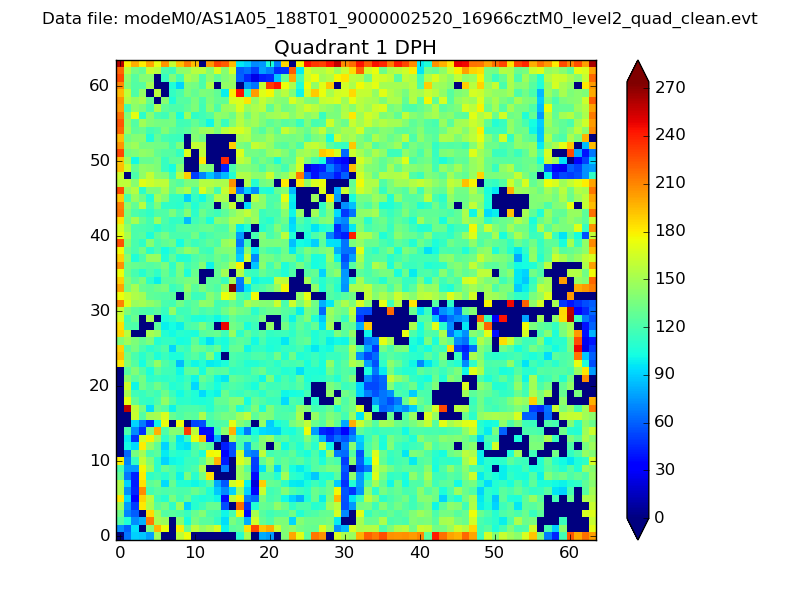
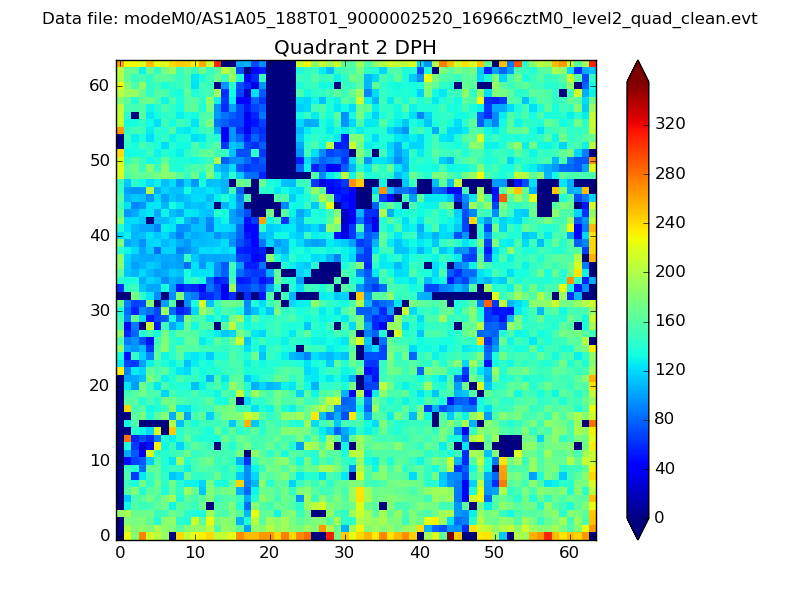
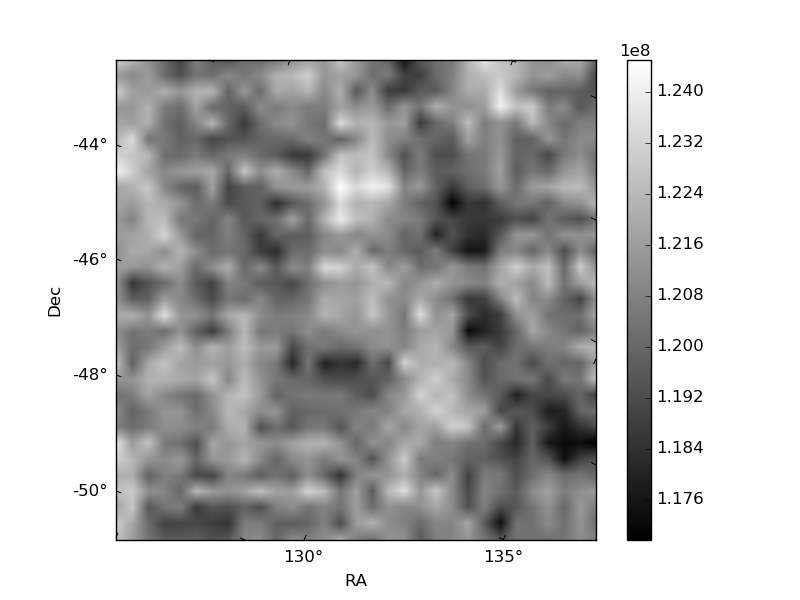
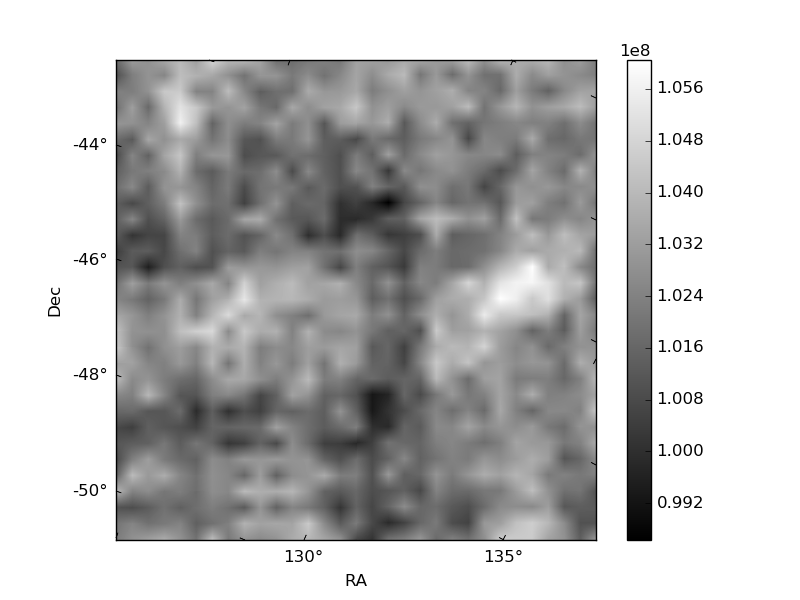
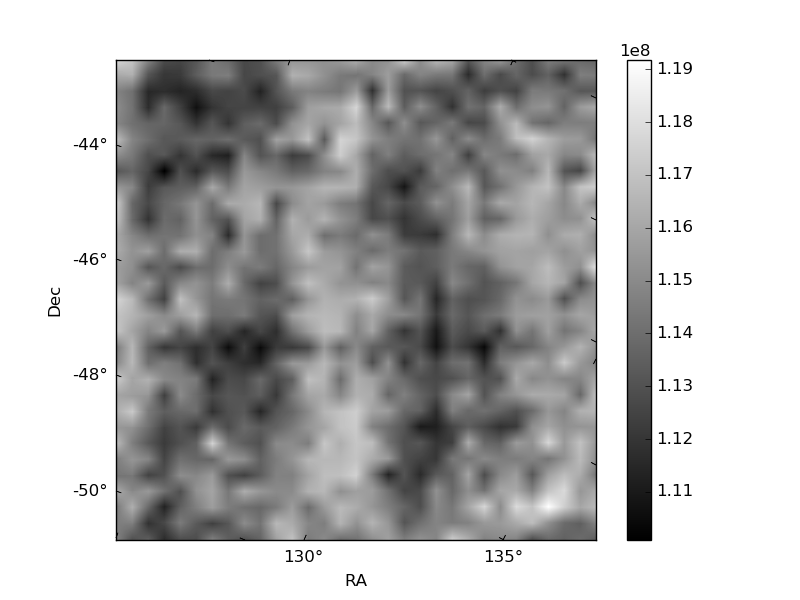
Histogram calculated using DETX and DETY for each event in the final _common_clean file
| Quadrant A |  |
 |
Quadrant B |
|---|---|---|---|
| Quadrant D |  |
 |
Quadrant C |
| Plot type | Count rate plots | Images |
|---|---|---|
| Comparison with Poisson distribution Blue bars denote a histogram of data divided into 1 sec bins. Red curve is a Poisson curve with rate = median count rate of data. |
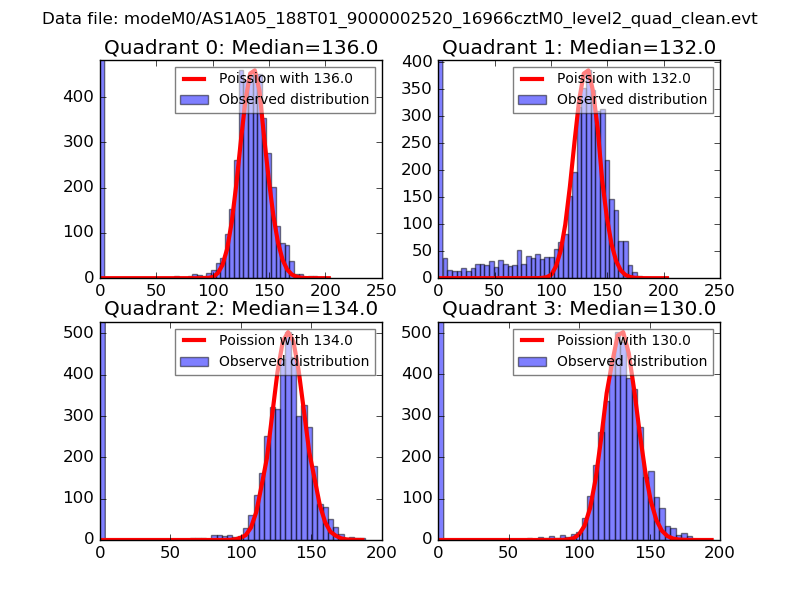 |
 |
| Quadrant-wise count rates Data is divided into 100 sec bins |
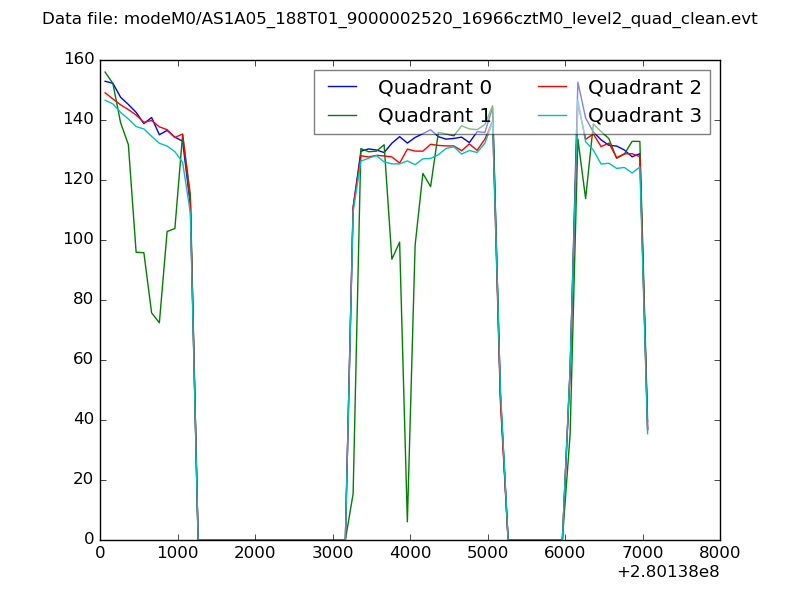 |
|
| Module-wise count rates for Quadrant A Data is divided into 100 sec bins |
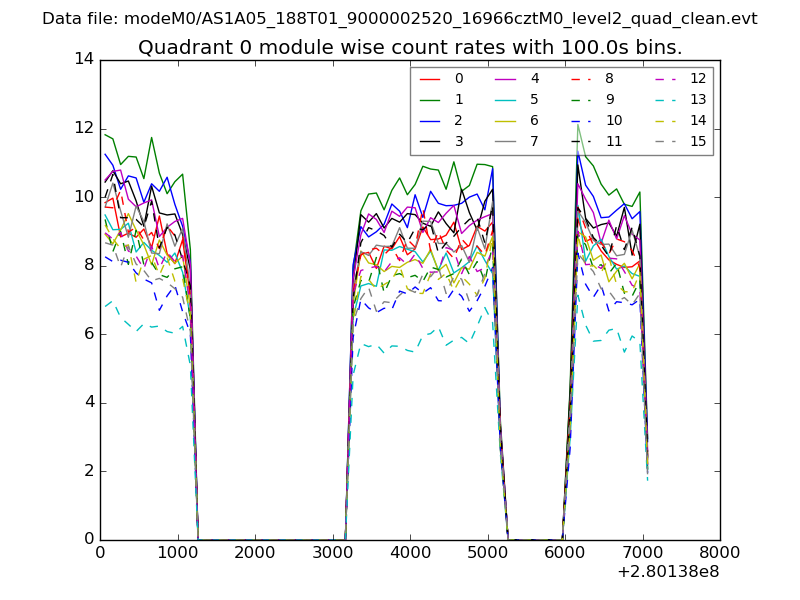 |
 |
| Module-wise count rates for Quadrant B Data is divided into 100 sec bins |
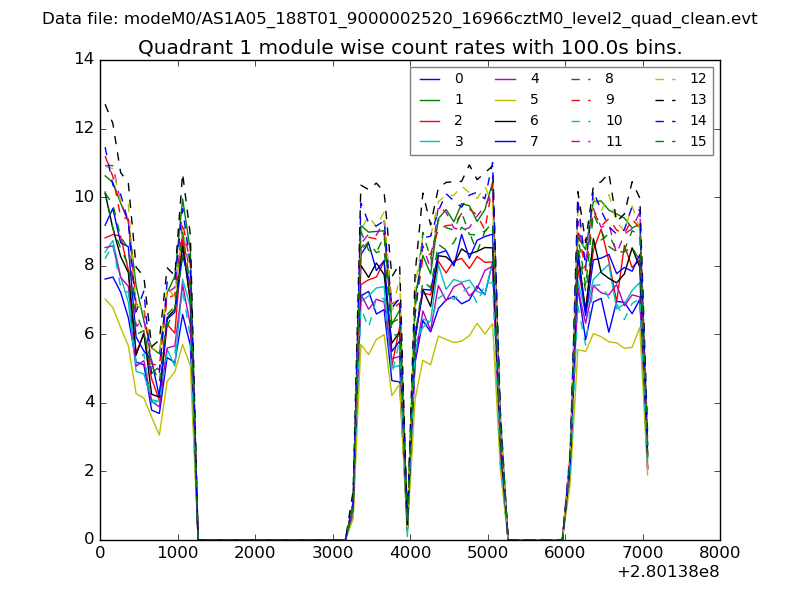 |
 |
| Module-wise count rates for Quadrant C Data is divided into 100 sec bins |
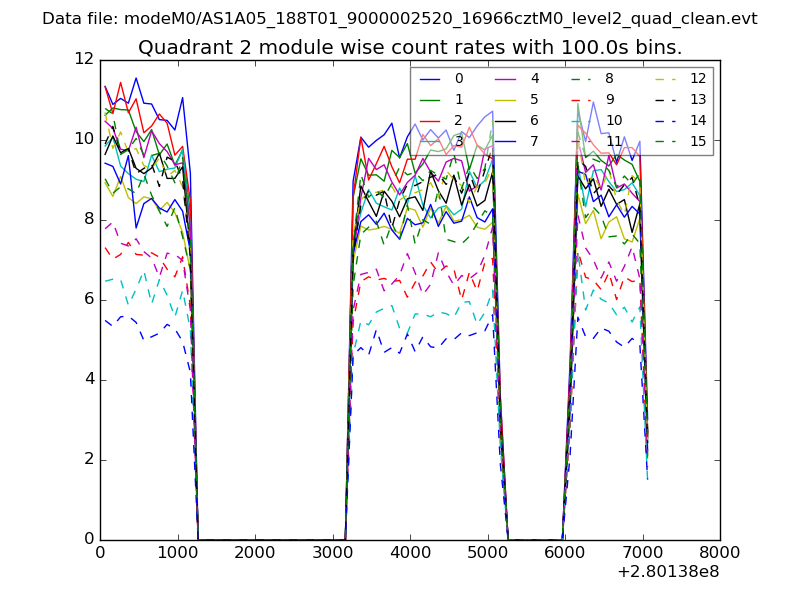 |
 |
| Module-wise count rates for Quadrant D Data is divided into 100 sec bins |
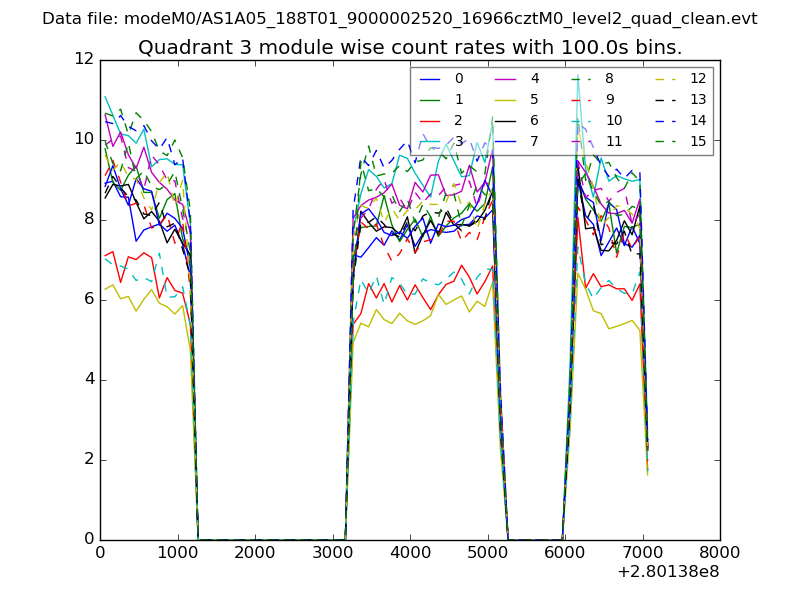 |
 |
| Parameter | Plot |
|---|---|
| CZT HV Monitor | 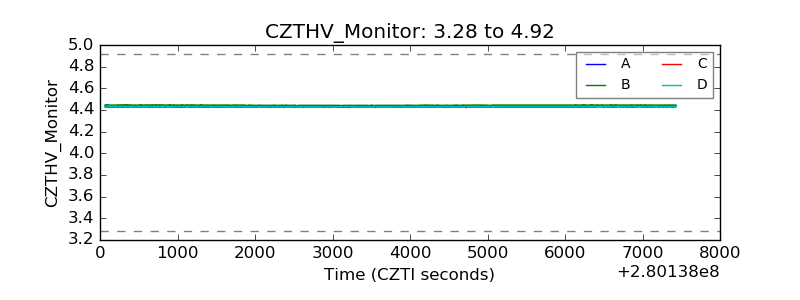 |
| D_VDD | 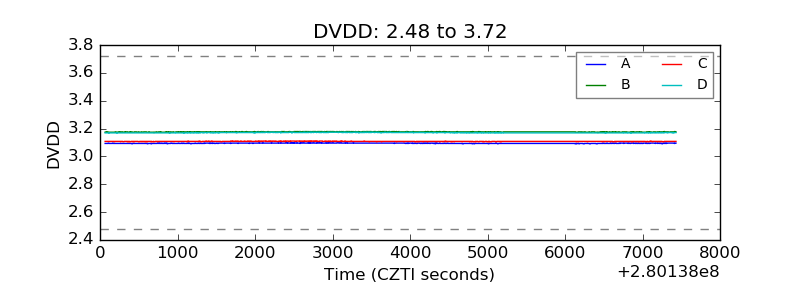 |
| Temperature 1 | 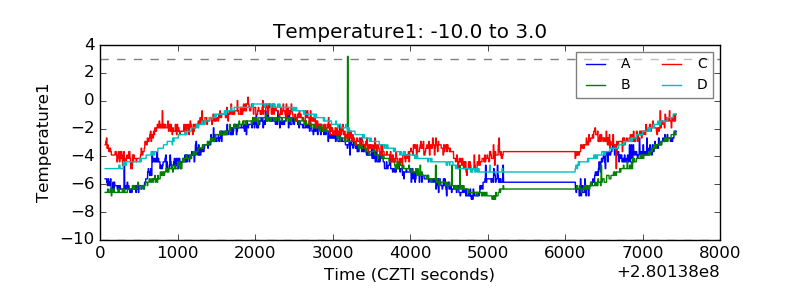 |
| Veto HV Monitor | 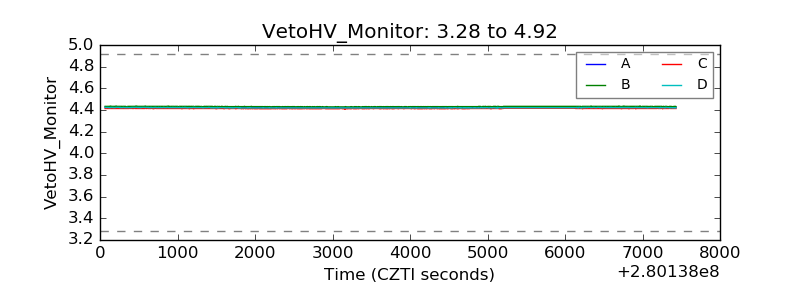 |
| Veto LLD | 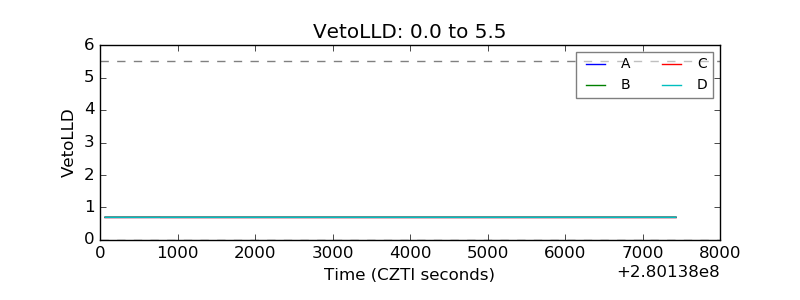 |
| Alpha Counter | 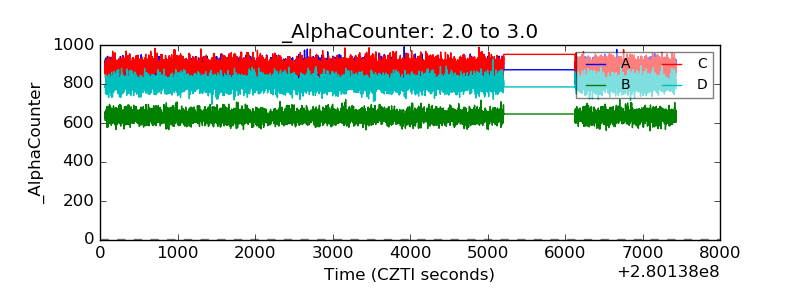 |
| _CPM_Rate |  |
| CZT Counter | 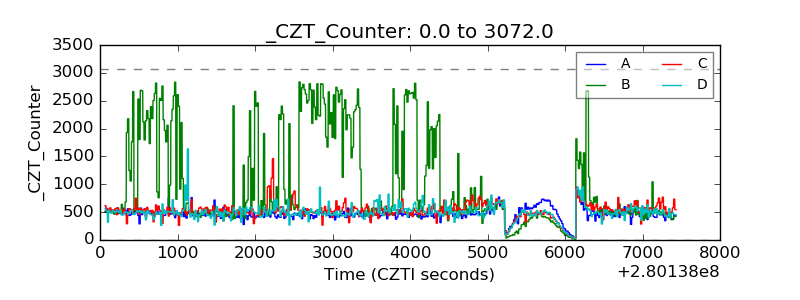 |
| +2.5 Volts monitor |  |
| +5 Volts monitor |  |
| _ROLL_ROT | 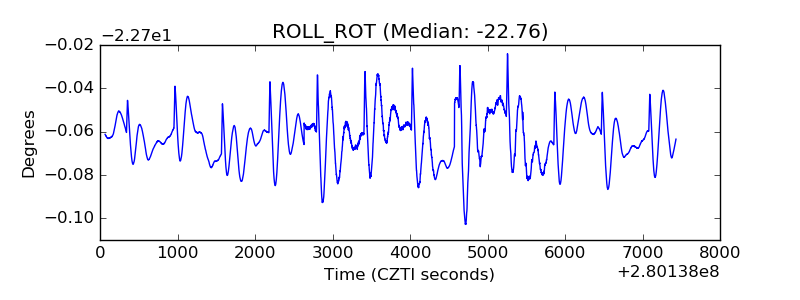 |
| _Roll_DEC | 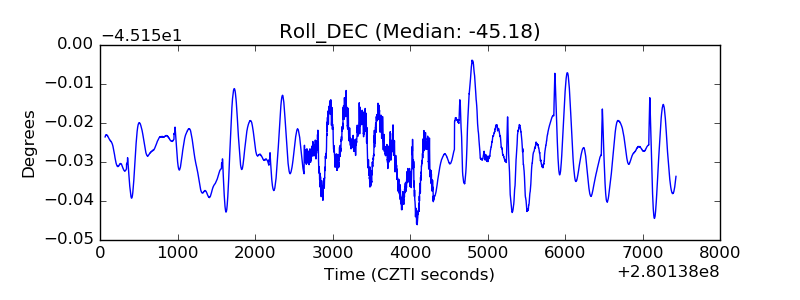 |
| _Roll_RA | 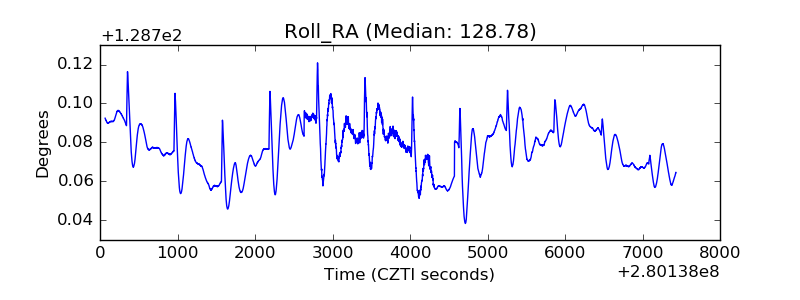 |
| Veto Counter | 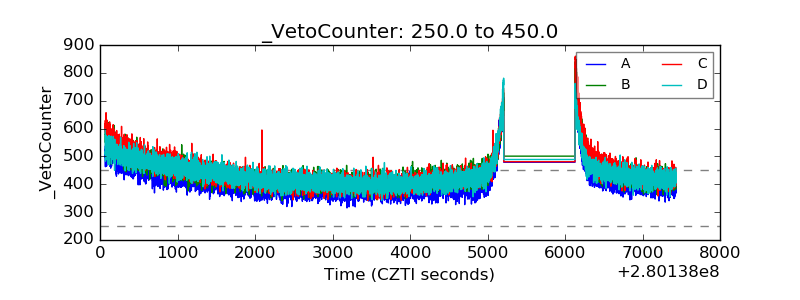 |