| Param | Original file | Final file |
|---|---|---|
| Filename | modeM0/AS1A05_188T01_9000002520_16967cztM0_level2.evt | modeM0/AS1A05_188T01_9000002520_16967cztM0_level2_quad_clean.evt |
| Size (bytes) | 536,425,920 | 81,524,160 |
| Size | 511.6 MB | 77.7 MB |
| Events in quadrant A | 3,214,862 | 503,901 |
| Events in quadrant B | 3,654,552 | 509,323 |
| Events in quadrant C | 3,787,264 | 495,990 |
| Events in quadrant D | 5,124,627 | 482,266 |
| Mode M9 | |||
|---|---|---|---|
| Quadrant | BADHDUFLAG | Total packets | Discarded packets |
| A | 0 | 5 | 0 |
| B | 0 | 5 | 0 |
| C | 0 | 5 | 0 |
| D | 0 | 5 | 0 |
| Mode M0 | |||
|---|---|---|---|
| Quadrant | BADHDUFLAG | Total packets | Discarded packets |
| A | 0 | 14102 | 1 |
| B | 0 | 15090 | 1 |
| C | 0 | 15397 | 1 |
| D | 0 | 19765 | 1 |
| Mode SS | |||
|---|---|---|---|
| Quadrant | BADHDUFLAG | Total packets | Discarded packets |
| A | 0 | 138 | 0 |
| B | 0 | 138 | 0 |
| C | 0 | 138 | 0 |
| D | 0 | 138 | 0 |
| Quadrant | Total seconds | Saturated seconds | Saturation percentage |
|---|---|---|---|
| A | 6846 | 168 | 2.453988% |
| B | 6847 | 218 | 3.183876% |
| C | 6847 | 206 | 3.008617% |
| D | 6847 | 531 | 7.755221% |
Noise dominated data is calculated using 1-second bins in cleaned event files. If a bin has >2000 counts, and if more than 50% of those come from <1% of pixels, then it is considered to be noise-dominated and hence unusable.
| Quadrant | # 1 sec bins | Bins with >0 counts | Bins with >2000 counts | High rate bins dominated by noise | Noise dominated (total time) | Noise dominated (detector-on time) | Marked lightcurve |
|---|---|---|---|---|---|---|---|
| A | 7332 | 6848 | 1 | 1 | 0.01% | 0.01% | 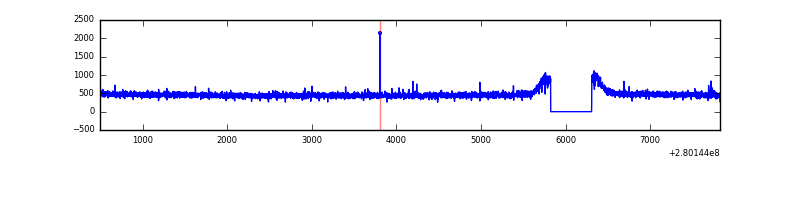 |
| B | 7333 | 6849 | 8 | 8 | 0.11% | 0.12% | 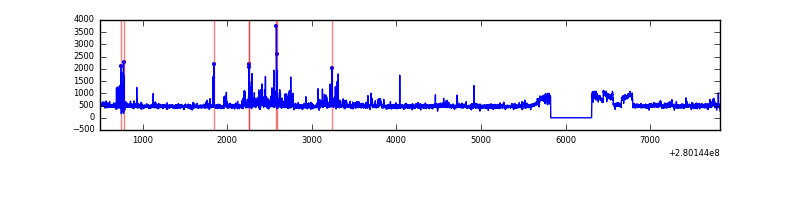 |
| C | 7333 | 6849 | 0 | 0 | 0.00% | 0.00% | 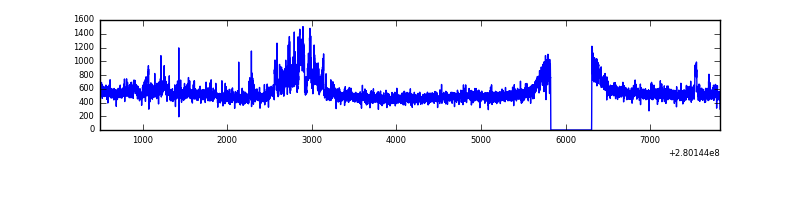 |
| D | 7333 | 6849 | 275 | 275 | 3.75% | 4.02% | 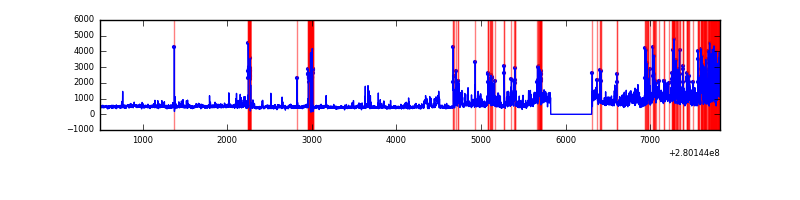 |
Top three noisy pixels from each quadrant. If the there are fewer than three noisy pixels in the level2.evt file, extra rows are filled as -1
| Pixel properties | Quadrant properties | ||||||
|---|---|---|---|---|---|---|---|
| Quadrant | DetID | PixID | Counts | Sigma | Mean | Median | Sigma |
| A | 12 | 189 | 7566 | 39.57 | 833 | 813 | 170.7 |
| A | 0 | 226 | 7400 | 38.6 | 833 | 813 | 170.7 |
| A | 12 | 194 | 6247 | 31.84 | 833 | 813 | 170.7 |
| B | 3 | 64 | 141639 | 887.84 | 828 | 805 | 158.6 |
| B | 7 | 220 | 120232 | 752.88 | 828 | 805 | 158.6 |
| B | 3 | 209 | 36734 | 226.5 | 828 | 805 | 158.6 |
| C | 3 | 233 | 519148 | 2754.22 | 806 | 810 | 188.2 |
| C | 14 | 238 | 123484 | 651.84 | 806 | 810 | 188.2 |
| C | 13 | 61 | 5604 | 25.47 | 806 | 810 | 188.2 |
| D | 1 | 52 | 1767159 | 9030.81 | 800 | 776 | 195.6 |
| D | 10 | 70 | 135802 | 690.33 | 800 | 776 | 195.6 |
| D | 15 | 0 | 118991 | 604.39 | 800 | 776 | 195.6 |
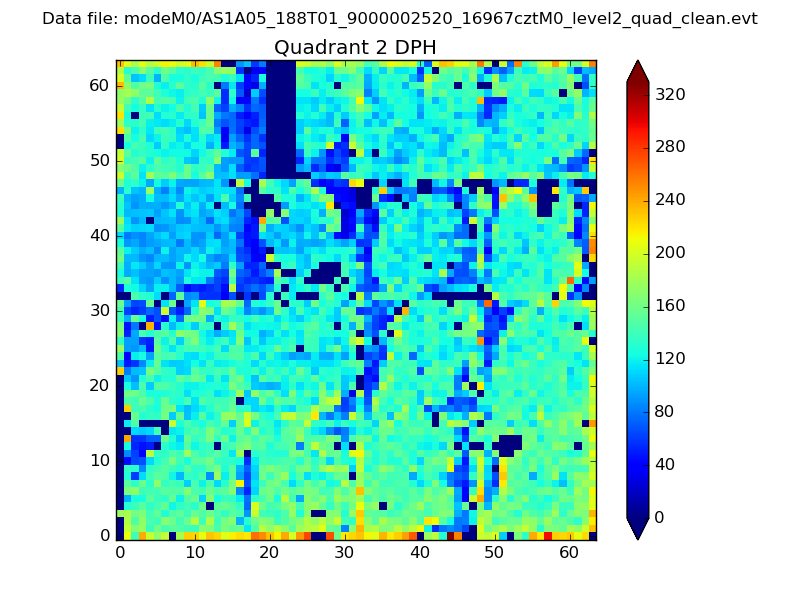
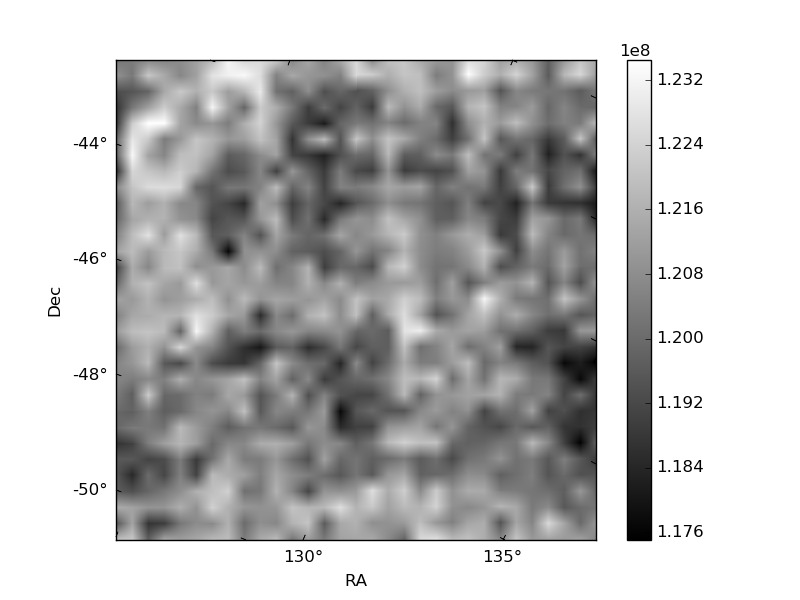
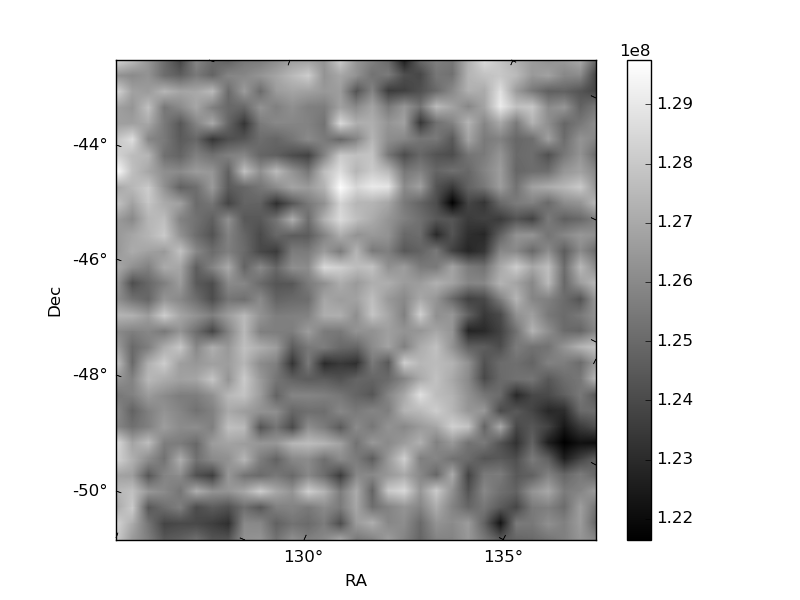
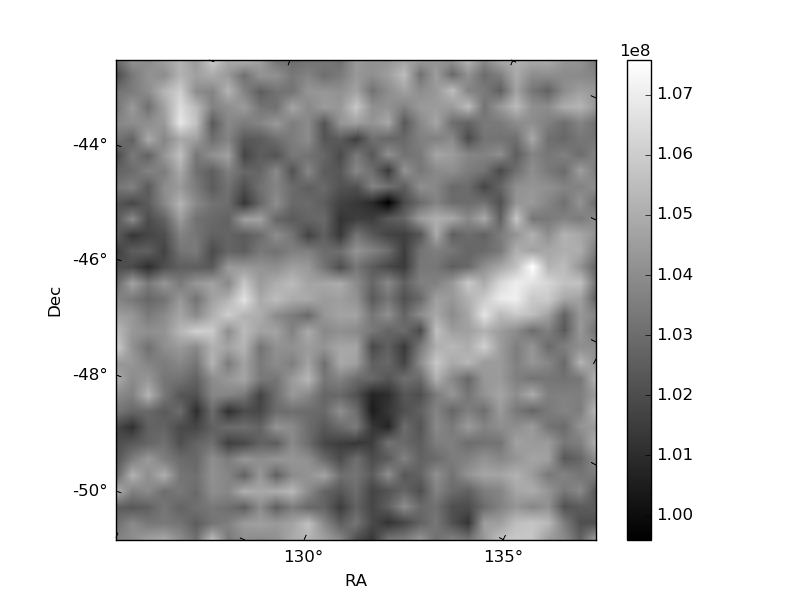
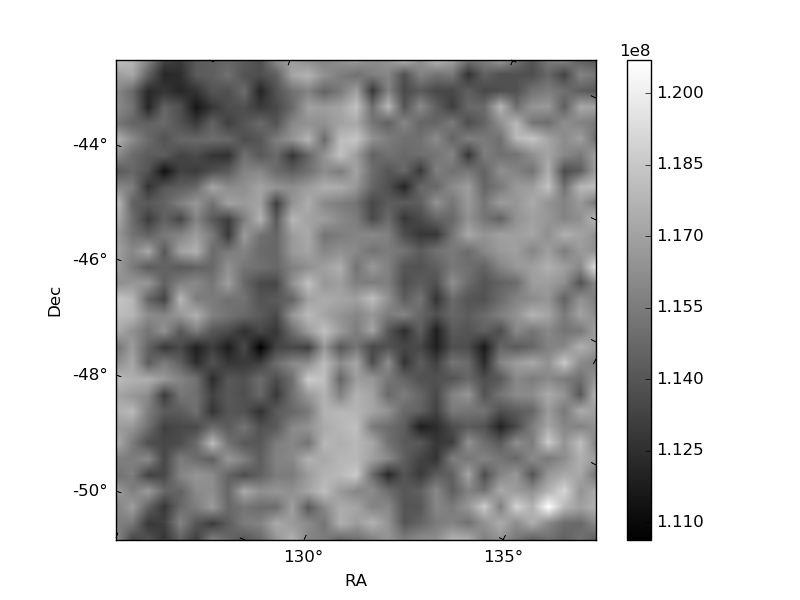
Histogram calculated using DETX and DETY for each event in the final _common_clean file
| Quadrant A |  |
 |
Quadrant B |
|---|---|---|---|
| Quadrant D | 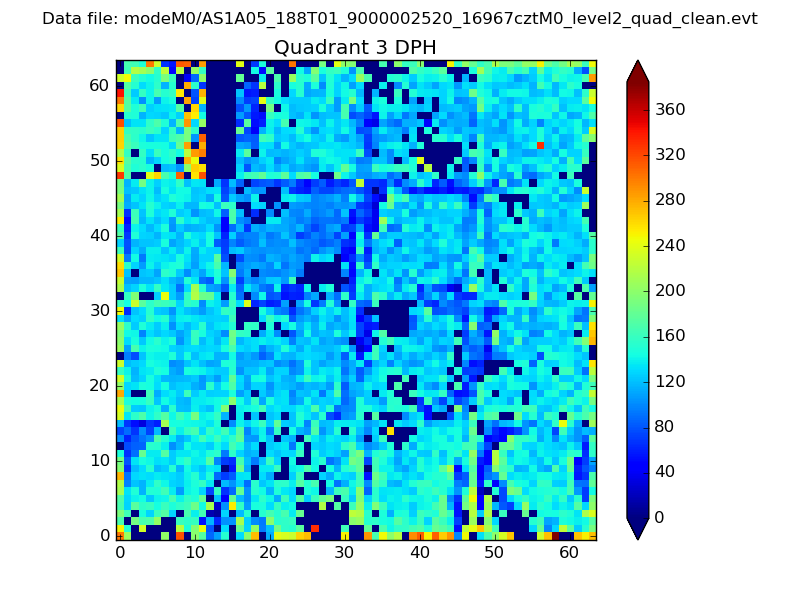 |
 |
Quadrant C |
| Plot type | Count rate plots | Images |
|---|---|---|
| Comparison with Poisson distribution Blue bars denote a histogram of data divided into 1 sec bins. Red curve is a Poisson curve with rate = median count rate of data. |
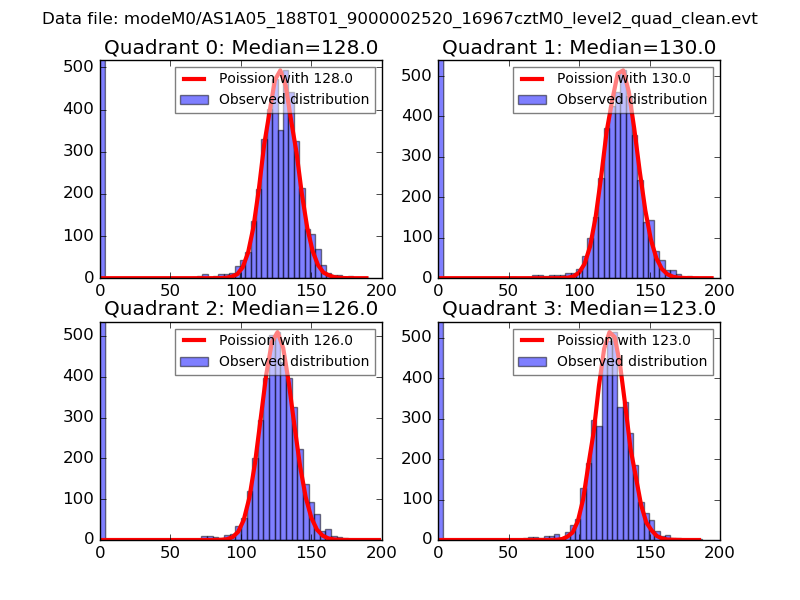 |
 |
| Quadrant-wise count rates Data is divided into 100 sec bins |
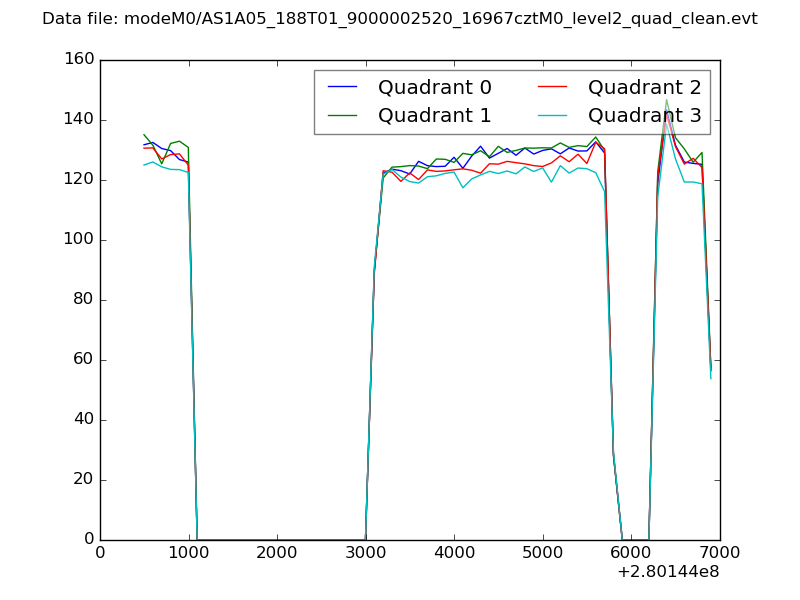 |
|
| Module-wise count rates for Quadrant A Data is divided into 100 sec bins |
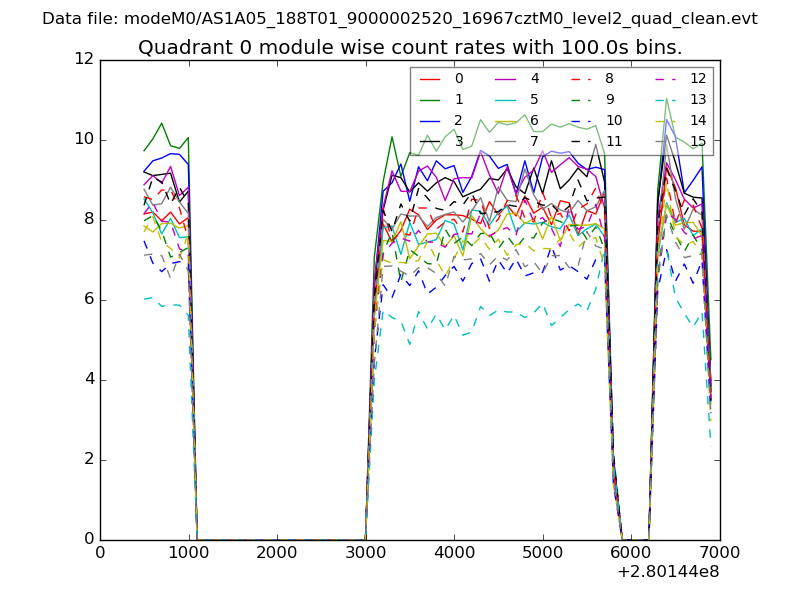 |
 |
| Module-wise count rates for Quadrant B Data is divided into 100 sec bins |
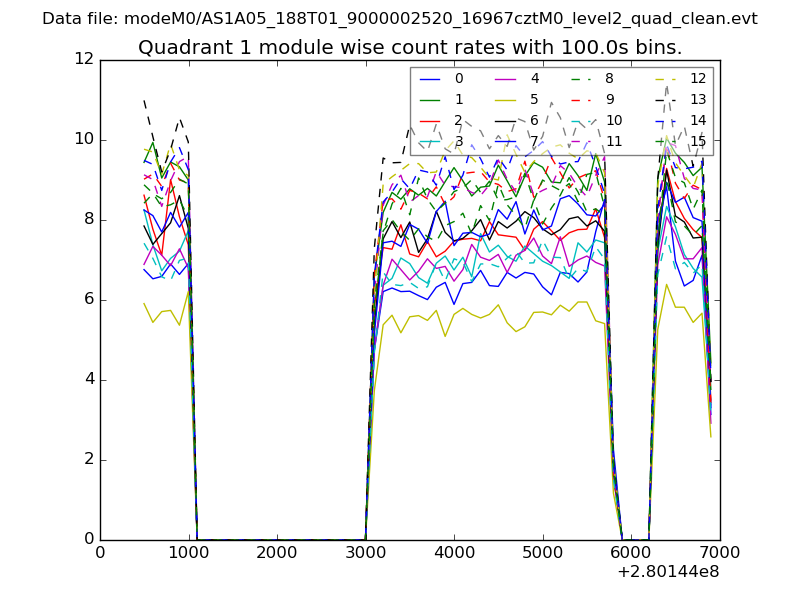 |
 |
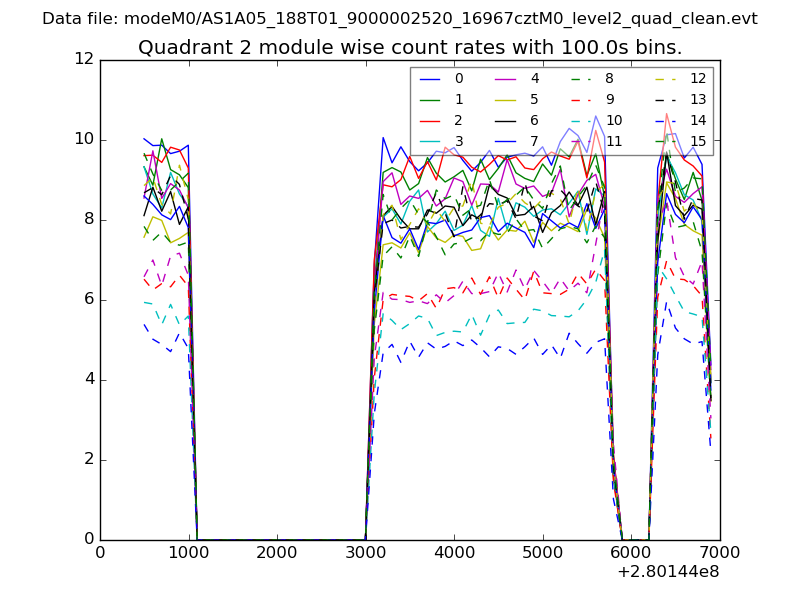
| Module-wise count rates for Quadrant C Data is divided into 100 sec bins |
 |
 |
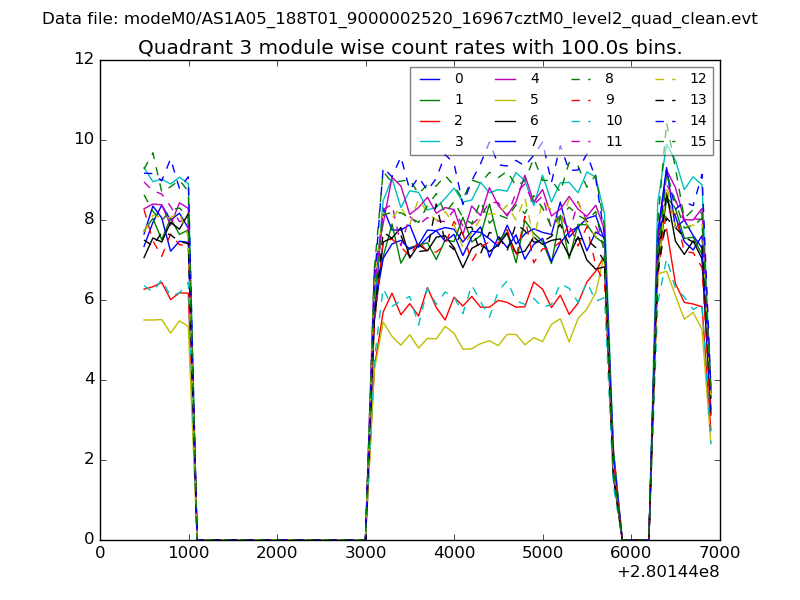
| Module-wise count rates for Quadrant D Data is divided into 100 sec bins |
 |
 |
| Parameter | Plot |
|---|---|
| CZT HV Monitor | 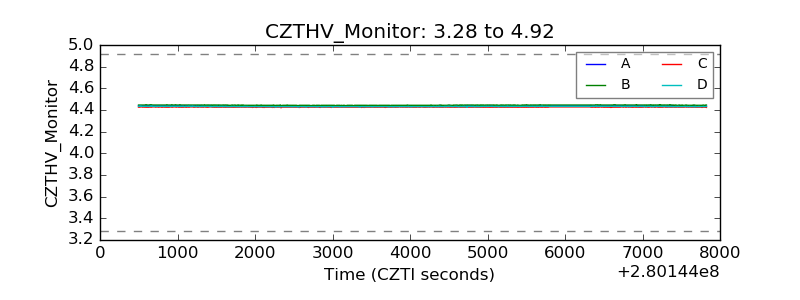 |
| D_VDD | 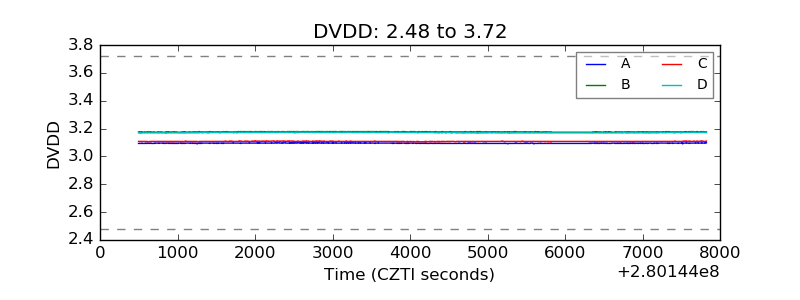 |
| Temperature 1 | 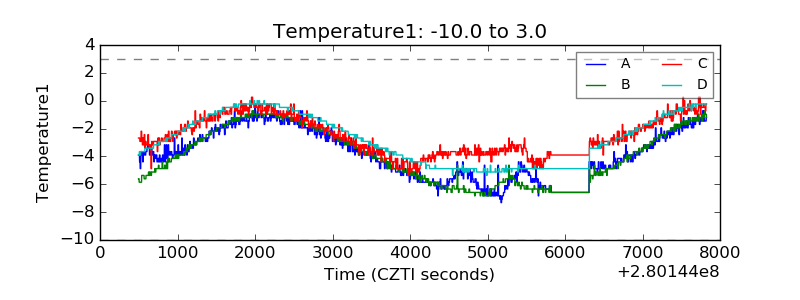 |
| Veto HV Monitor |  |
| Veto LLD | 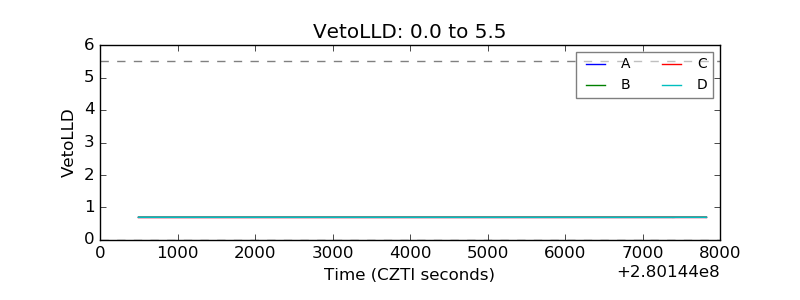 |
| Alpha Counter | 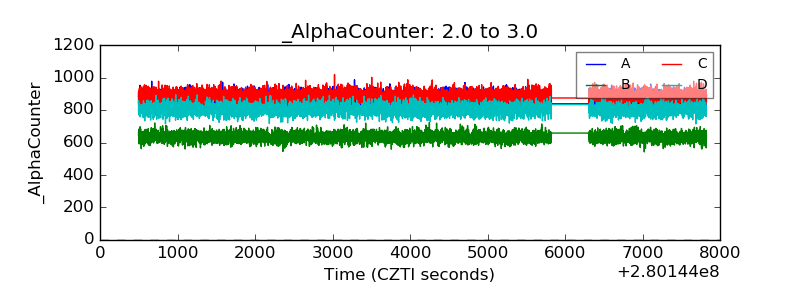 |
| _CPM_Rate |  |
| CZT Counter | 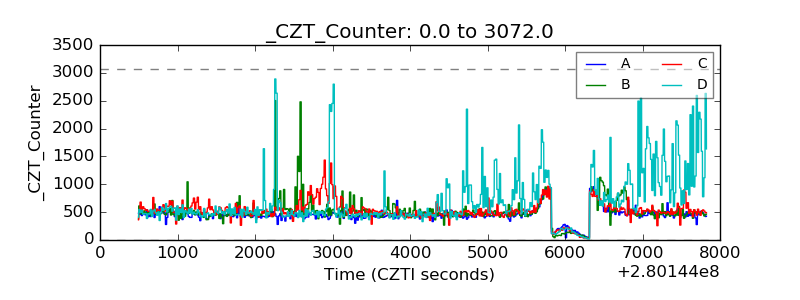 |
| +2.5 Volts monitor |  |
| +5 Volts monitor |  |
| _ROLL_ROT | 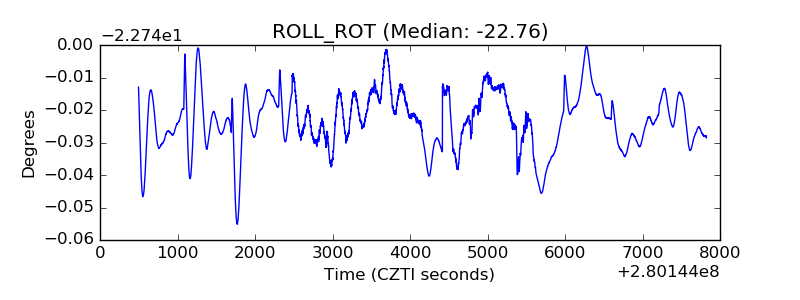 |
| _Roll_DEC |  |
| _Roll_RA | 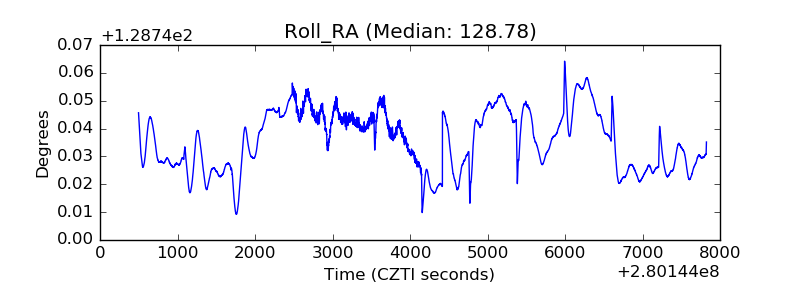 |
| Veto Counter | 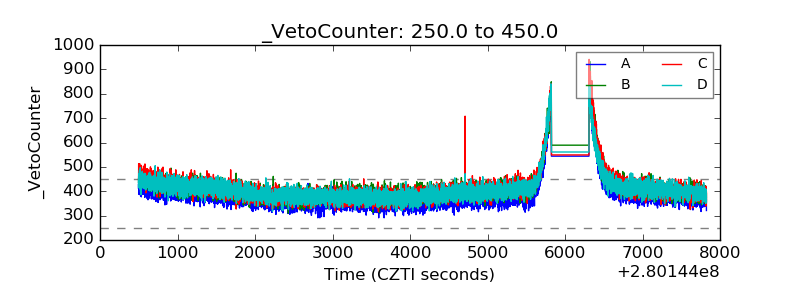 |