| Param | Original file | Final file |
|---|---|---|
| Filename | modeM0/AS1A05_188T01_9000002520_16968cztM0_level2.evt | modeM0/AS1A05_188T01_9000002520_16968cztM0_level2_quad_clean.evt |
| Size (bytes) | 791,605,440 | 87,747,840 |
| Size | 754.9 MB | 83.7 MB |
| Events in quadrant A | 3,802,133 | 545,567 |
| Events in quadrant B | 4,609,625 | 549,759 |
| Events in quadrant C | 4,215,448 | 535,549 |
| Events in quadrant D | 10,806,333 | 469,956 |
| Mode M9 | |||
|---|---|---|---|
| Quadrant | BADHDUFLAG | Total packets | Discarded packets |
| A | 1 | 273359709408 | 0 |
| B | 1 | -1 | -1 |
| C | 1 | -1 | -1 |
| D | 1 | -1 | -1 |
| Mode M0 | |||
|---|---|---|---|
| Quadrant | BADHDUFLAG | Total packets | Discarded packets |
| A | 0 | 16723 | 3 |
| B | 0 | 18750 | 3 |
| C | 0 | 17460 | 4 |
| D | 0 | 37666 | 3 |
| Mode SS | |||
|---|---|---|---|
| Quadrant | BADHDUFLAG | Total packets | Discarded packets |
| A | 0 | 162 | 0 |
| B | 0 | 162 | 0 |
| C | 0 | 162 | 0 |
| D | 0 | 162 | 0 |
| Quadrant | Total seconds | Saturated seconds | Saturation percentage |
|---|---|---|---|
| A | 7985 | 268 | 3.356293% |
| B | 7985 | 345 | 4.320601% |
| C | 7984 | 293 | 3.669840% |
| D | 7984 | 1963 | 24.586673% |
Noise dominated data is calculated using 1-second bins in cleaned event files. If a bin has >2000 counts, and if more than 50% of those come from <1% of pixels, then it is considered to be noise-dominated and hence unusable.
| Quadrant | # 1 sec bins | Bins with >0 counts | Bins with >2000 counts | High rate bins dominated by noise | Noise dominated (total time) | Noise dominated (detector-on time) | Marked lightcurve |
|---|---|---|---|---|---|---|---|
| A | 8141 | 7988 | 0 | 0 | 0.00% | 0.00% | 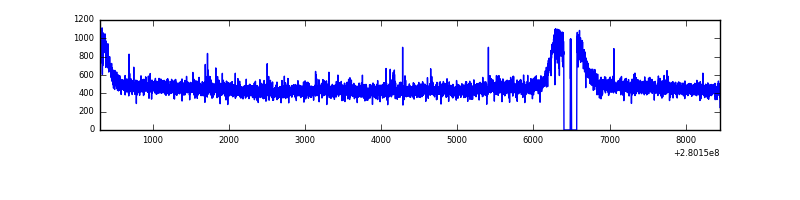 |
| B | 8141 | 7988 | 14 | 14 | 0.17% | 0.18% | 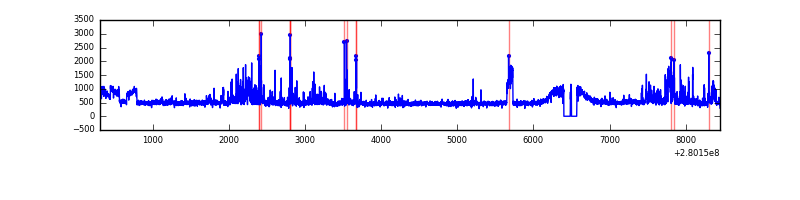 |
| C | 8140 | 7987 | 0 | 0 | 0.00% | 0.00% | 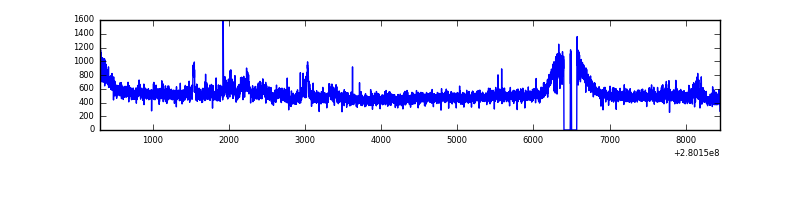 |
| D | 8140 | 7986 | 1392 | 1392 | 17.10% | 17.43% | 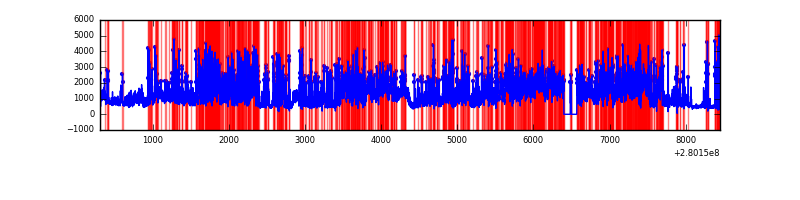 |
Top three noisy pixels from each quadrant. If the there are fewer than three noisy pixels in the level2.evt file, extra rows are filled as -1
| Pixel properties | Quadrant properties | ||||||
|---|---|---|---|---|---|---|---|
| Quadrant | DetID | PixID | Counts | Sigma | Mean | Median | Sigma |
| A | 12 | 189 | 9684 | 43.38 | 986 | 962 | 201.1 |
| A | 0 | 226 | 8797 | 38.96 | 986 | 962 | 201.1 |
| A | 12 | 194 | 7278 | 31.41 | 986 | 962 | 201.1 |
| B | 3 | 64 | 216132 | 1118.61 | 982 | 954 | 192.4 |
| B | 7 | 220 | 128948 | 665.38 | 982 | 954 | 192.4 |
| B | 15 | 35 | 123506 | 637.09 | 982 | 954 | 192.4 |
| C | 3 | 233 | 346699 | 1539.79 | 952 | 958 | 224.5 |
| C | 14 | 238 | 143830 | 636.29 | 952 | 958 | 224.5 |
| C | 0 | 207 | 11126 | 45.28 | 952 | 958 | 224.5 |
| D | 1 | 52 | 7262988 | 33876.52 | 880 | 853 | 214.4 |
| D | 15 | 145 | 59029 | 271.38 | 880 | 853 | 214.4 |
| D | 10 | 70 | 39909 | 182.19 | 880 | 853 | 214.4 |
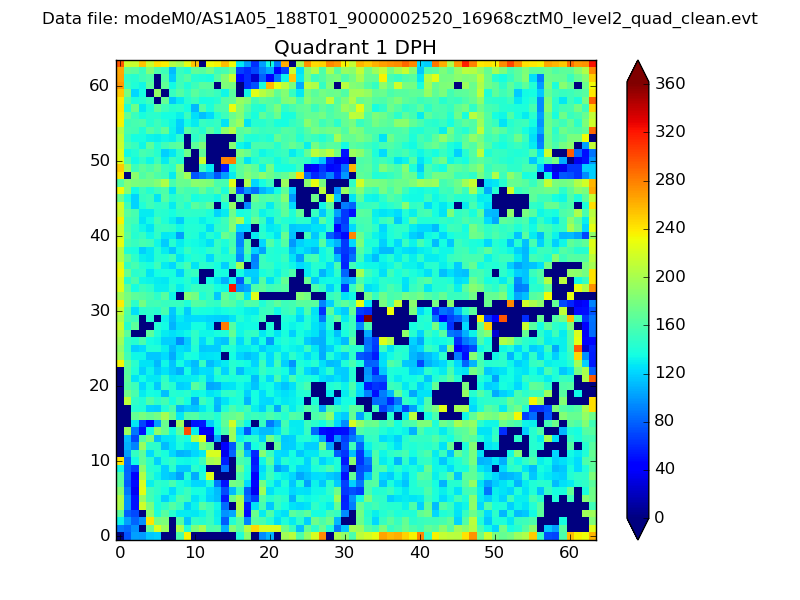
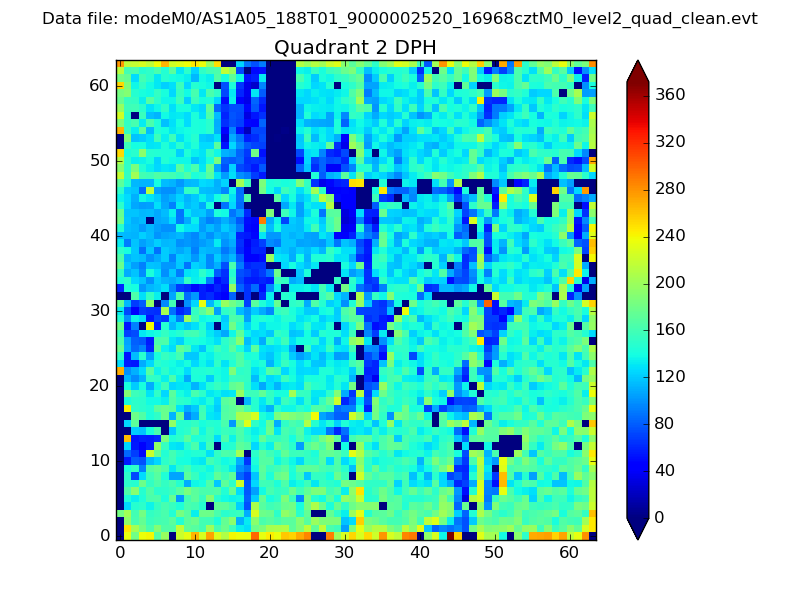
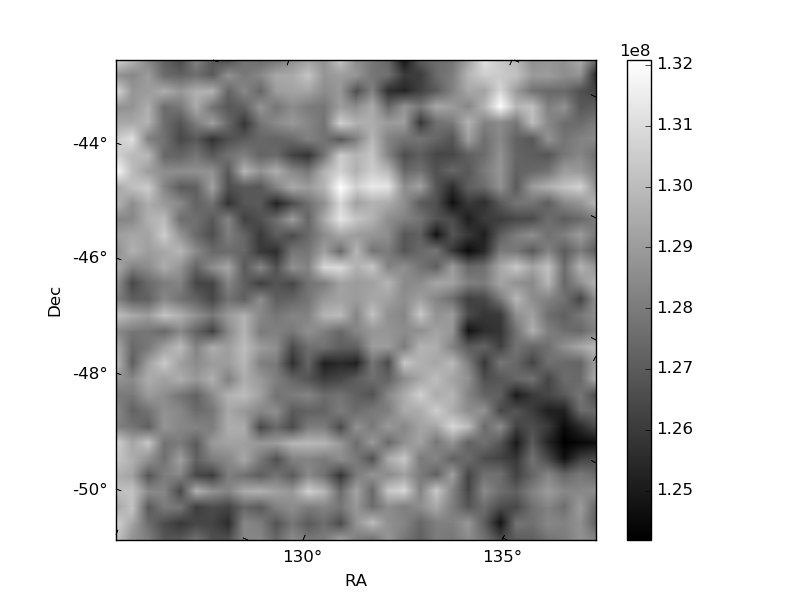
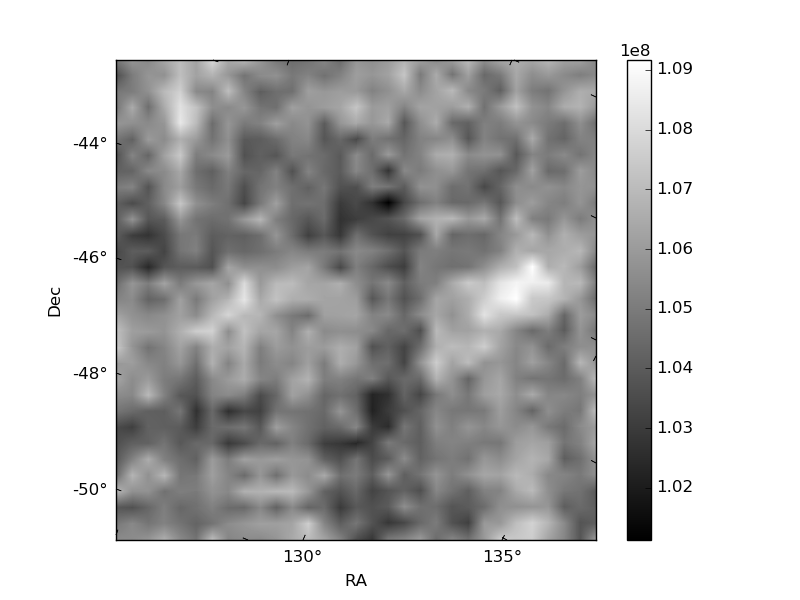
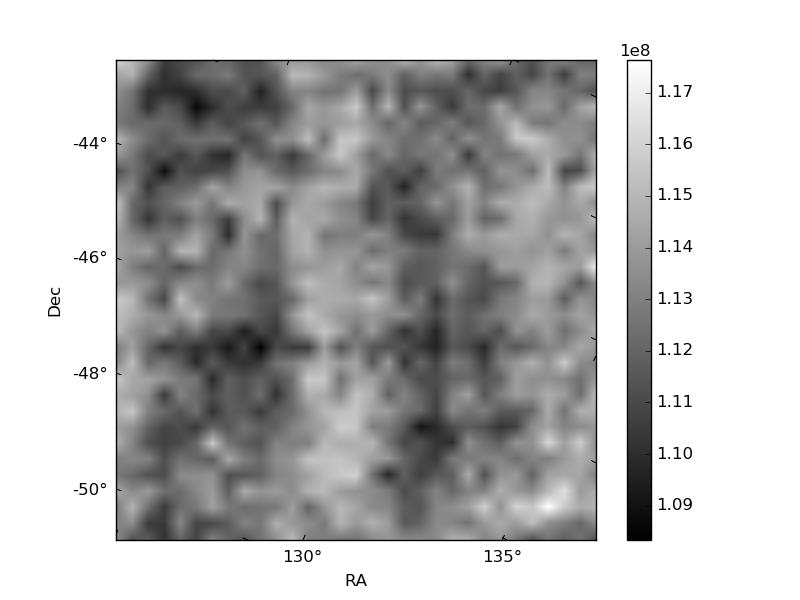
Histogram calculated using DETX and DETY for each event in the final _common_clean file
| Quadrant A |  |
 |
Quadrant B |
|---|---|---|---|
| Quadrant D | 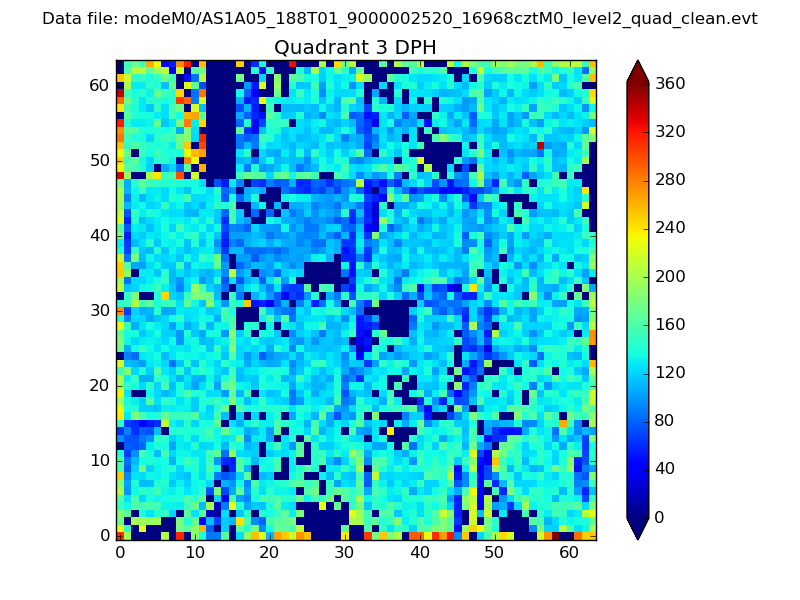 |
 |
Quadrant C |
| Plot type | Count rate plots | Images |
|---|---|---|
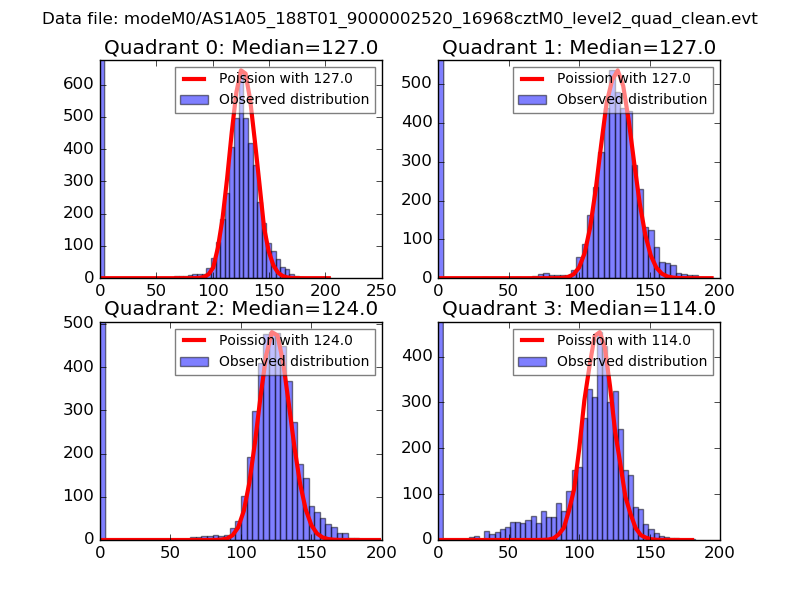
| Comparison with Poisson distribution Blue bars denote a histogram of data divided into 1 sec bins. Red curve is a Poisson curve with rate = median count rate of data. |
 |
 |
| Quadrant-wise count rates Data is divided into 100 sec bins |
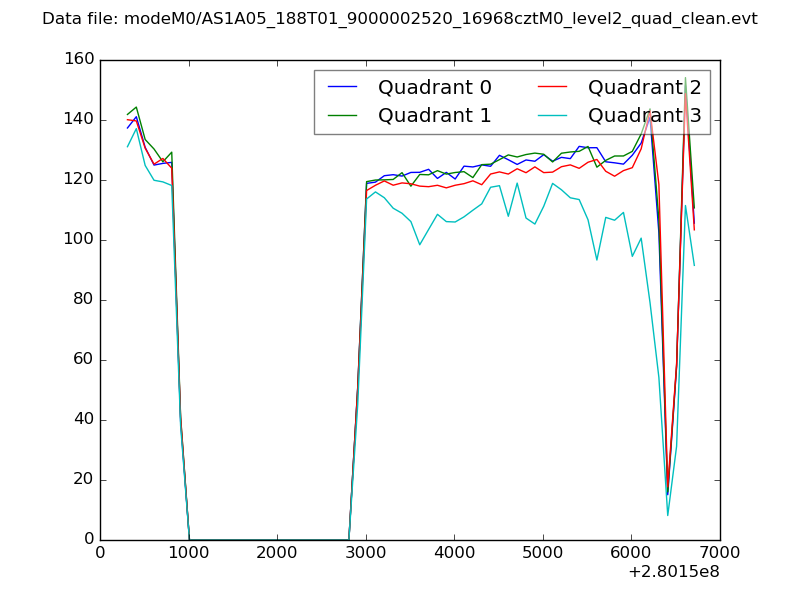 |
|
| Module-wise count rates for Quadrant A Data is divided into 100 sec bins |
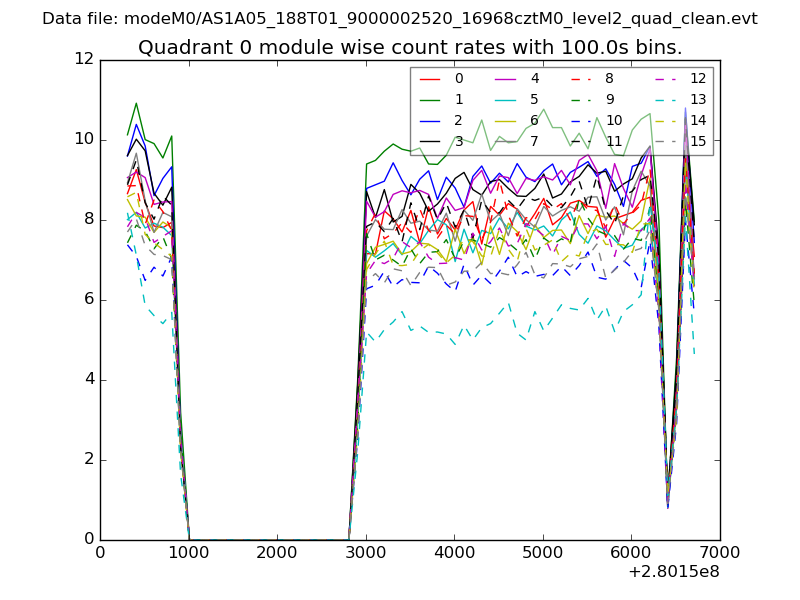 |
 |
| Module-wise count rates for Quadrant B Data is divided into 100 sec bins |
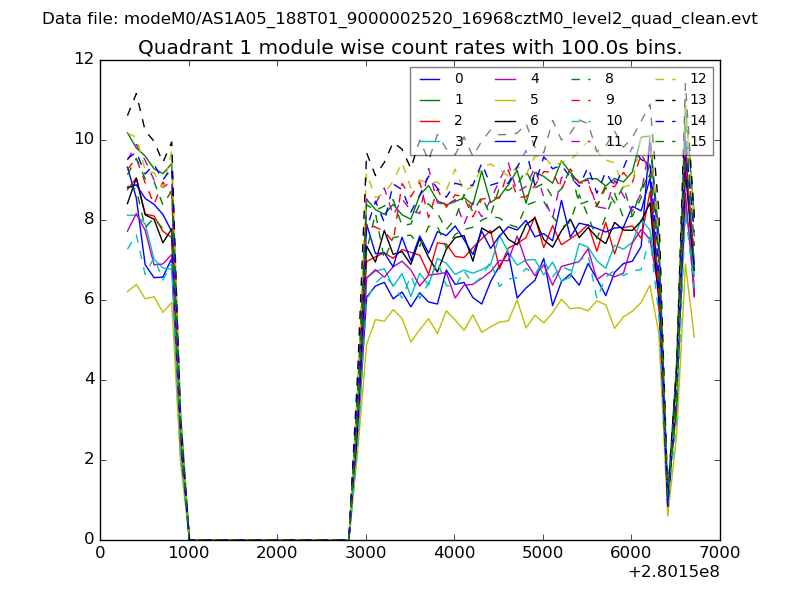 |
 |
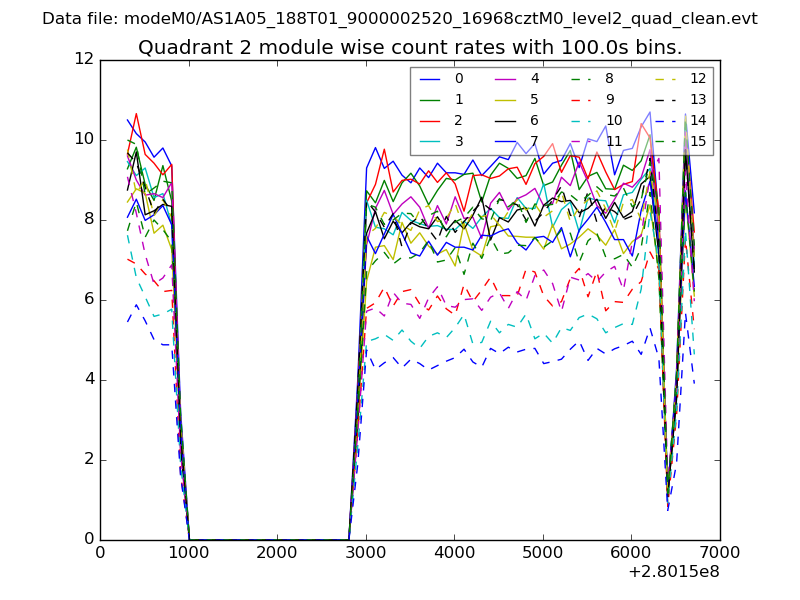
| Module-wise count rates for Quadrant C Data is divided into 100 sec bins |
 |
 |
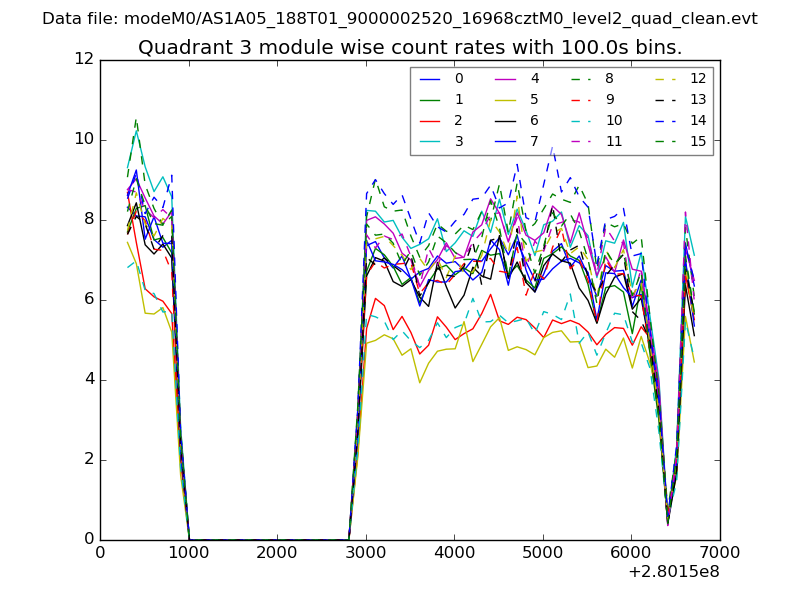
| Module-wise count rates for Quadrant D Data is divided into 100 sec bins |
 |
 |
| Parameter | Plot |
|---|---|
| CZT HV Monitor | 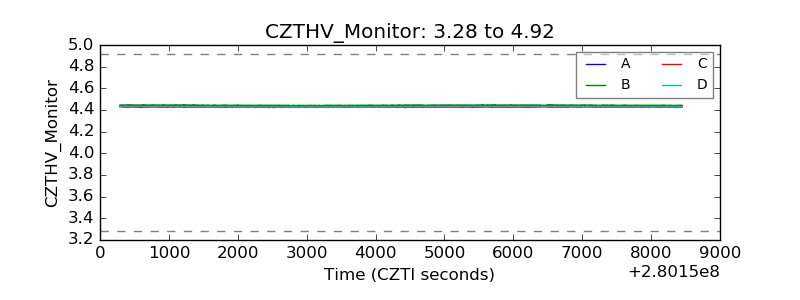 |
| D_VDD | 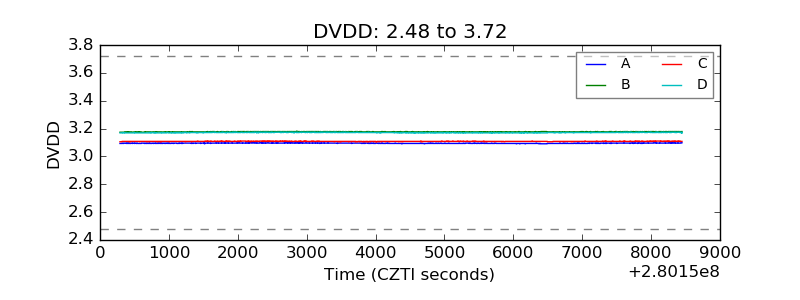 |
| Temperature 1 | 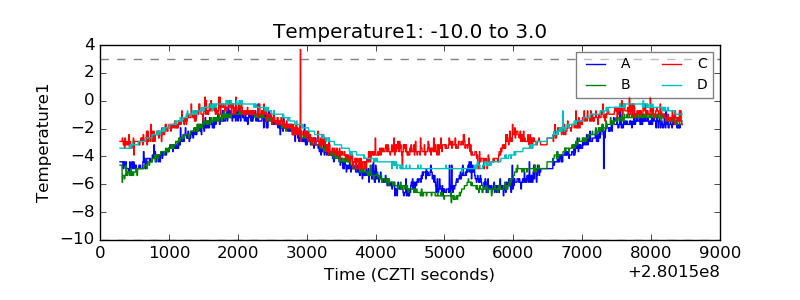 |
| Veto HV Monitor | 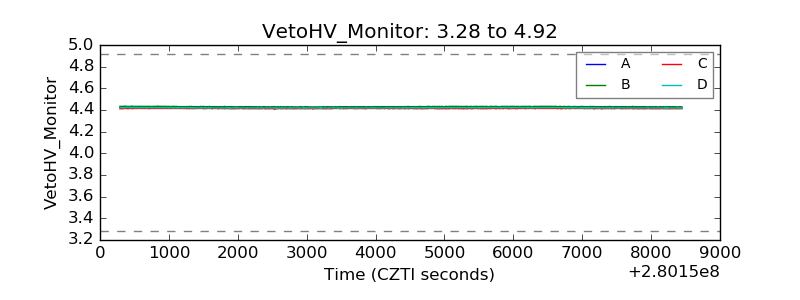 |
| Veto LLD | 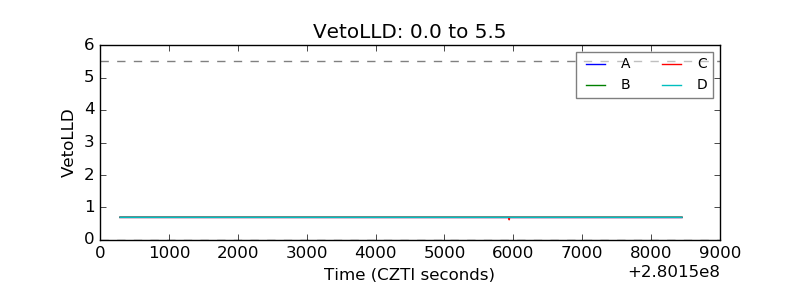 |
| Alpha Counter | 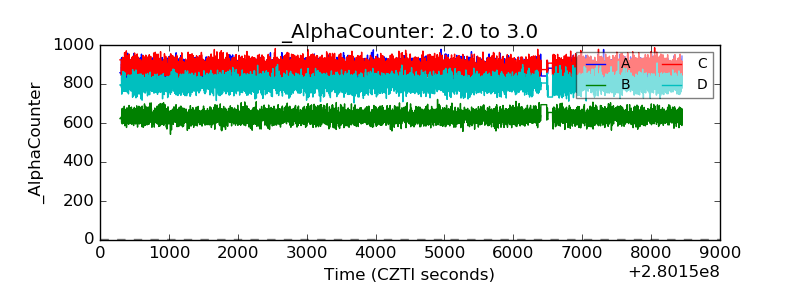 |
| _CPM_Rate | 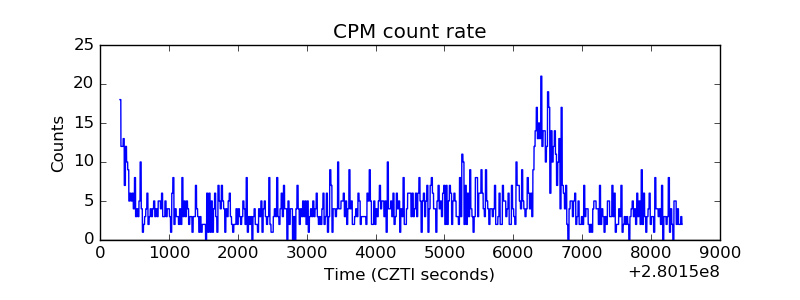 |
| CZT Counter | 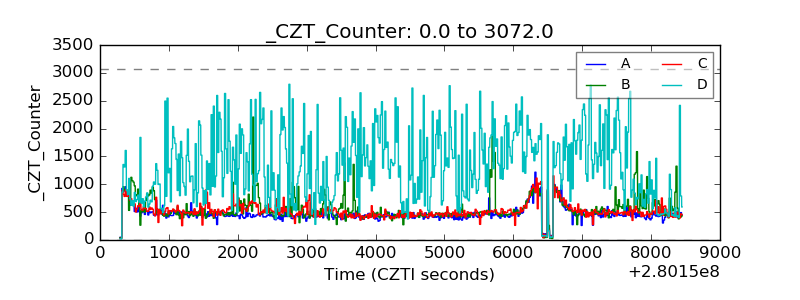 |
| +2.5 Volts monitor |  |
| +5 Volts monitor |  |
| _ROLL_ROT | 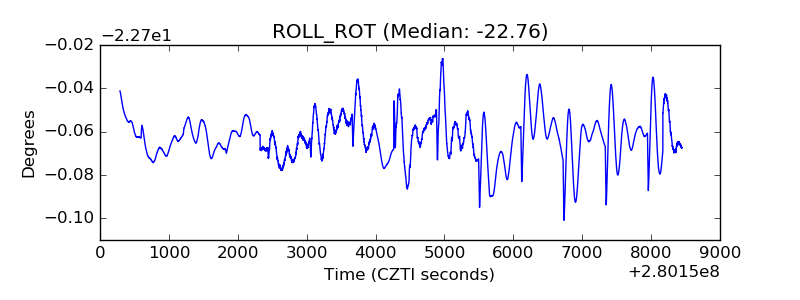 |
| _Roll_DEC | 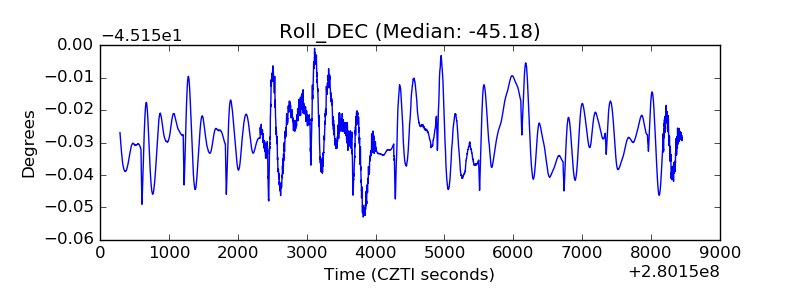 |
| _Roll_RA | 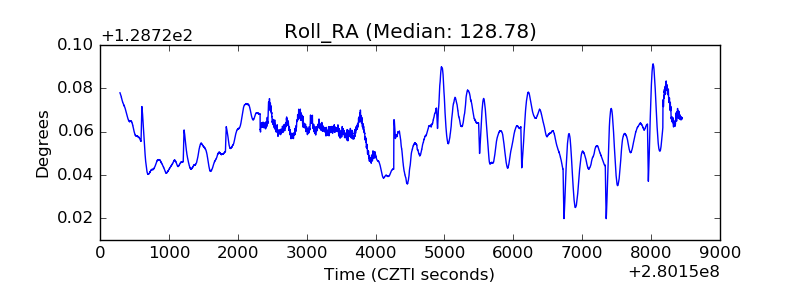 |
| Veto Counter | 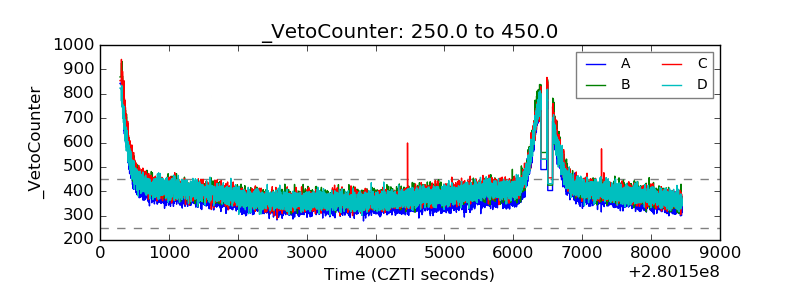 |