| Param | Original file | Final file |
|---|---|---|
| Filename | modeM0/AS1A05_188T01_9000002520_16969cztM0_level2.evt | modeM0/AS1A05_188T01_9000002520_16969cztM0_level2_quad_clean.evt |
| Size (bytes) | 689,783,040 | 72,440,640 |
| Size | 657.8 MB | 69.1 MB |
| Events in quadrant A | 3,244,606 | 475,971 |
| Events in quadrant B | 4,373,585 | 477,082 |
| Events in quadrant C | 3,700,714 | 462,804 |
| Events in quadrant D | 9,091,587 | 284,138 |
| Mode M9 | |||
|---|---|---|---|
| Quadrant | BADHDUFLAG | Total packets | Discarded packets |
| A | 0 | 3 | 0 |
| B | 0 | 3 | 0 |
| C | 0 | 3 | 0 |
| D | 0 | 3 | 0 |
| Mode M0 | |||
|---|---|---|---|
| Quadrant | BADHDUFLAG | Total packets | Discarded packets |
| A | 0 | 14505 | 1 |
| B | 0 | 17534 | 4 |
| C | 0 | 15554 | 1 |
| D | 0 | 31927 | 1 |
| Mode SS | |||
|---|---|---|---|
| Quadrant | BADHDUFLAG | Total packets | Discarded packets |
| A | 0 | 144 | 0 |
| B | 0 | 144 | 0 |
| C | 0 | 144 | 0 |
| D | 0 | 144 | 0 |
| Quadrant | Total seconds | Saturated seconds | Saturation percentage |
|---|---|---|---|
| A | 7070 | 111 | 1.570014% |
| B | 7070 | 286 | 4.045262% |
| C | 7070 | 146 | 2.065064% |
| D | 7070 | 2956 | 41.810467% |
Noise dominated data is calculated using 1-second bins in cleaned event files. If a bin has >2000 counts, and if more than 50% of those come from <1% of pixels, then it is considered to be noise-dominated and hence unusable.
| Quadrant | # 1 sec bins | Bins with >0 counts | Bins with >2000 counts | High rate bins dominated by noise | Noise dominated (total time) | Noise dominated (detector-on time) | Marked lightcurve |
|---|---|---|---|---|---|---|---|
| A | 7346 | 7072 | 0 | 0 | 0.00% | 0.00% | 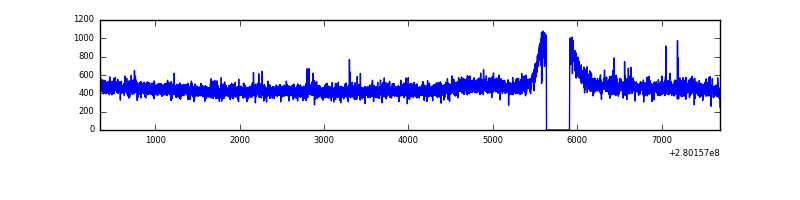 |
| B | 7346 | 7072 | 93 | 93 | 1.27% | 1.32% | 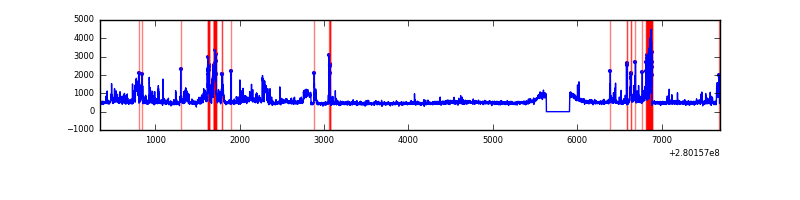 |
| C | 7346 | 7072 | 0 | 0 | 0.00% | 0.00% | 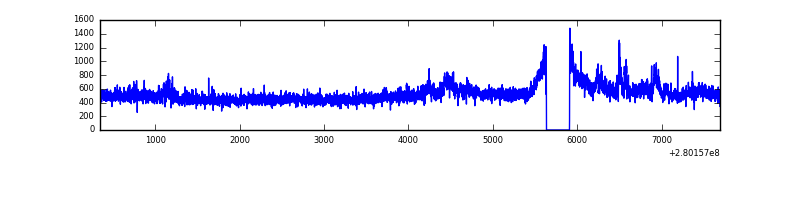 |
| D | 7346 | 7071 | 1614 | 1614 | 21.97% | 22.83% | 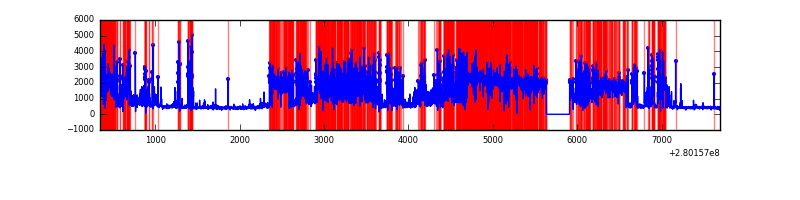 |
Top three noisy pixels from each quadrant. If the there are fewer than three noisy pixels in the level2.evt file, extra rows are filled as -1
| Pixel properties | Quadrant properties | ||||||
|---|---|---|---|---|---|---|---|
| Quadrant | DetID | PixID | Counts | Sigma | Mean | Median | Sigma |
| A | 12 | 189 | 10672 | 57.44 | 840 | 820 | 171.5 |
| A | 0 | 226 | 7547 | 39.22 | 840 | 820 | 171.5 |
| A | 12 | 194 | 6266 | 31.75 | 840 | 820 | 171.5 |
| B | 3 | 64 | 415308 | 2581.47 | 834 | 813 | 160.6 |
| B | 15 | 35 | 313246 | 1945.83 | 834 | 813 | 160.6 |
| B | 7 | 220 | 67782 | 417.08 | 834 | 813 | 160.6 |
| C | 3 | 233 | 410530 | 2137.69 | 809 | 814 | 191.7 |
| C | 14 | 238 | 122771 | 636.31 | 809 | 814 | 191.7 |
| C | 0 | 207 | 12456 | 60.74 | 809 | 814 | 191.7 |
| D | 1 | 52 | 6697528 | 47696.56 | 576 | 559 | 140.4 |
| D | 2 | 152 | 52065 | 366.83 | 576 | 559 | 140.4 |
| D | 10 | 70 | 44348 | 311.87 | 576 | 559 | 140.4 |
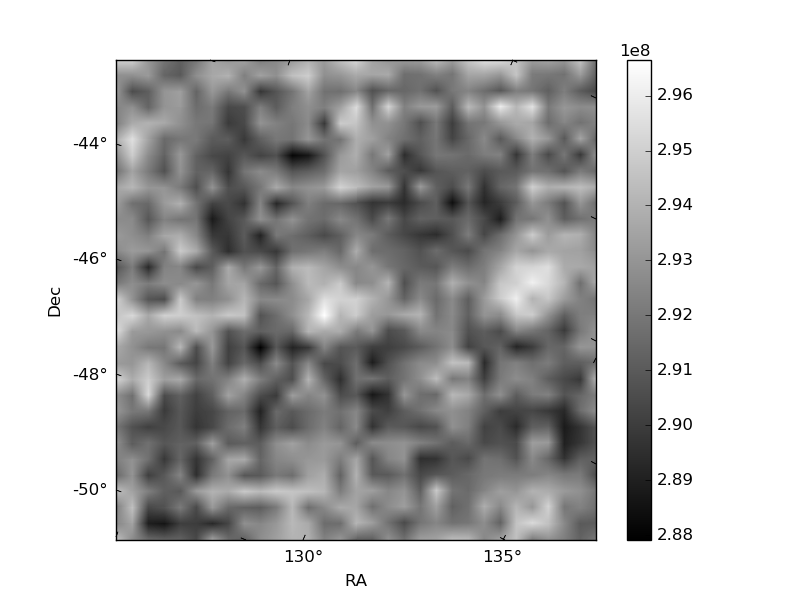
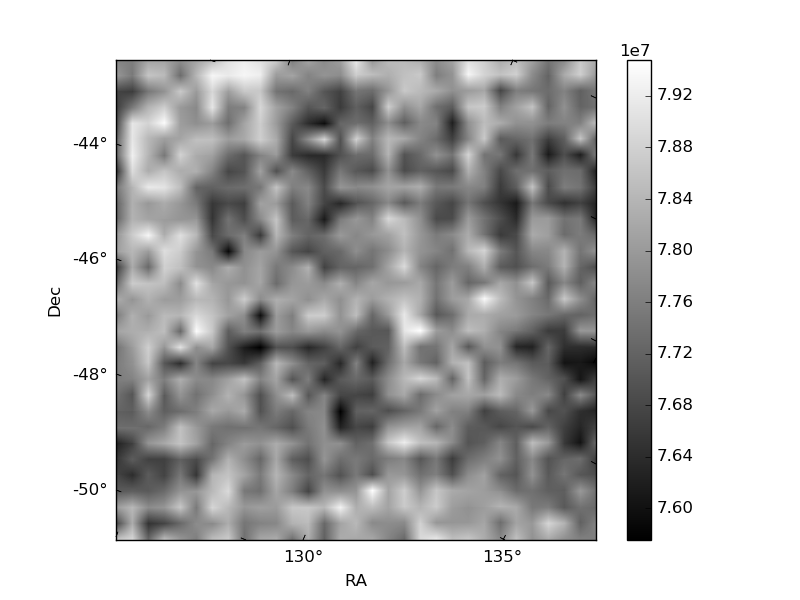
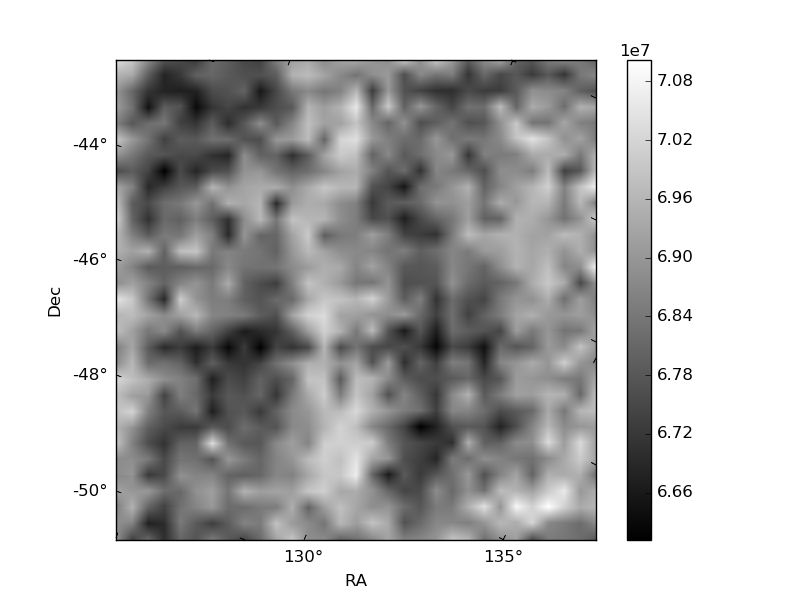
Histogram calculated using DETX and DETY for each event in the final _common_clean file
| Quadrant A | 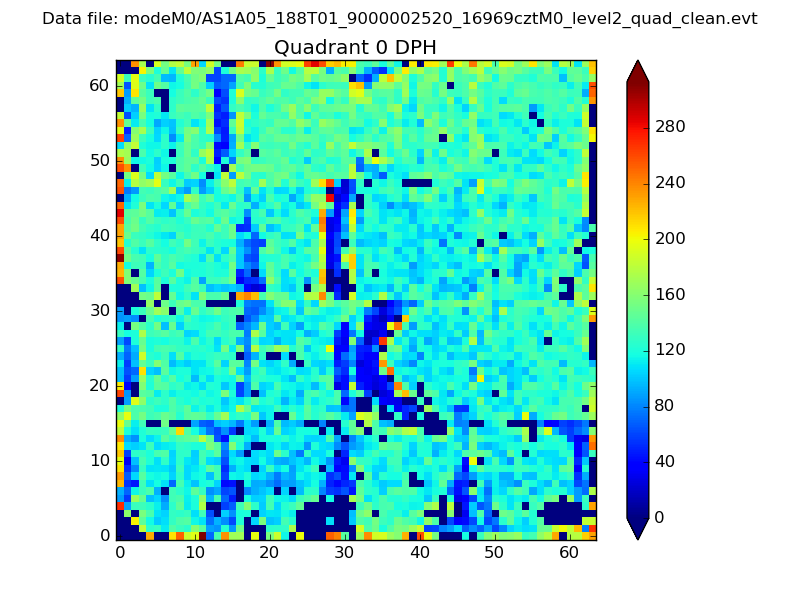 |
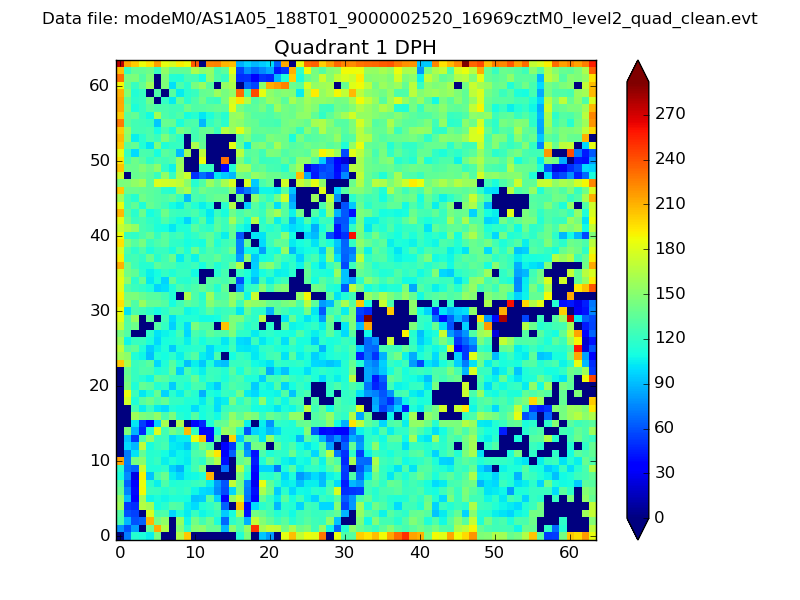 |
Quadrant B |
|---|---|---|---|
| Quadrant D | 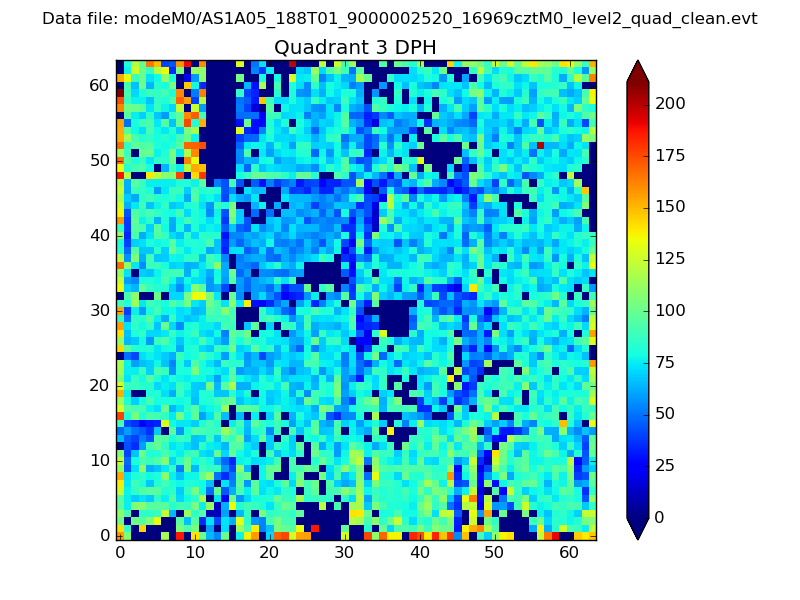 |
 |
Quadrant C |
| Plot type | Count rate plots | Images |
|---|---|---|
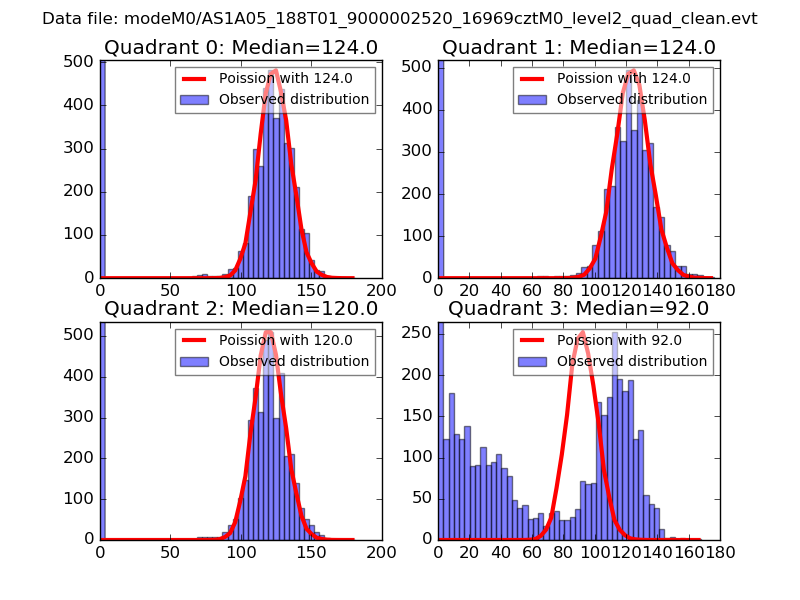
| Comparison with Poisson distribution Blue bars denote a histogram of data divided into 1 sec bins. Red curve is a Poisson curve with rate = median count rate of data. |
 |
 |
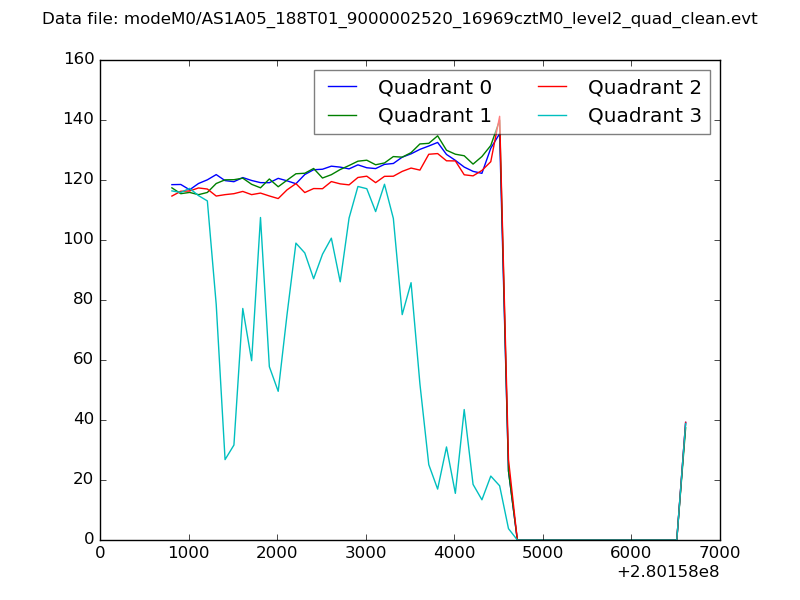
| Quadrant-wise count rates Data is divided into 100 sec bins |
 |
|
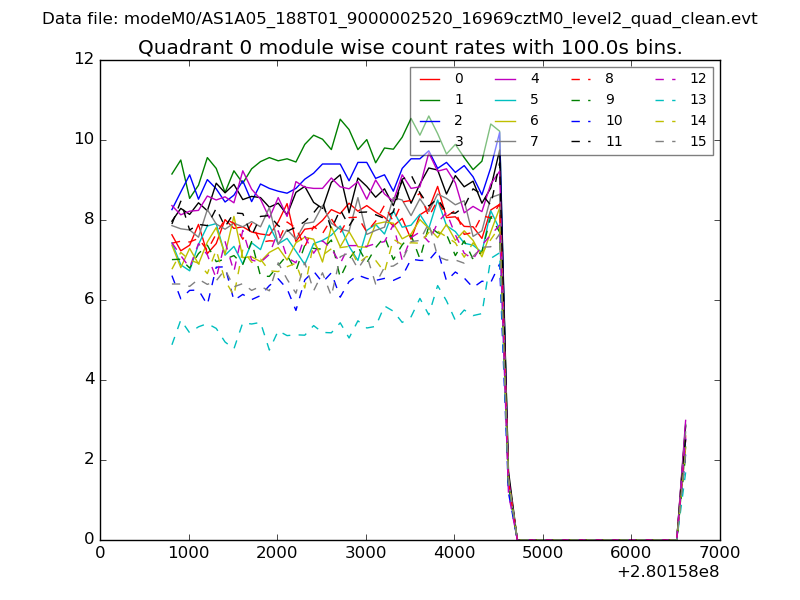
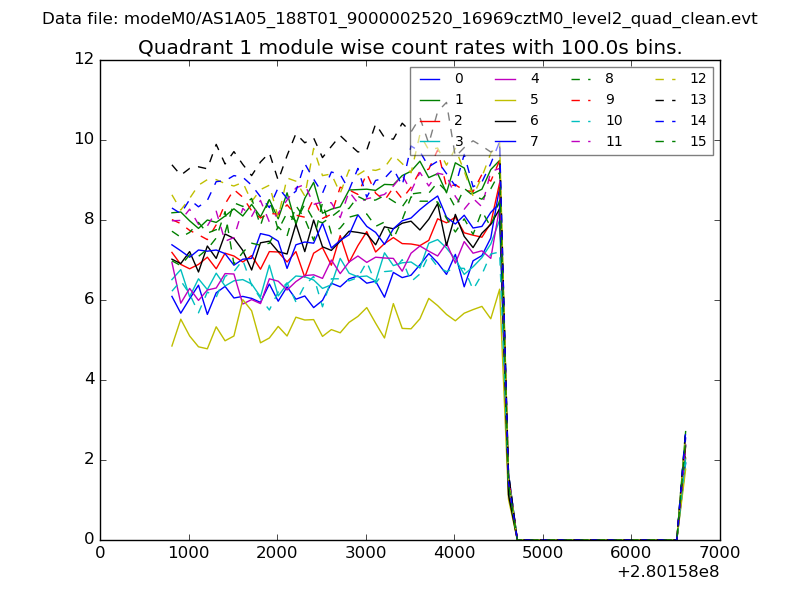
| Module-wise count rates for Quadrant A Data is divided into 100 sec bins |
 |
 |
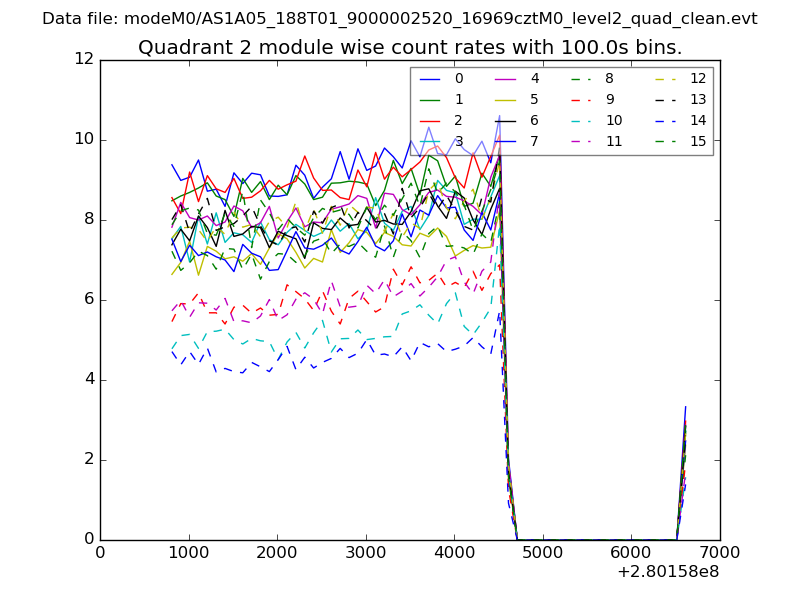
| Module-wise count rates for Quadrant B Data is divided into 100 sec bins |
 |
 |
| Module-wise count rates for Quadrant C Data is divided into 100 sec bins |
 |
 |
| Module-wise count rates for Quadrant D Data is divided into 100 sec bins |
 |
 |
| Parameter | Plot |
|---|---|
| CZT HV Monitor | 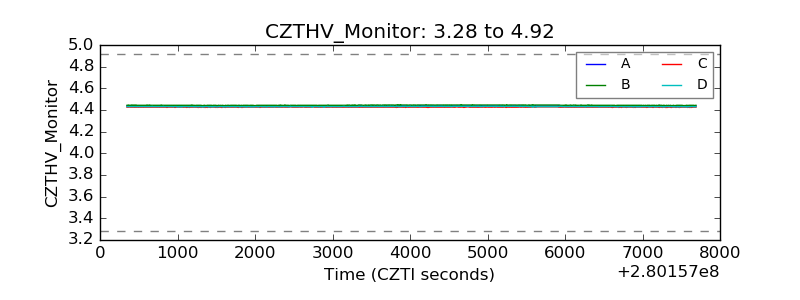 |
| D_VDD | 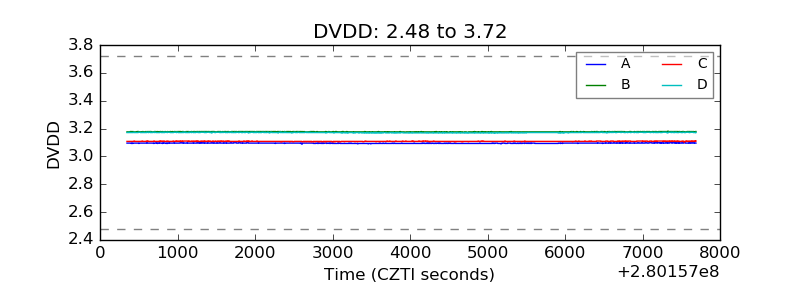 |
| Temperature 1 | 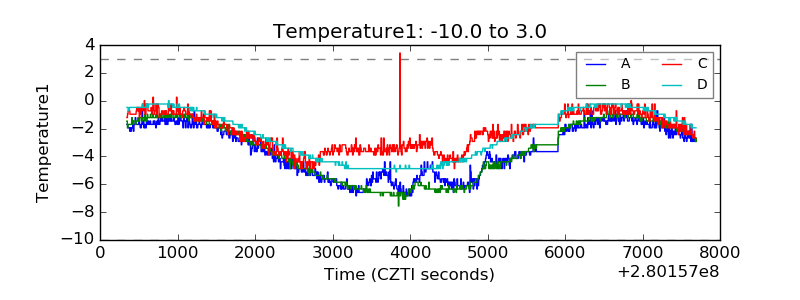 |
| Veto HV Monitor | 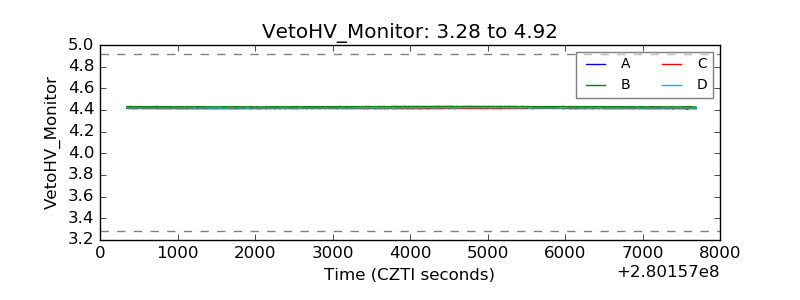 |
| Veto LLD | 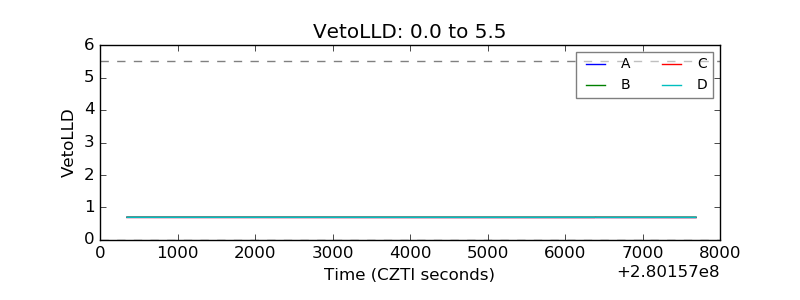 |
| Alpha Counter | 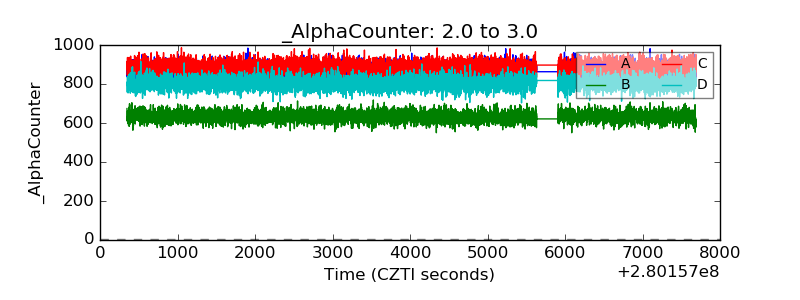 |
| _CPM_Rate | 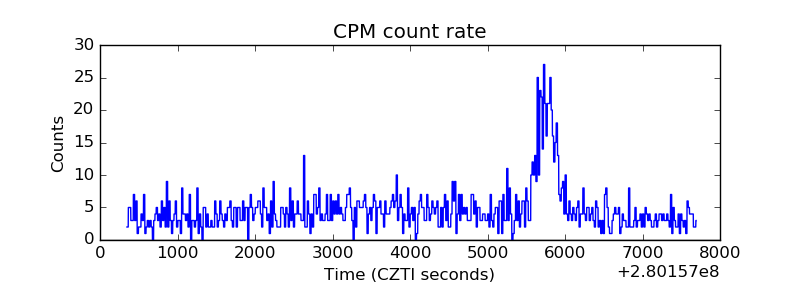 |
| CZT Counter | 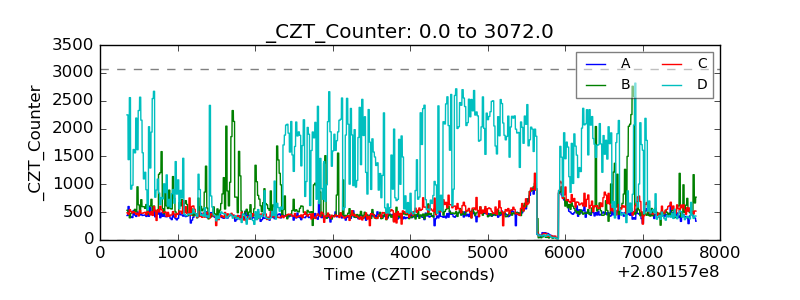 |
| +2.5 Volts monitor | 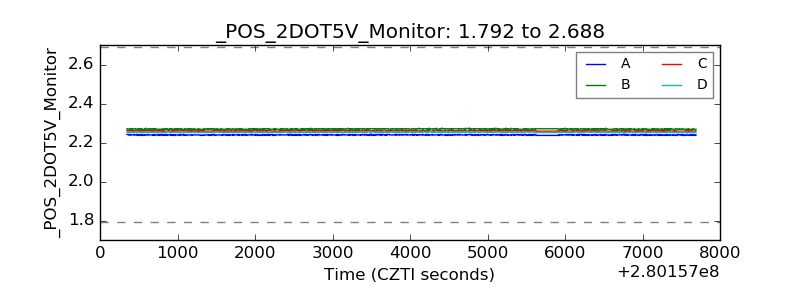 |
| +5 Volts monitor |  |
| _ROLL_ROT | 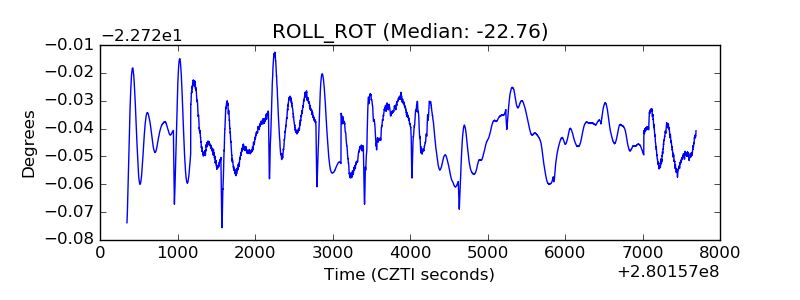 |
| _Roll_DEC |  |
| _Roll_RA | 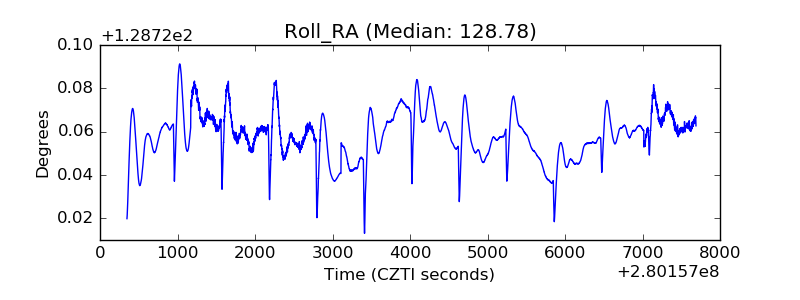 |
| Veto Counter | 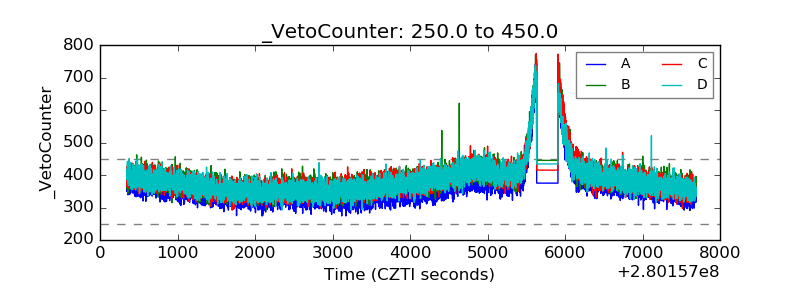 |