| Param | Original file | Final file |
|---|---|---|
| Filename | modeM0/AS1A05_188T01_9000002520_16972cztM0_level2.evt | modeM0/AS1A05_188T01_9000002520_16972cztM0_level2_quad_clean.evt |
| Size (bytes) | 1,641,052,800 | 229,072,320 |
| Size | 1.5 GB | 218.5 MB |
| Events in quadrant A | 8,308,617 | 1,510,561 |
| Events in quadrant B | 9,362,400 | 1,528,477 |
| Events in quadrant C | 10,817,204 | 1,469,669 |
| Events in quadrant D | 20,019,519 | 1,209,373 |
| Mode M9 | |||
|---|---|---|---|
| Quadrant | BADHDUFLAG | Total packets | Discarded packets |
| A | 0 | 18 | 0 |
| B | 0 | 18 | 0 |
| C | 0 | 18 | 0 |
| D | 0 | 18 | 0 |
| Mode M0 | |||
|---|---|---|---|
| Quadrant | BADHDUFLAG | Total packets | Discarded packets |
| A | 0 | 36819 | 3 |
| B | 0 | 39462 | 3 |
| C | 0 | 43831 | 5 |
| D | 0 | 71592 | 3 |
| Mode SS | |||
|---|---|---|---|
| Quadrant | BADHDUFLAG | Total packets | Discarded packets |
| A | 0 | 360 | 0 |
| B | 0 | 360 | 0 |
| C | 0 | 360 | 0 |
| D | 0 | 360 | 0 |
| Quadrant | Total seconds | Saturated seconds | Saturation percentage |
|---|---|---|---|
| A | 17677 | 274 | 1.550037% |
| B | 17678 | 314 | 1.776219% |
| C | 17677 | 331 | 1.872490% |
| D | 17677 | 4169 | 23.584319% |
Noise dominated data is calculated using 1-second bins in cleaned event files. If a bin has >2000 counts, and if more than 50% of those come from <1% of pixels, then it is considered to be noise-dominated and hence unusable.
| Quadrant | # 1 sec bins | Bins with >0 counts | Bins with >2000 counts | High rate bins dominated by noise | Noise dominated (total time) | Noise dominated (detector-on time) | Marked lightcurve |
|---|---|---|---|---|---|---|---|
| A | 19538 | 17681 | 97 | 97 | 0.50% | 0.55% | 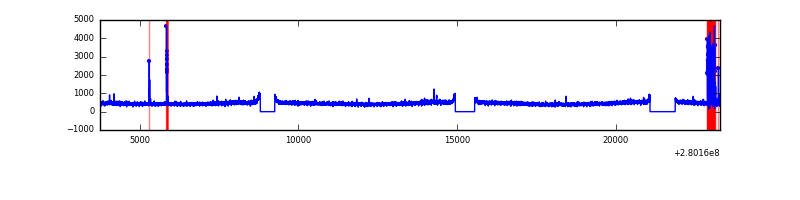 |
| B | 19539 | 17682 | 82 | 82 | 0.42% | 0.46% | 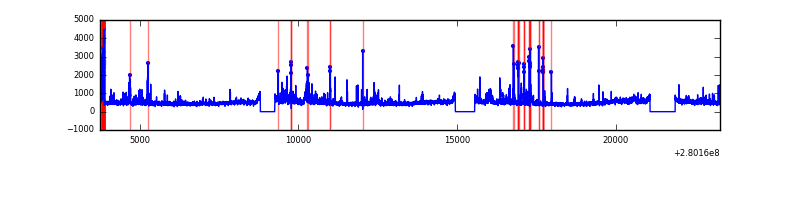 |
| C | 19538 | 17681 | 2 | 2 | 0.01% | 0.01% | 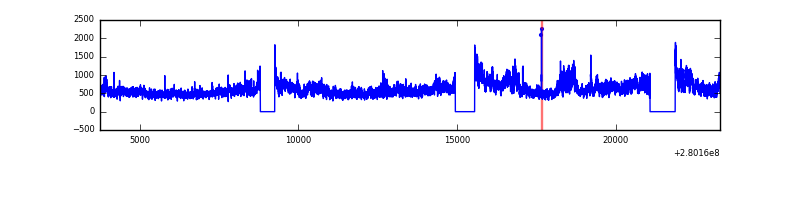 |
| D | 19538 | 17681 | 2904 | 2904 | 14.86% | 16.42% | 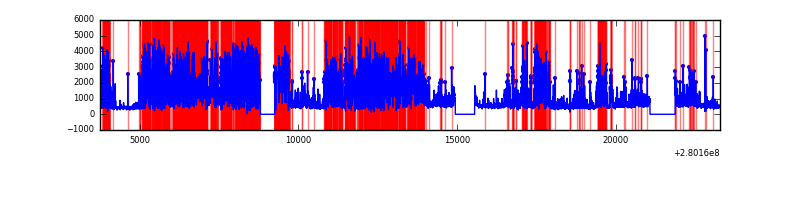 |
Top three noisy pixels from each quadrant. If the there are fewer than three noisy pixels in the level2.evt file, extra rows are filled as -1
| Pixel properties | Quadrant properties | ||||||
|---|---|---|---|---|---|---|---|
| Quadrant | DetID | PixID | Counts | Sigma | Mean | Median | Sigma |
| A | 15 | 174 | 325123 | 770.11 | 2071 | 2025 | 419.5 |
| A | 12 | 189 | 19273 | 41.11 | 2071 | 2025 | 419.5 |
| A | 0 | 226 | 18512 | 39.3 | 2071 | 2025 | 419.5 |
| B | 3 | 64 | 412765 | 1047.77 | 2074 | 2023 | 392.0 |
| B | 15 | 35 | 301007 | 762.68 | 2074 | 2023 | 392.0 |
| B | 3 | 209 | 131664 | 330.7 | 2074 | 2023 | 392.0 |
| C | 3 | 233 | 2642569 | 5682.9 | 1992 | 2005 | 464.7 |
| C | 14 | 238 | 306634 | 655.61 | 1992 | 2005 | 464.7 |
| C | 0 | 207 | 77261 | 161.96 | 1992 | 2005 | 464.7 |
| D | 1 | 52 | 12956260 | 30410.04 | 1753 | 1699 | 426.0 |
| D | 2 | 152 | 173332 | 402.9 | 1753 | 1699 | 426.0 |
| D | 10 | 70 | 124217 | 287.6 | 1753 | 1699 | 426.0 |
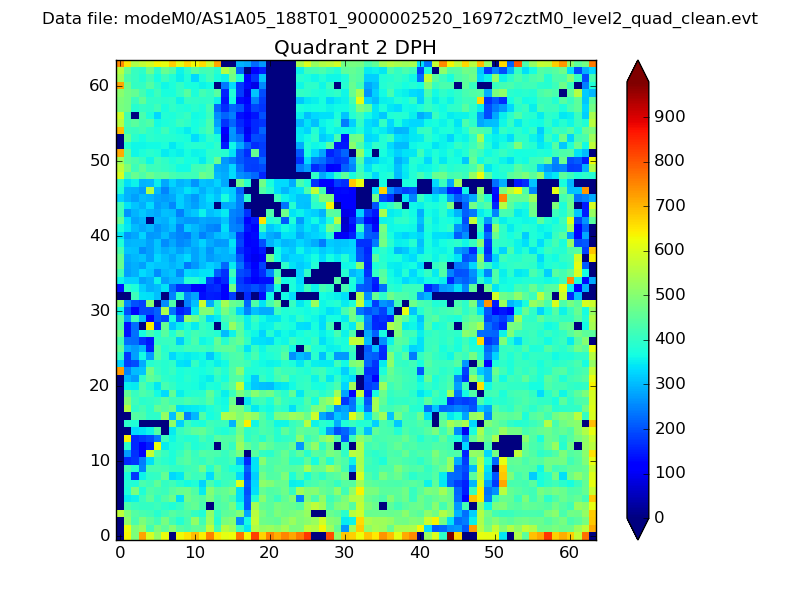
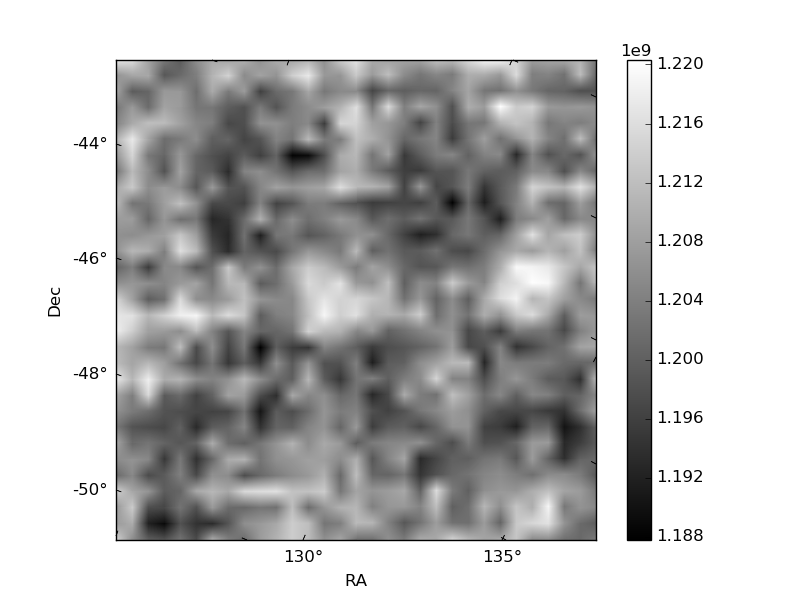
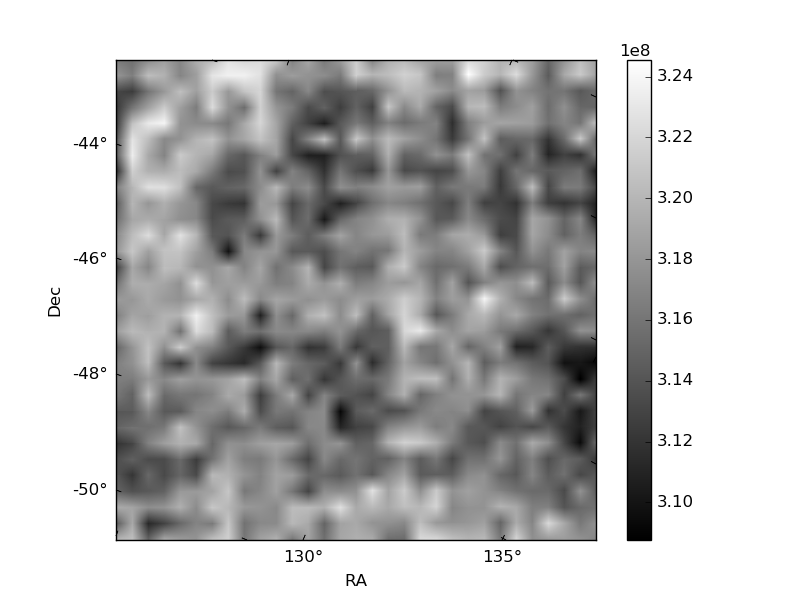
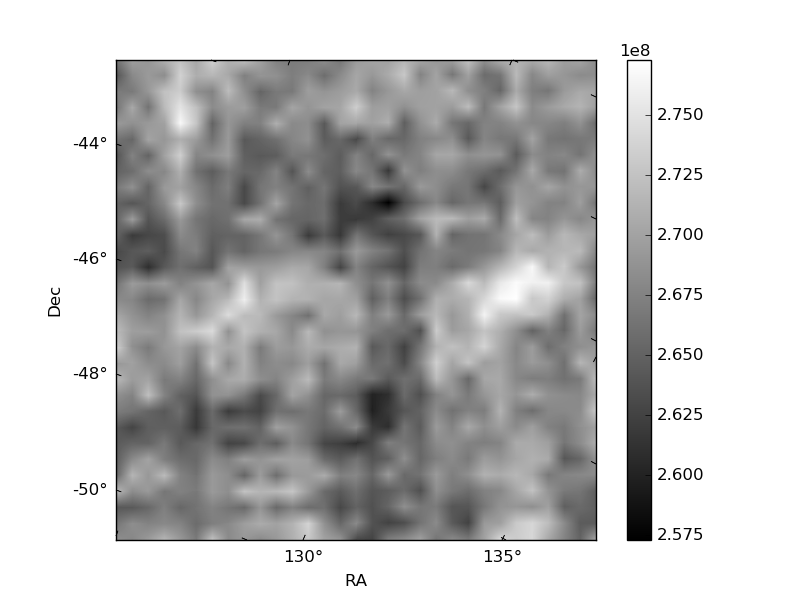
Histogram calculated using DETX and DETY for each event in the final _common_clean file
| Quadrant A | 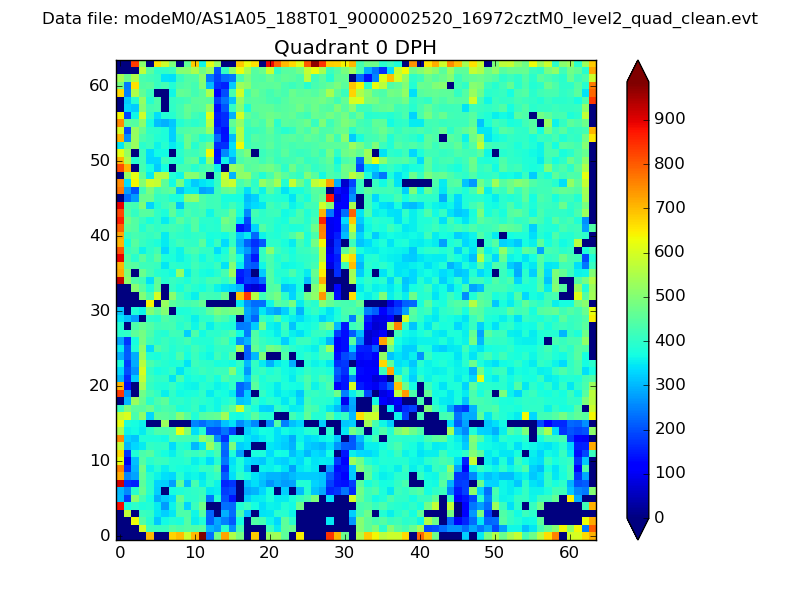 |
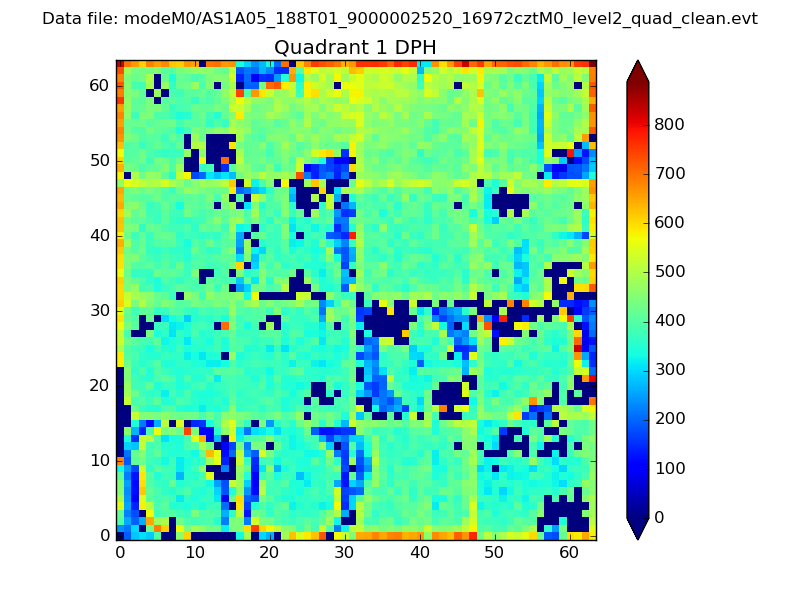 |
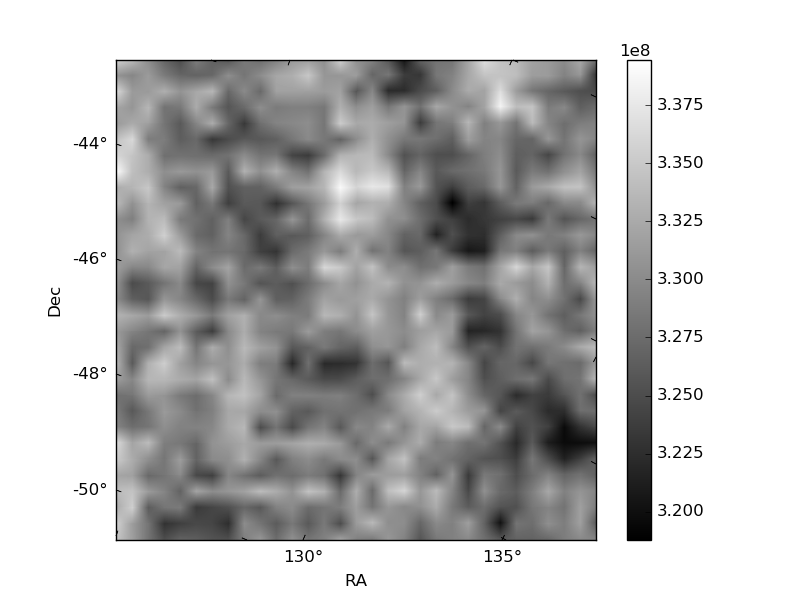
Quadrant B |
|---|---|---|---|
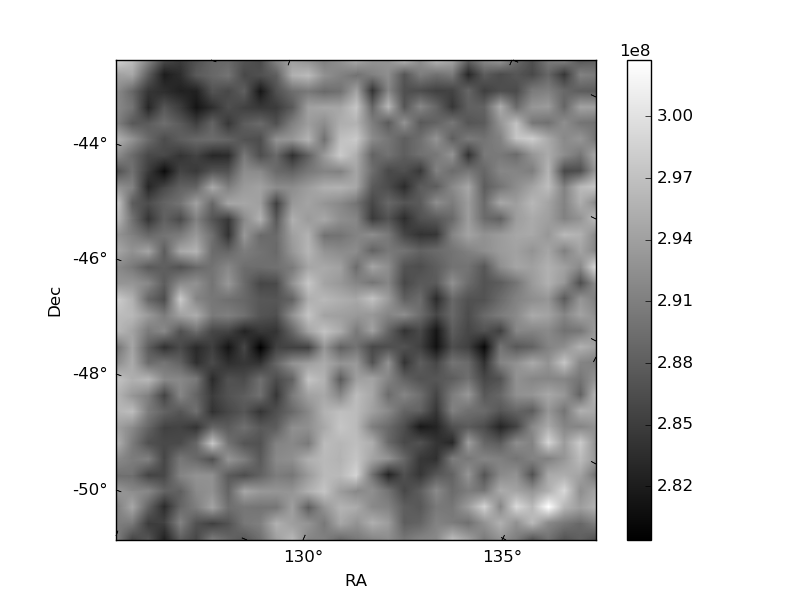
| Quadrant D | 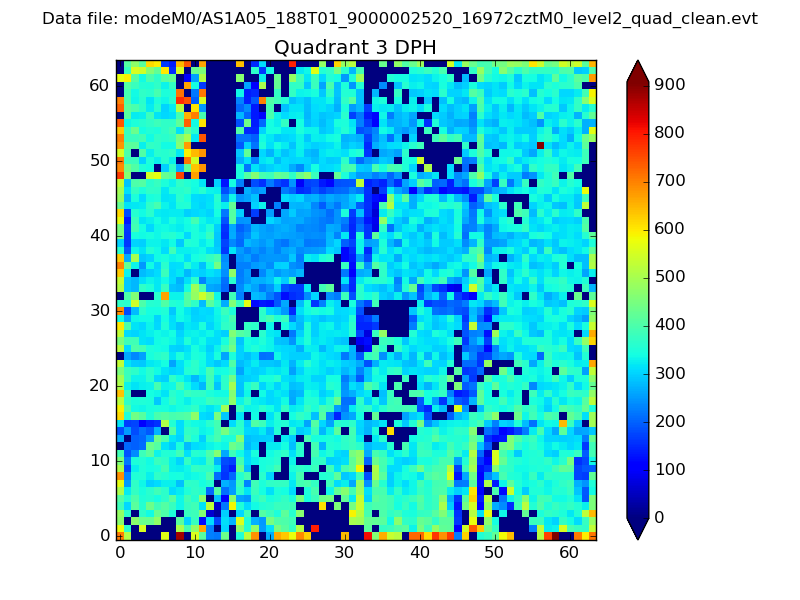 |
 |
Quadrant C |
| Plot type | Count rate plots | Images |
|---|---|---|
| Comparison with Poisson distribution Blue bars denote a histogram of data divided into 1 sec bins. Red curve is a Poisson curve with rate = median count rate of data. |
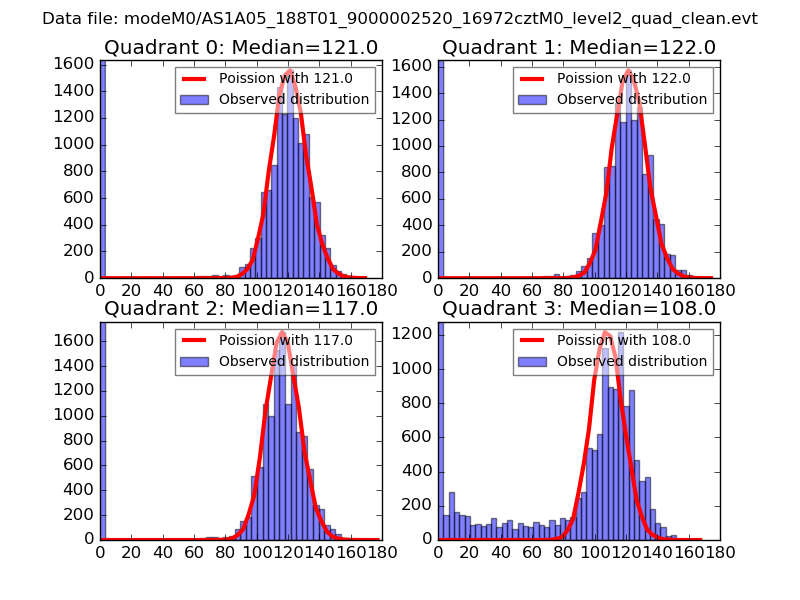 |
 |
| Quadrant-wise count rates Data is divided into 100 sec bins |
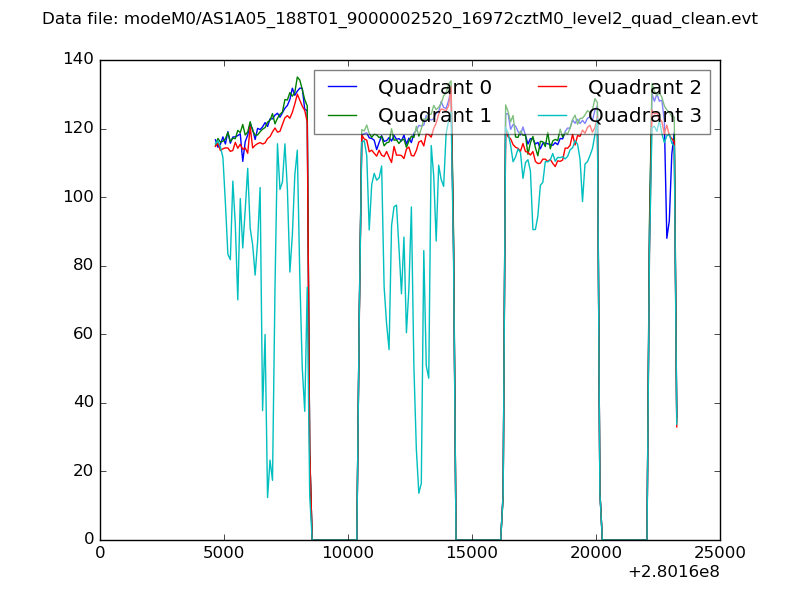 |
|
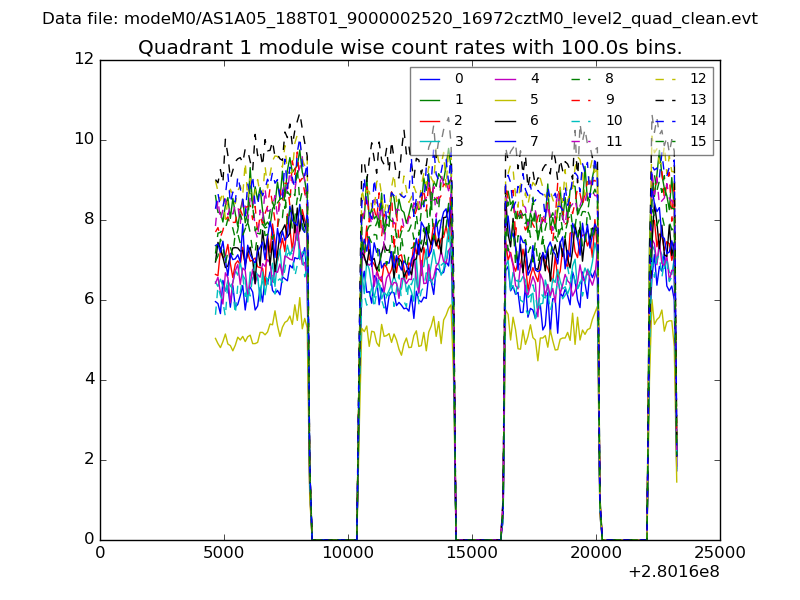
| Module-wise count rates for Quadrant A Data is divided into 100 sec bins |
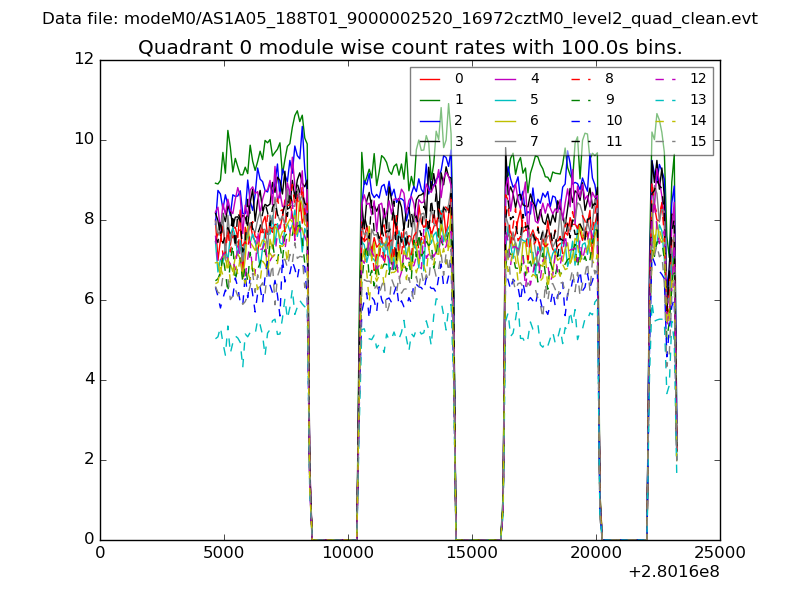 |
 |
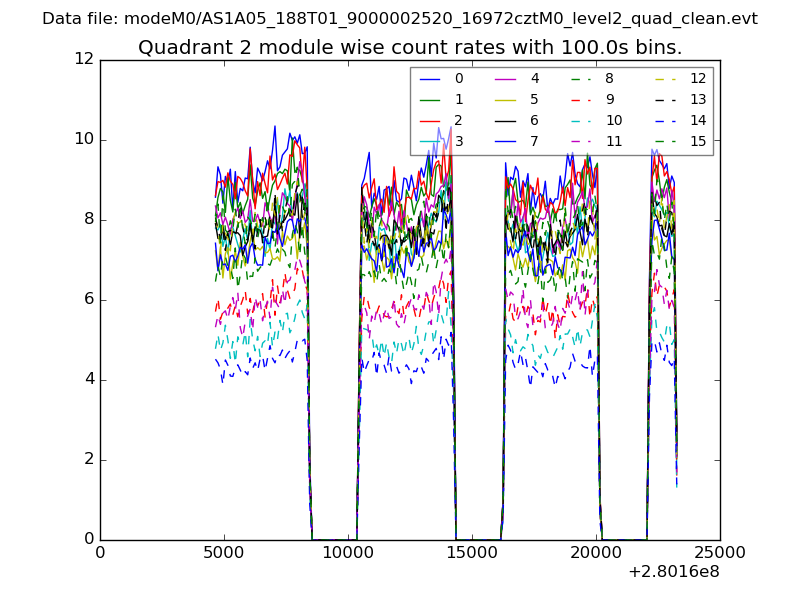
| Module-wise count rates for Quadrant B Data is divided into 100 sec bins |
 |
 |
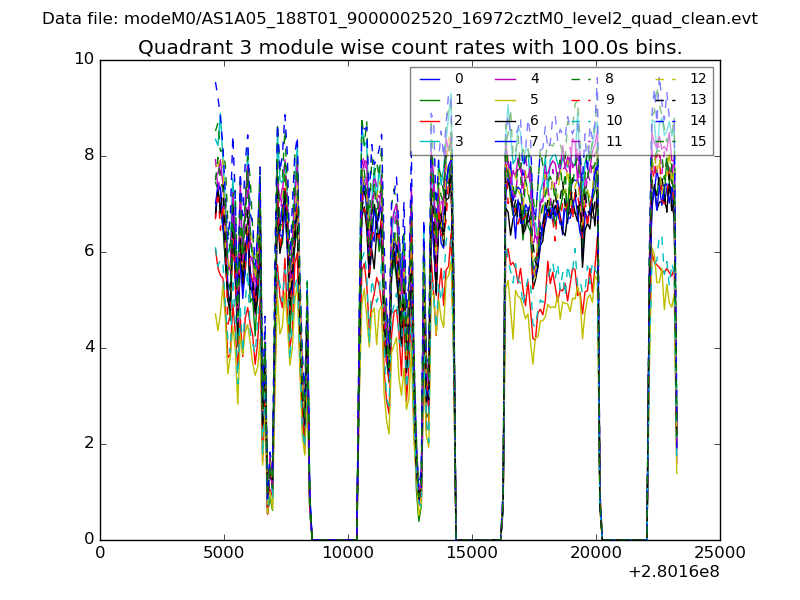
| Module-wise count rates for Quadrant C Data is divided into 100 sec bins |
 |
 |
| Module-wise count rates for Quadrant D Data is divided into 100 sec bins |
 |
 |
| Parameter | Plot |
|---|---|
| CZT HV Monitor |  |
| D_VDD | 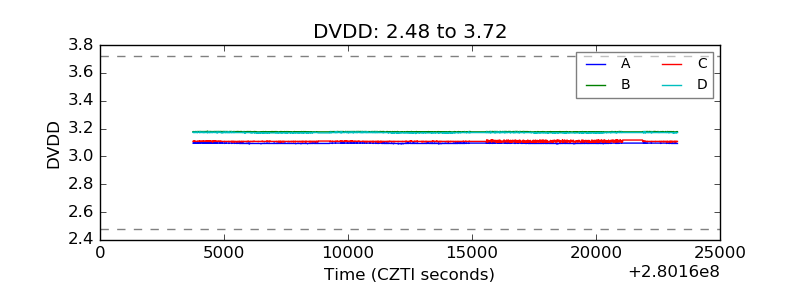 |
| Temperature 1 | 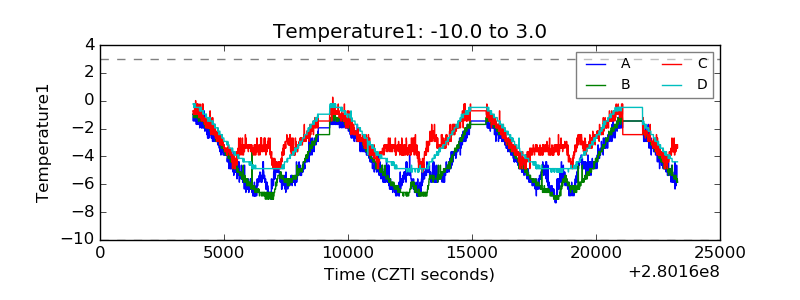 |
| Veto HV Monitor | 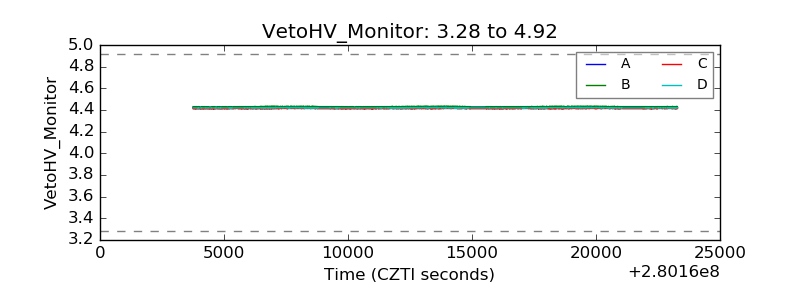 |
| Veto LLD | 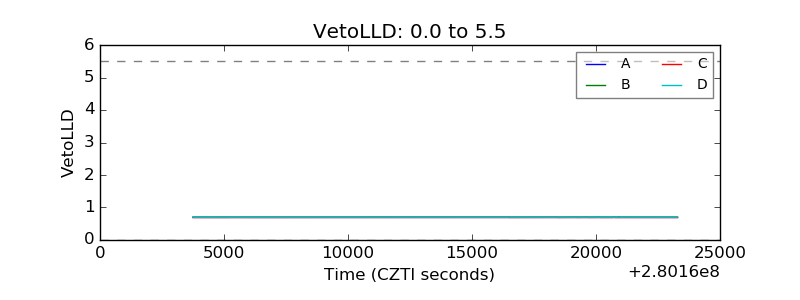 |
| Alpha Counter | 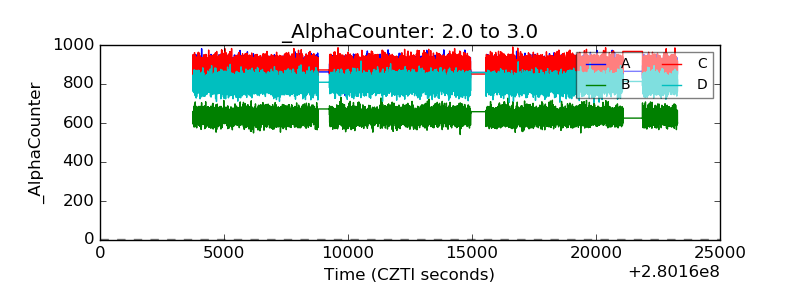 |
| _CPM_Rate | 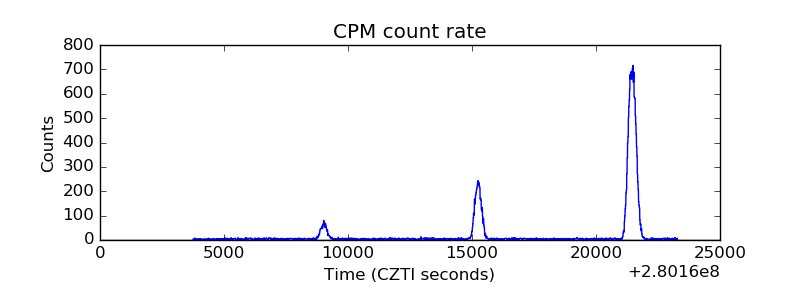 |
| CZT Counter | 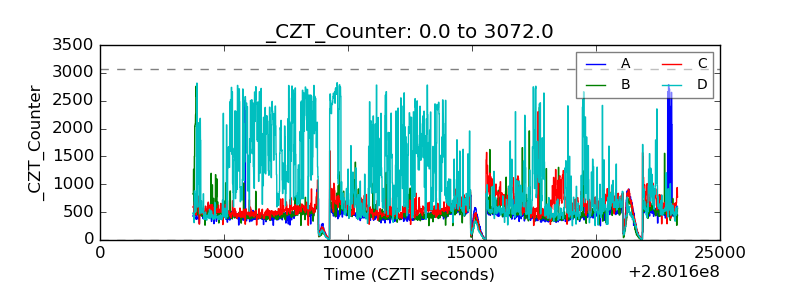 |
| +2.5 Volts monitor |  |
| +5 Volts monitor |  |
| _ROLL_ROT | 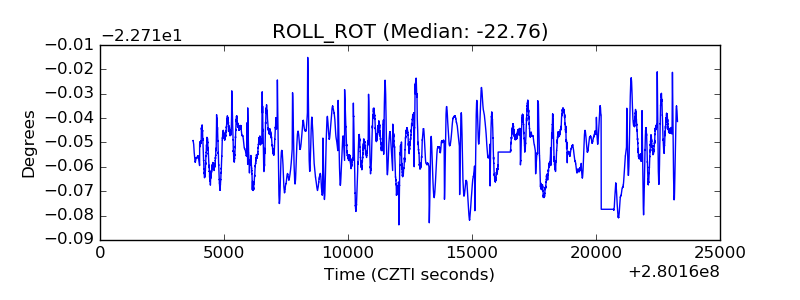 |
| _Roll_DEC | 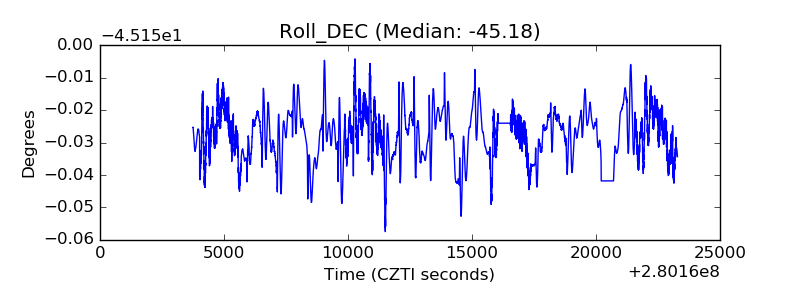 |
| _Roll_RA |  |
| Veto Counter | 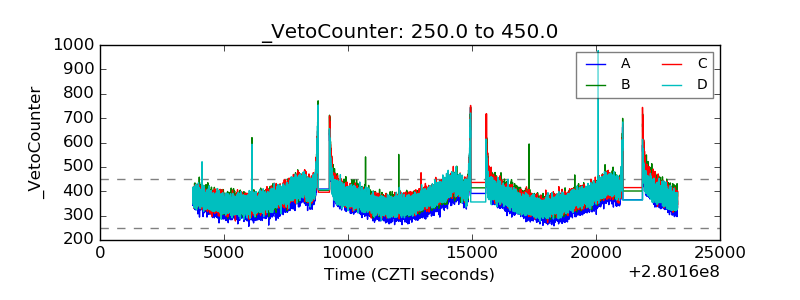 |